
2134.72.
That is the all-time record the S&P 500 Index (1948.86) notched on May 20. It is possible in the annals of stock market history this high will be viewed with the same level of trepidation/respect as 1553.11 (March 2000 peak) and 1576.09 (October 2007 peak).
It is difficult to know for sure – hence the word possible, not probable. With that said, several things are falling into place that have the potential to make this an important high.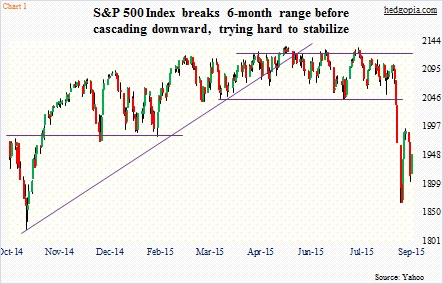
Shortly after the May peak this year, the S&P 500 broke the October 2014 trend line (Chart 1). That was an important bottom, as the index proceeded to add 17-plus percent in the next seven months. Since that trend line break, things have never been the same. What followed was sideways action for the next three months. One can argue the S&P 500 had been going sideways since February this year, with characteristics of a market that had fatigue written all over it. That became all too clear, come mid-August.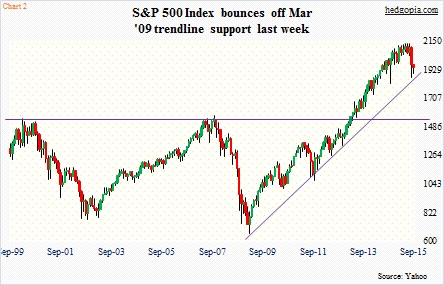
The index fell 11-plus percent in five sessions, in the process losing several important support levels, including 2040. Volatility spiked. A death cross followed. If there is any consolation in all this is that the index bounced off of the March 2009 trend line (Chart 2). Needless to say, a break of this trend line will probably suggest a big shift in the supply/demand dynamics.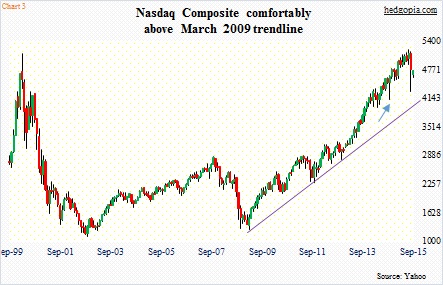
The March 2009 trend line is also intact on both the Nasdaq Composite (4749.98) and the Russell 2000 (1146.03). On the Nasdaq, in particular, it will not be tested until it drops to 4100, give and take; this also approximates the low in the middle of October last year (arrow in Chart 3). The low last week was higher than the mid-October low.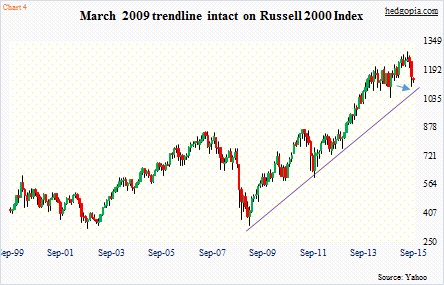
On the Russell 2000, the March 2009 trend line now approximates last week’s low (arrow in Chart 4). Even though it peaked a month later than the S&P 500, the Russell 2000 lost its mojo much earlier. The small-cap index had essentially been going sideways since March last year, broke the mid-October 2014 trend line in April, had two false breakouts, as well as formed a head-and-shoulders pattern. During the sell-off last week, the neckline was broken, with the low last week having come near the resulting measured-move downside target. Hence the importance of that low. Not to mention the fact that if broken it would mean a break of the March 2009 trend line.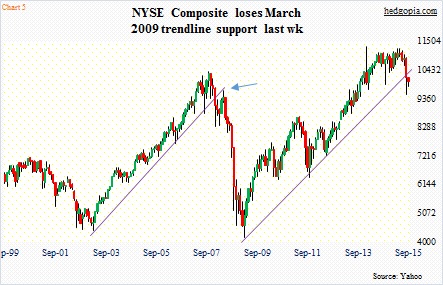
Not all the major indices have been able to save that trend line, with both the NYSE Composite (10013.36) and the Dow Industrials (not shown here) losing it last week. Once a trend line of this duration and magnitude is broken, more often than not its underside begins to act as resistance. Back in 2007, the NYSE lost the March 2003 trend line in January 2008, and a subsequent rally attempt was rejected right underneath that line (arrow in Chart 5).
The S&P 500 does not face that risk. Not yet anyway. Risks are rising.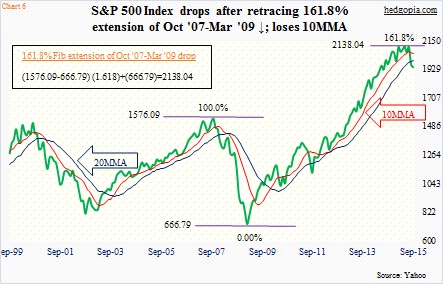
First off, the May high came up just a few points short of achieving an important milestone – retracing 161.8-percent Fibonacci extension of the October 2007-March 2009 decline (Chart 6). This is always a good spot for a pause/break of the prior trend. The index has also breached its 10- and 20-month moving averages. In the current bull market, the only other time it breached the 20-month moving average was back in 2011, when it dropped nearly 22 percent. Back then, there was a brief monthly bearish MACD crossover, but this time around it has sustained for four months.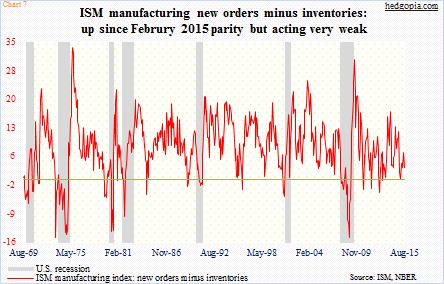
The overall mood is sour. Everyone blames China. Yes, China is part of the story. Nonetheless, everywhere you look, global PMIs are under severe stress. Just to focus on major Asian exporters, China (official) PMI registered 49.7 in August, South Korea 47.9, Japan 51.7, and Taiwan 46.1. Here at home, the ISM manufacturing index was 51.1 – the lowest since May 2013. New orders dropped to 51.7. The difference between orders and inventories is barely above parity (Chart 7).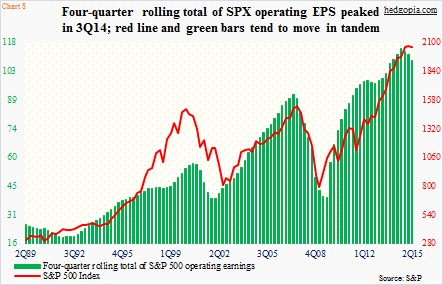
The deterioration in price action in the S&P 500 has also been accompanied by earnings deceleration. We can blame energy all we want, but the fact remains that 2015 operating earnings estimates are now slated to drop – $111.61 (as of August 31st) versus $113.02 in 2014. The four-quarter rolling average peaked at $114.51 in 3Q14, with 2Q15 at $108.34 (Chart 8). In August alone, estimates dropped by $3.12. The index fell 6.3 percent during the month.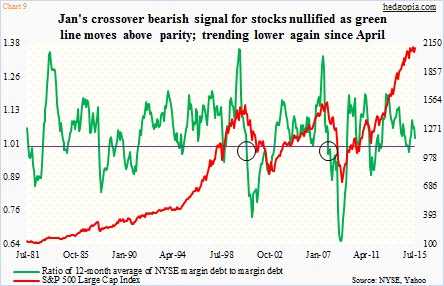
Here is the thing. NYSE margin debt fell 3.5 percent in July. Given the shellacking stocks received in August, it is not inconceivable to think of a similar drop in August. Should that happen, Chart 9 would flash at least a yellow signal. During the last two bear markets, stocks came under sustained pressure once the green line sustained below one.
In the near-term, there is plenty of room to rally given how oversold conditions are. The Hedgopia Risk Reward Index continues to hover near the upper band of the green zone (Chart 10)… would be great if it drops further toward the lower band. Regardless, at some point it will make a move – to the upside. As a matter of fact, the S&P 500 can rally another five percent and still face rejection at 2040 – a broken support zone.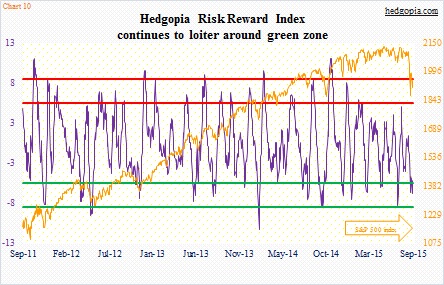
The wild card in all this is the Fed. The louder a bear growl, the higher the odds of another iteration of QE. The only question is, how would the markets react then? If a Fed that was all set to begin a tightening process ends up launching another round of stimulus, would that hurt or boost investor confidence once the initial euphoria wears off? It is not worth hazarding a guess. Price will tell us. In the meantime, price action is increasingly telling us that right now it is bears’ ball to lose.
Thanks for reading!
