Major U.S. indices reversed from early strength yesterday. As a matter of fact, it took less than an hour – half an hour in most cases – before things began to turn south. From the S&P 500 large cap index to the Nasdaq composite to the Dow Industrials to the NYSE composite, the early pop was used as an opportunity to bail out. Trying to pinpoint a reason will get us nowhere. There was none.
This has come on the heels of last week’s action in which several indices broke out; stops probably got taken out, and shorts probably got squeezed. Bulls were looking for a follow-through that never materialized, and they bailed out. This is the most reliable hypothesis one can come up with.
Not everything was in sync when indices were breaking out last week. On Friday, on a day the Nasdaq rallied 0.7 percent, internals were weak – sub-800 advancers versus sub-2,000 decliners, among others.
Monday has now given us nasty looking candles on a daily chart. The only question is, is impending weakness short- or medium-term?
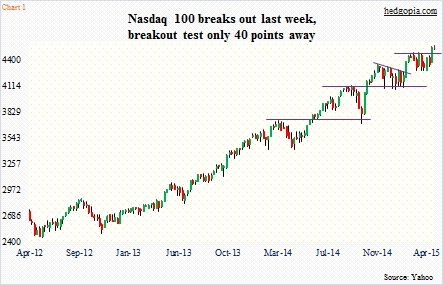
The Nasdaq 100 can very well be setting up for an island reversal (on a daily chart). It gapped up on Friday. Monday traded higher than Friday’s, before selling off. It better not gap down today. AAPL delivered in its March quarter, and then some. Expectations were very high going in. The stock is up $3 pre-open. Weekly options were pricing in a $7 move post-earnings. On the Nasdaq 100, even if the island reversal formation does not complete, yesterday was a distribution day, led by biotechs. Moreover, AAPL produced a spinning top yesterday, right near its all-time highs. We will see what today’s session brings.
An even more important question is, was Friday’s session an exhaustion gap?
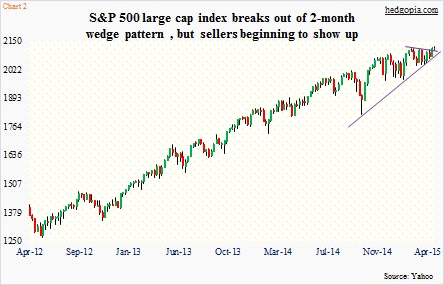
Too soon to tell, but yesterday’s selling did come near an important juncture on the S&P 500. The intra-day high was 2126, not too far away from 2138, which is the 1.618 Fibonacci extension of the October 2007-March 2009 decline. Last week, it broke out of a two-month wedge, and tried to build on it, but that was not to be. The initial enthusiasm yesterday lasted half an hour. Makes one wonder, was the breakout merely a result of short-covering?
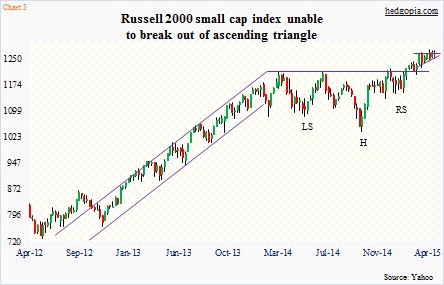
Similarly, the Russell 2000 small cap index completed a reverse head-and-shoulder pattern a month and a half ago, fueling a lot of optimism. The index is still above it. But in the prior five weeks, it has been going sideways – in an ascending triangle – once again raising hopes of a breakout. But it broke down yesterday. There are four more sessions left in the week. But yesterday was a distribution day.
Each of these three indices – and others – are not that far away from must-hold levels. They include 4480 on the Nasdaq 100 (4525), 1215 on the Russell 2000 (1253) and 2080 on the S&P 500 (2109).
Bulls’ resolve is being tested.

