
- March starts off by notching new highs for most U.S. indices
- Giddy investor sentiment – from pros to newsletters to individuals
- If past is guide, it pays to pull in horns when crowd becomes worry-free
Uh-oh!
The Nasdaq composite on Monday crossed the 5000 mark – the only other time after March 2000 it has achieved that feat. Major indices, including the S&P 500 large cap index, the Dow Industrials, and the Russell 2000 small cap index, among others, all rose to new all-time highs that day.
So it is perhaps an opportune time to look at just how bullish investor sentiment is these days. Turns out, quite bullish. As a matter of fact, excessively so. Hence the feeling, ‘uh-oh’!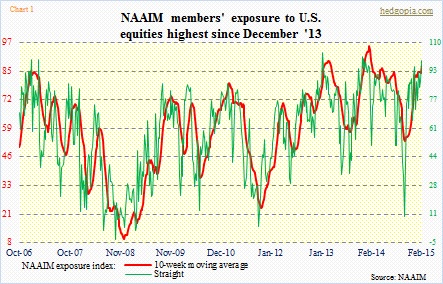
Take a look at Chart 1. The NAAIM (National Association of Active Investment Managers) Exposure Index measures members’ average exposure to U.S equity markets. These are professionals, not any Tom, Dick and Harry. The latest reading makes one want to ask: Is any U.S. active manager out there left to be bullish? The 99.2 count is the highest since December 2013. As the chart shows, it is not too often the reading gets this high. In fact, even high-80s is rare.
These pros are not alone.
Among newsletter writers, for the second successive week, there were at least four times the number of bulls than bears last week, with the ratio of 4 and 4.2, respectively. The last time the ratio was this high for two successive weeks was early September last year. That did not end quite well. To be fair, if we go back to late-2013 to early-2014, there were six consecutive readings in the 4’s. So it is always possible these writers’ bullishness persists for a while longer. We will find out if the streak continues when the latest number is reported later today. But the takeaway here is that these are very high readings, and leave room wide open for reversal.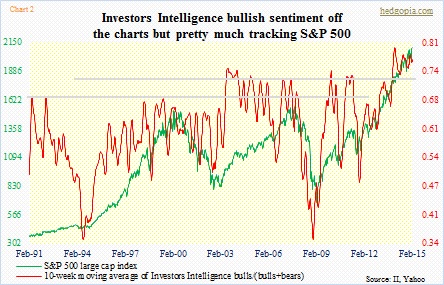
One other thing that can be noticed in Chart 2 is that the red line has sustained at a high plateau for over a year now. The so-called ‘Fed put’ may have had something to do with it. But when these readings reverse, more often than not the reaction will/can be quick. During the September-October sell-off last year, the NAIIM reading, for instance, dropped from 82.5 on September 3rd to just under 10 on October 15th.
The bigger the party, the bigger the hangover, as the saying goes. But it is also human nature (for most people anyway) not to want to rack your brains about the latter while the former is in full swing.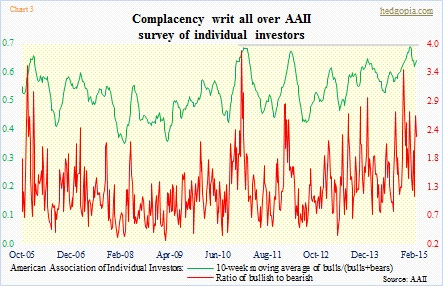
As can be expected, as far as individual investors go it is a party time. At least that is what is reflected in the American Association of Individual Investors survey (Chart 3). Four out of the past five weeks, the ratio of bulls to bears has been either north of two or just under two. The green line is not as elevated as it was late December last year, but remains very high.
Historically, whenever these readings – all three – are this high, it pays to get cautious on equities. Things have tilted too far to one side. Risk is elevated.
On a separate, but related, note, the AAII informed us yesterday that in February individual investors’ equity allocations rose to their second-highest level since June 2007. The 68.3-percent allocation compares to the historical average of 60 percent.
Uh-Oh!
