The following are futures positions of non-commercials as of November 17, 2015. Change is week-over-week.
10-year note: Hawks are in, doves are out.
At least that is how markets are beginning to bet on the odds of an interest-rate hike in December. The two-year Treasury bill – the most sensitive to Fed policy – is now yielding 0.93 percent, versus 0.57 percent as early as mid-October. Fed funds futures are pricing in a 64-percent chance of a hike next month, although the odds were in the 70s a couple of weeks ago.
Commentary from most strategists and economists has coalesced around belief that a hike would be good news for stocks and the economy – the premise behind the thinking being a hike reflects the Fed’s conviction in the economy. A debatable point.
The best signal will probably come from the collective wisdom of bond vigilantes. A couple of thoughts on this.
1. Markets, which are acting as if a December hike is a foregone conclusion, also expect either a ‘one and done’ or a very shallow tightening cycle.
The Fed either is trying to prepare for the next downturn by filling its monetary quiver with arrows or genuinely believes that both the economy and inflation will pick up speed next year. In the latter, unless crude oil takes another leg lower, it is possible headline consumer inflation begins to perk up next year. In this scenario, the sword of ‘tightening’ Damocles continues to hang over head.
2. The long end of the curve is yet to buy into ‘all is hunky-dory’ scenario. Two weeks ago, reacting to the stronger-than-expected October jobs numbers, the 10-year yield rose to 2.34 percent. By Friday, this had dropped to 2.26 percent. Between the periods, the two-year yield rose by three basis points, and the 10-2 spread narrowed by 11 basis points. The curve needs to steepen in order for the Fed to convince the markets that higher rates bode well for the economy.
Currently net short 48.1k, up 11.1k.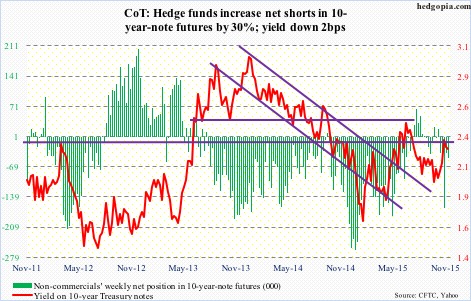
30-year bond: Next week’s major economic releases are as follows. Happy Thanksgiving!
October’s existing home sales are due out on Monday. They were up 4.7 percent in September, to a seasonally adjusted annual rate (SAAR) of 5.55 million units, essentially on par with July’s 5.58 million, which was the highest since 5.79 million in February 2007. On a related note, the pending homes sales index in September dropped to 106.8 from 109.3 in August. It peaked at 112.3 in May this year – the highest since 112.5 in May 2006. Watch out for potential weakness in existing home sales in the months to come.
New home sales were weak in September, down 11.5 percent, to 468,000 units (SAAR). The 12-month running average was flat month-over-month at 496,000 – the first time since July last year it failed to rise m/m. October’s numbers will be published on Thursday.
On Tuesday, we get the second estimate of 3Q15 GDP. Real GDP decelerated to growth of 1.5 percent, from 3.9 percent sequentially. In the current recovery, growth has averaged a sub-par 2.2 percent, versus 3.2 percent going back to 2Q47.
Also on Tuesday, the preliminary estimate of 3Q15 corporate profits will be released. In 2Q15, profits with inventory valuation and capital consumption adjustments were $2.08 trillion (SAAR), up 3.5 percent quarter-over-quarter, but have been decelerating since $2.16 trillion in 3Q14.
The advance report on durable goods for October will be released on Wednesday. This series has lost momentum. Orders for non-defense capital goods ex-aircraft – proxy for business capital expenditures – peaked at $74 billion (SAAR) in September last year. A year later, they were $68.8 billion; year-over-year, they have dropped for eight consecutive months.
Also on Wednesday, personal income for October is scheduled for release. With the Fed scheduled to meet on December 15-16, a lot of eyes will be focused on the personal consumption expenditures price index – the Fed’s favorite measure of consumer inflation. In September, it increased at an annual rate of 1.3 percent. The last time it registered two-percent growth was back in April 2012.
Wednesday also brings us the University of Michigan’s final reading of consumer sentiment for November. The preliminary reading was 93.1, up from 90 in October. The cycle high of 98.1 was recorded in January this year.
Currently net short 20.8k, up 4.1k.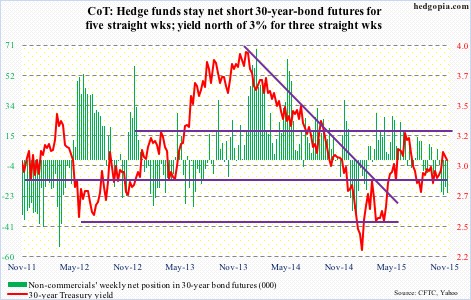
Crude oil: For the week ended November 13th, the EIA data was balanced/slightly positive.
Crude imports fell by 409,000 barrels a day, to 6.97 million b/d.
Crude production fell by 3,000 b/d, to 9.18 mb/d. The prior week was at a 10-week high. Production peaked at 9.61 mbpd in the June 5th week.
Refinery utilization continued to inch up, to an eight-week high of 90.3 percent. Utilization has increased for the fifth straight week. Earlier, it peaked at 96.1 percent in the August 7th week.
Distillate stocks fell by 791,000 barrels, to 140.3 million barrels – a 19-week low.
These were offset by a rise in crude and gasoline stocks. The former rose 252,000 barrels, to 487.3 million barrels. This was the eighth straight weekly increase, with stocks at the highest since the April 24th week. Gasoline stocks rose a million, to 214.3 million barrels, from the prior week’s 12-week low.
This, along with the fact that spot West Texas Intermediate crude remains way oversold on a daily chart, attracted some bidding. For the week, it rallied nearly two percent.
That said, it is tough to ferret out which way the WTI might be headed near-term. On a weekly chart, there is room for it go lower still. If weekly conditions prevail, they will end up dragging the daily’s along. In this scenario, spot WTI will at least test last Monday’s low of 40.06.
That said, this week produced three daily dojis. Oil bulls and bears are not willing to give an inch at this stage. Horns are locked.
Currently net long 260.9k, up 12k.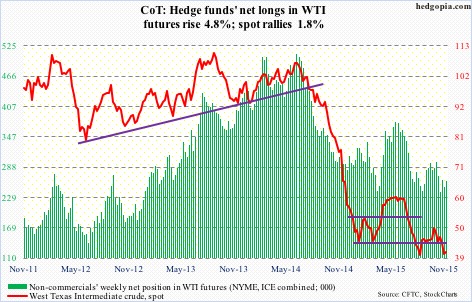
E-mini S&P 500: Since the September 29th low in U.S. stocks, equity bulls have done a marvelous job of squeezing the shorts. But they have been equally ineffective in attracting new money.
For the week ended Wednesday, $2.2 billion left U.S.-based equity funds (courtesy of Lipper). This comes on the heels of $1 billion in outflows in the prior week. Since the week ended September 30th, a total of $8.8 billion has moved into equity funds. Not much to write home about if we are to believe in the sustainability of this rally. Short-covering can only go so far.
This is particularly so considering foreigners have been shunning U.S. stocks for a while now. The last time the 12-month running total of net foreign purchases of U.S. equities was positive was in October 2013. This September, this stood at a minus $95 billion, up from negative $7.2 billion in March this year (TIC data).
Last but not the least, credit markets are weakening, even as stocks are rallying. One of the two will eventually win out – either stocks drag credit higher, or the latter drags the former lower. It is possible the prevailing wider spreads have to do something with a pickup of late in corporate debt issuance, but the situation needs to reverse if we continue to give stocks the benefit of the doubt.
Non-commercials stayed with their relatively high net shorts.
Currently net short 125.8k, down 2k.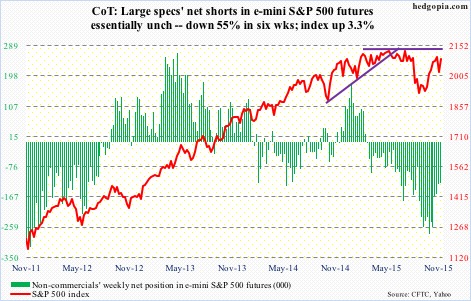
Euro: Increasingly it feels like the ECB is taking a cue from the Fed, with an assortment of bank officials offering conflicting opinion.
ECB chief economist Peter Praet on Tuesday said downside risks to the Eurozone economy may have increased due to the terrorist attack in Paris. Implication: More stimulus is needed.
A day later, Wolfgang Schaeuble, German finance minister, said “I would prefer higher interest rates than we have today”, at the same time recognizing that the ECB has to set monetary policy to fit 19 national economies.
Yesterday, Mario Draghi, ECB president, in a speech to a banking conference, had another opportunity to send a signal to the market, and he did not waste it, saying the bank is prepared to deploy its full range of stimulus measures to fight low inflation.
He has now increasingly painted himself into a corner, and will probably have to announce something at the December 3rd meeting.
Having dropped seven-plus percent in a little over a month, the euro is ready for it. Either way, the odds of a rally are growing. If Mr. Draghi does not oblige, the euro surges. If he obliges, the odds of a ‘buy the news, sell the rumor’ have grown.
Currently net short 164.2k, up 21.2k.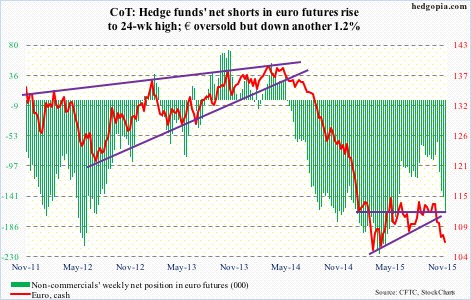
Gold: In a little over a month, spot gold gave back nearly 11 percent. That drop has brought the metal to testing the July (this year) low. As a matter of fact, that low was slightly undercut last week, before bouncing.
Having retraced 50 percent of the July 1999-September 2011 advance, the yellow metal is currently sitting on an important technical level.
If it can hang in around here for maybe one more week, odds favor the recent low holds – at least near-term. Maybe even medium-term. We will see.
Not surprisingly, this area is being fought very hard by both the bulls and bears. There were two back-to-back daily dojis.
Currently net long 34.4k, down 34k.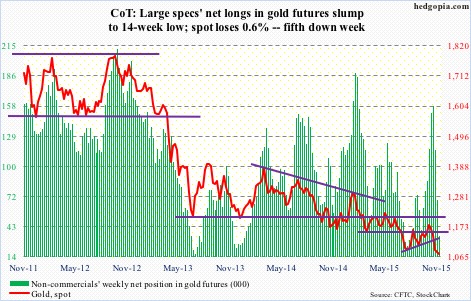
Nasdaq 100 index (mini): Back above it again. The 4560 level, that is.
For the umpteenth of time since April this year, this area has acted as a magnet – not only to attract but also to repel. Bulls lost it last Friday, only to recapture this Wednesday.
AAPL, with a 13-percent weight in the index, helped big time – up 6.2 percent. Of late, the biggest contribution has come from just a handful of large-caps. Breadth is narrow. Not healthy, come to think of it, but enjoy while it lasts.
Non-commercials have done a good job of being on the right side of the current rally, and for the first time in seven weeks cut back.
Currently net long 68.9k, down 12.7k.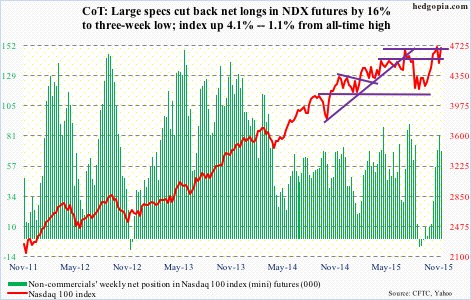
Russell 2000 mini-index: The last time the small-cap index was above its 200-day moving average was on August 17th, right before the seven-day, 10-percent drop. Other major large-cap-dominated U.S. indices went on to recapture that average. But not the Russell 2000.
The good thing, from small-cap bulls’ perspective, is that the index took out the 1170 level this week – though ever so slightly. A bigger hurdle remains overhead – 1210-1215.
Bulls need to build on this week’s action – if nothing else not to let the 50-day moving average, which is just about flat, begin to turn lower.
Non-commercials continue not to buy the small-cap story.
Currently net short 45.3k, up 2.4k.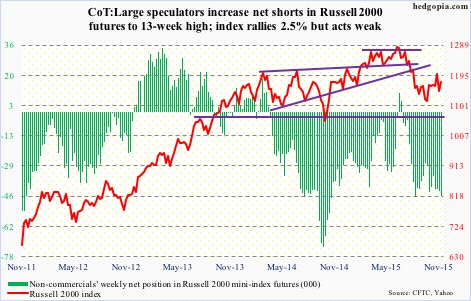
US Dollar Index: The spot has been rallying incessantly since the middle of October, up 6.5 percent through Wednesday’s intra-day high – 1.1 percent from the March 2015 high. Go back to July last year, and it has rallied nearly 26 percent.
Between the July 2001-April 2008 decline, the US dollar index dropped 41 percent. The subsequent rally to that March high brought it close to retracing nearly 61.8 percent of the decline. This is a Fibonacci number, and technicians pay close attention to it. This is as good a place as any for momentum to stop/pause.
At least near-term, some signs of fatigue are showing up.
Non-commercials continue to add to net longs, but do not look as enthusiastic as they were when the dollar index was trading at a similar level back in March/April.
Currently net long 46.5k, up 2.7k.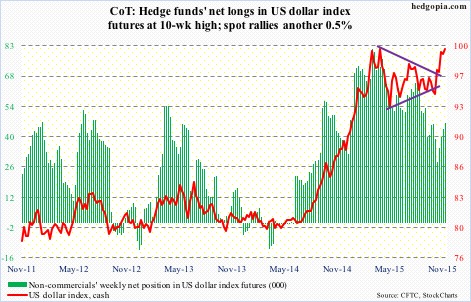
VIX: The spot dropped 23 percent in the week, and has room to drop more, if equity bulls can capitalize on it.
Last week, it retook both its 50- and 200-day moving averages. This week, it lost both.
Currently net short 10k, up 1.4k.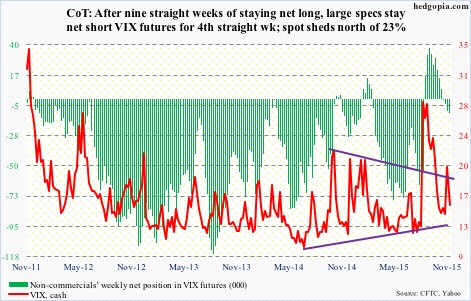
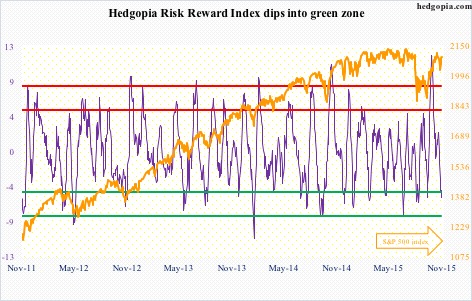
Hedgopia Risk Reward Index