The following are futures positions of non-commercials as of December 8, 2015. Change is week-over-week.
10-year note: Until Thursday, the two-year Treasury note yielded 0.95 percent, near recent highs of 0.96 percent. Come Friday, it dropped seven basis points, to 0.88 percent. Yields were under pressure throughout the curve, with the 10-year dropping 14 basis points.
The two-year in particular was yielding 0.57 percent as early as the middle of October, and progressively rose, pricing in a hike in the fed funds rate next week.
The Fed has made it amply clear that it wants to move. What is yet to be determined is the future course of action. It is too soon to say if this week’s drop in equities and Treasury yields will influence the Fed’s intentions going forward.
This much we do know.
The Fed will be tightening even as both the Eurozone and Japan are still easing. Ditto with China, with a weaker yuan to boot. These three countries/regions make up 60 percent of the global economy.
The Fed has a tough hand to play.
Currently net short 24.5k, down 40.1k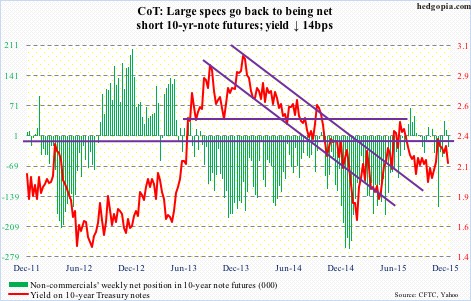
30-year bond: This week’s major economic releases are as follows.
FOMC meeting begins on Tuesday, and ends the next day. Are markets genuinely ready for a hike? We will find out – particularly when it comes to medium- to long-term.
Tuesday has three other releases – CPI for November, December’s preliminary reading of the NAHB housing market index, and Treasury International Capital for October.
Consumer prices rose 0.2 percent in October, after two straight months of decline. In the 12 months through October, the CPI advanced 0.2 percent as well. Core CPI rose 0.2 percent and 1.9 percent, respectively. Annual core prices are rising at a faster rate than core personal consumption expenditures, which in October rose 1.3 percent.
The housing market index slid three points to 62 in November. October’s was the highest since 68 in October 2005.
In September, China held $1.26 trillion in Treasury securities, down $13 billion month-over-month. Holdings peaked at $1.32 trillion in November 2013.
Housing starts for November are published on Wednesday. Of late, the rather ebullient builder confidence is being reflected in starts. In October, they fell 11 percent month-over-month. Monthly data of course tend to be volatile. The 12-month rolling average has been north of a million units in 12 of last 13 months; that said, October was the first time in seven months it did not grow month-over-month – 1.084 million units versus 1.086 million in September.
Also on Wednesday, we get industrial production for November. Capacity utilization was 77.5 percent in October, down from 79 percent last November. Year-over-year, utilization has dropped for six straight months.
Besides Janet Yellen’s, Fed chair, post-FOMC meeting press conference, Jeffery Lacker, president of the Richmond Fed, speaks on Friday.
Currently net short 20.9k, down 4.6k.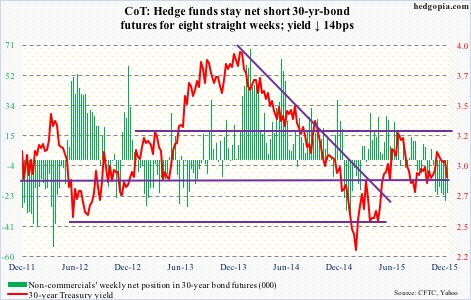
Crude oil: The black gold is still reeling from OPEC’s decision last week not to make any effort to curb overproduction. It has a quota of 30 million barrels per day, but of late the cartel has been pumping out over 31 mbpd. In November, production increased month-over-month by 230,100 barrels a day, to 31.695 mbpd.
No wonder both Chevron Corp. (CVX) and ConocoPhillips (COP) are slashing their budgets for next year – the former by 24 percent, to $26.6 billion, and the latter by 55 percent, to $7.7 billion.
In the end, the drop in crude stocks for the week ended December 4th was no help to the price. Stocks dropped by 3.6 million barrels, to 485.9 million barrels – a five-week low.
Production fell, too, down 38,000 barrels per day, to 9.16 mbpd, essentially wiping out the prior week’s increase. Production peaked at 9.61 mbpd in the June 5th week.
The rest of the EIA data leaned bearish.
Gasoline stocks rose by 786,000 barrels, to 217.7 million barrels – a six-week high.
Distillate stocks rose by five million barrels, to 149.4 million barrels – a 10-week high.
Capacity utilization fell 1.4 percentage points, to 93.1 – the first week-over-week drop in eight weeks. Utilization peaked at 96.1 percent in the August 7th week.
And crude imports rose by 274,000 barrels a day, to eight mbpd – a 16-week high.
Last week, crude sat on August lows, and and looked like it wanted to go lower on a weekly chart. This week, it collapsed, down nearly 12 percent.
Non-commercials continue to cut back, with net longs at a three-year low.
Currently net long 207.3k, down 10.5k.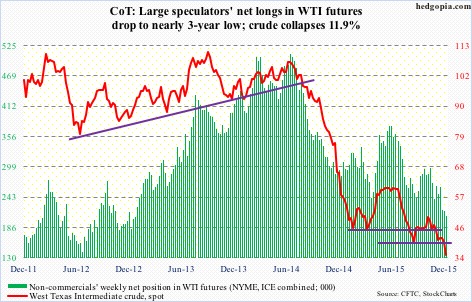
E-mini S&P 500: The index this week fell out of the pennant it had carved out for itself.
Flows continue not to cooperate. For the week ended Wednesday, $8.6 billion was withdrawn from U.S.-based equity funds (courtesy of Lipper). Since September 30th, inflows have only totaled $2.2 billion. In the meantime, in the past three weeks north of $37 billion has move into money-market funds.
Foreigners have been shunning U.S. stocks for a while now. In September, the 12-month running total stood at minus $95 billion. The last time this metric was positive was October 2013.
Data such as these give reason for shorts to hang in there, and they have.
As of the end of November, NYSE short interest is down five percent from the high two months ago which was the second highest ever. Similarly, short interest on the Nasdaq is down six percent from the end-September high but two months ago had risen to the highest since mid-September 2008.
These shorts were rewarded handsomely this week.
Non-commercials continue to cut back net shorts – now sub-100,000 contracts for three weeks; that said, this was before Friday’s carnage.
Support at 1990 is a must-hold.
Currently net short 80.8k, down 15.5k.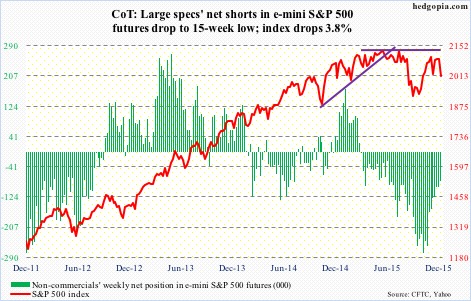
Euro: The currency continued to add this week to last week’s 2.9-percent gains. It has now rallied four-plus percent in seven sessions, and is overbought on a daily chart.
Twice this week, it was repelled by its 200-day moving average. The 50-day moving average is right below. Both averages are still pointing down.
Depending on what the Fed pulls out of the hat next week, there is room for unwinding of the near-term overbought conditions the euro is in.
Non-commercials slightly cut back, but continue to remain heavily net short.
Currently net short 172.3k, down 10.5k.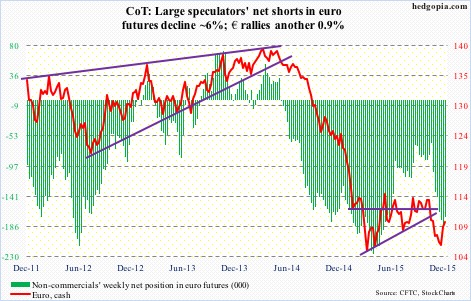
Gold: Near term, the yellow metal’s fate probably lies in what comes out of the FOMC next week.
If the Fed signals this hike is the last one for some time to come, gold has room to rally. It is oversold, particularly on a weekly basis.
The odds are very low, but if the Fed disappoints as it did in September – by not raising – there is room for short squeeze.
In November, short interest on GLD, the iShares Gold ETF, rose from 8.7 million shares to 13.1 million shares.
Plus, last week, non-commercials had the least net longs since October 2002. This week, they added some.
Currently net long 19.6k, up 9.9k.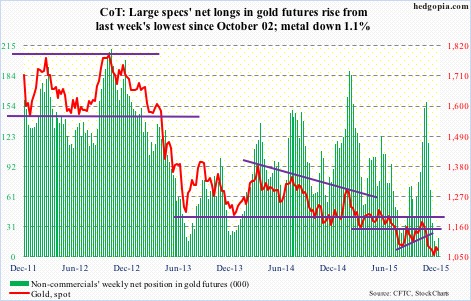
Nasdaq 100 index (mini): With the 3.8-percent drop this week, the Nasdaq 100 has now slightly breached 4560 support, which also approximates the 50-day moving average (4572). The 200-day moving average lies at 4461, and likely gets tested.
In the past month, non-commercials have cut back net longs by 34 percent.
Currently net long 54k, down 2.8k.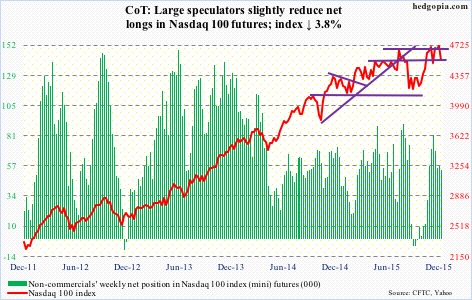
Russell 2000 mini-index: Along with small-caps, high-yield bonds help investors/traders take a pulse of risk-on/risk-off.
In this respect, high-yield bond ETFs are getting sold off hard. Trading volume has picked up. One wonders if institutional money is taking advantage of the drop in JNK, the SPDR High Yield Bond ETF, and HYG, the iShares High Yield Bond ETF. Or, maybe not.
The bigger question is, is the high-yield malaise just related to energy or spreading to other sectors/industries?
Fitch Ratings predicts that the energy sector’s default rate will surge to 11 percent in 2016, and that the U.S. high-yield default rate will rise to 4.5 percent. Taking out energy and metals/mining, however, the high-yield default rate drops to a manageable 1.5 percent.
The probable root cause? The business cycle is maturing and corporate costs are rising. This is reflected in how small-caps are trading, down a whopping 5.1 percent in the week.
For weeks/months, it has paid to listen to non-commercials, who have doggedly remained bearish, and to sell upside calls on IWM, the iShares Russell 2000 ETF.
Currently net short 32.5k, down 607.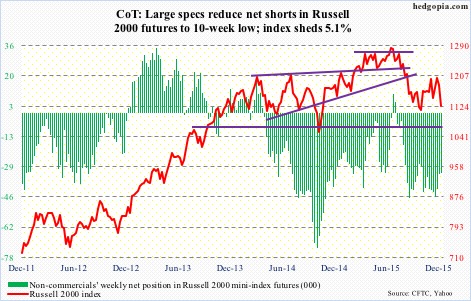
US Dollar Index: After the IMF’s SDR decision last week, China has guided its yuan fix lower. November exports fell 6.8 percent, down for five straight months.
While China may not want to lose control of the situation, further depreciation can risk competitive devaluation by other central banks.
The ECB just last week lowered its discount rate, and extended its existing QE program. Japan is in the midst of its QE.
Amidst all this comes a rather hawkish message from the Fed.
The dollar index, having rallied into this, and overbought both near- and medium-term, has come under pressure. The massive December 3rd sell-off has potential to be an important inflection point.
Currently net long 51k, up 3.7k.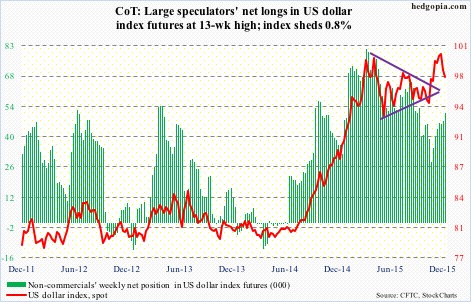
VIX: Having surged 9.58 points for the week, spot VIX took care of multiple resistance levels – 50- and 200-day moving averages as well horizontal resistance at 16 and 21-22.
It is beginning to look overbought on a daily basis, but the thing to watch for is a spike-reversal, in which it spikes but only to reverse hard. That is the time to go long equities.
As well, the VIX to VXV ratio spiked to unity on Friday. Several times in the past, the ratio has peaked around this level, which tends to help stocks. That said, it is yet to peak and head lower.
Currently net short 10.2k, down 11.6k.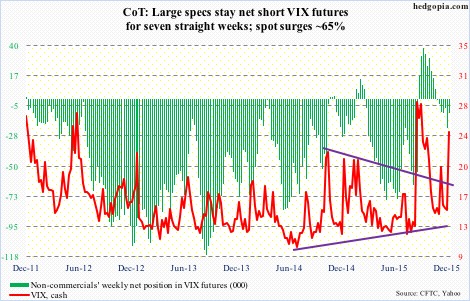
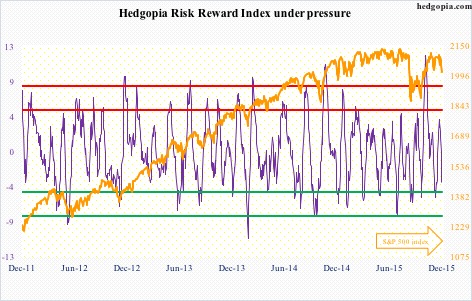
Hedgopia Risk Reward Index