The following are futures positions of non-commercials as of January 5, 2016. Change is week-over-week.
10-year note: The World Bank, warning of an increase in risks to the global economy, expects growth this year to come in at 2.9 percent, versus 2.4 percent last year. In June, it expected growth of 3.3 percent this year. The bank admits its forecasts are subject to substantial downside risks. A couple of thoughts on this.
First, even if this year’s projection is realized, this is very anemic growth. Second, at least in the current cycle it is customary for outfits like the World Bank and the IMF to sound optimistic as the year begins. Then, as the year progresses, they bring out the knife and lower forecasts… which is how 2015 unfolded.
This has also been true with the Fed. Throughout the cycle, its initial forecasts – as relates to the economy and inflation in particular – have acutely fallen short of. Once again, it expects inflation to pick up speed this year. Hence the FOMC dot plot’s expectation of four quarter-point hikes this year. This will have come in addition to the quarter-point hike in the middle of December.
It is tough to say if the Fed genuinely believes the U.S. economy is accelerating – hence the need to tighten – or just wants to fill its empty conventional monetary tool box with arrows. As stated earlier, it has been misreading the economic tea leaves any way. Either way, markets are not buying the four-hike-this-year scenario, and odds favor they will be proven right.
The decision to hike in the December 15-16 meeting was unanimous. However, the minutes this week showed some members expressed concern about low inflation.
Currently net long 18.3k, down 24.7k.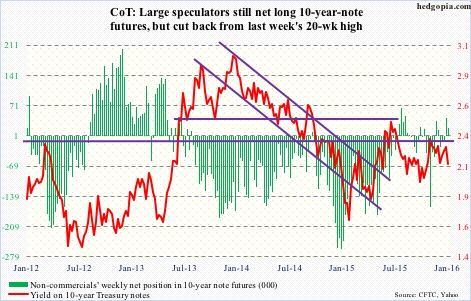
30-year bond: Major economic releases next week are as follows.
Tuesday comes out the NFIB small business optimism index for December. November was 94.8, down 1.3 points month-over-month. Of late, members’ capX and comp plans have diverged. The former read 25 in November, versus 29 in December 2014, which was a seven-year high. The latter on the other hand shot up to 20 in November, matching the November 2006 reading.
Also on Tuesday, we get November’s JOLTS report. In October, job openings dropped 151,000, to 5.38 million. This is a very healthy number, nonetheless down from the all-time high 5.67 million in July last year.
Friday is jam-packed, with producer price index-final demand (December), retail sales (December). industrial production (December), and the University of Michigan’s consumer sentiment (January, preliminary).
Producer prices were up 0.3 percent in November, after falling 0.4 percent in October. In the 12 months through November, PPI dropped 1.1 percent after after declining 1.6 percent in October. Core PPI was up 0.1 percent and 0.3 percent, respectively.
Industrial production peaked at 107.9 in December last year, with November 1.3 percent lower at 106.5. In the meantime, capacity utilization peaked at 79 percent in November 2014, and has been dropping since; November was just south of 77 percent. Utilization has dropped year-over-year for seven straight months.
Retail sales lack momentum. Most recently, year-over-year growth peaked at 4.9 percent in August 2014. By November last year, this had decelerated to 1.5 percent, to a seasonally adjusted annual rate of $448.1 billion.
The University of Michigan’s consumer sentiment increased 1.3 points to 92.6. The cycle high of 98.1 was reached in January last year – the highest reading since 103.8 in January 2004.
Seven FOMC members are on tap to speak during weekdays.
Currently net short 8.2k, up 8.2k.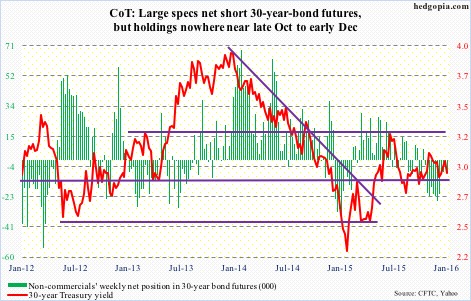
Crude oil: There is no respite in Saudi Arabia-Iran tensions. On Tuesday, the former cut the prices it charges for crude oil in Europe. After the European Union banned oil imports from Iran in 2012 because of that nation’s nuclear program, the vacuum was filled by Saudi Arabia and others. Now that Iran will soon be exporting oil, the Saudi move seems to be a preemptive move to hurt Iran.
In the meantime, there were more signs of slowdown in China. Oil demand rose 1.5 percent year-over-year to an average 10.95 million barrels per day in November – the slowest growth since February 2015. As if rubbing salt to the wound, the World Bank expects China to grow at 6.7 percent this year, down from 6.9 percent in 2015.
Here at home, the EIA report for the week of January 1st brought more negatives than positives.
First the good news. Crude stocks dropped 5.1 million barrels, to 482.3 million barrels. Three weeks ago, stocks were 490.7 million barrels, which was just a stone’s throw away from the all-time high 490.9 million barrels in the April 24th week.
On the other hand, crude production rose 17,000 barrels per day, to 9.22 mbpd – a 19-week high. Production peaked at 9.61 mbpd in the June 5th week.
Refinery utilization fell by one-tenth of a percent, to 92.5 percent. Utilization peaked at 96.1 percent in the August 7th week.
Gasoline stocks rose by 10.6 million barrels, to 232 million barrels – the highest since the March 20, 2015 week. This was the eighth straight weekly increase.
Distillate stocks rose by 6.3 million barrels, to 159.4 million barrels – the highest since the February 18, 2011 week.
The week saw the spot West Texas Intermediate crude make an intra-day low of $32.10/barrel, matching the low of December 2003. Whoa! Monday through Thursday, between the intra-day high and low, it lost 16 percent in four sessions.
Yes, it is plagued by oversupply, but what is the message oil is trying to send about the global economy? Is the World Bank too optimistic?
Non-commercials continue to reduce net longs, with holdings at the lowest since December 2012.
Currently net long 196.3k, down 11.2k.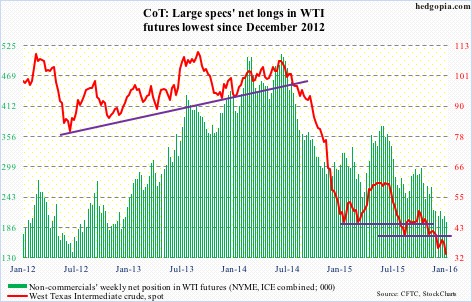
E-mini S&P 500: Flows continued their recent downward trend. In the week ended Wednesday, $12 billion flew out of U.S.-based equity funds (courtesy of Lipper). This more than offset last week’s $10-billion inflows. In the past five weeks, north of $32 billion have been withdrawn.
No wonder December was a down month. Going back to the September 30th, when the S&P 500 was in the process of bottoming, nearly $21 billion have come out of these funds. Not surprisingly, the index is not that far away from those lows.
With the rout this week, there has been technical damage wrought on the index. It fell out of a two-plus-month descending channel as well as lost 1990. The sooner it regains that level, the better. In a worse-case scenario, August and September lows could be in play. Alternatively, it drops to 1900 and finds support at the trend line drawn from the August low.
On a weekly basis, there is room for the index to continue lower, even as daily momentum indicators are in/approaching oversold territory. Near-term, a reprieve is possible. Medium- to long-term, the index can head a lot lower.
Non-commercials added a little to net shorts, but holdings are substantially less than during September/October last year.
Currently net short 104.2k, up 7k.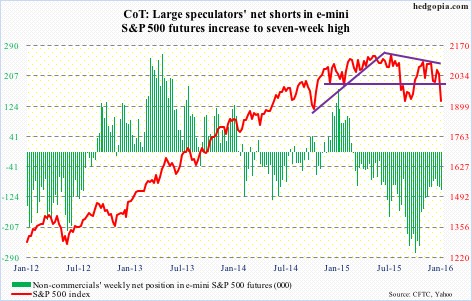
Euro: Eurozone inflation remained unchanged in December at 0.2 percent year-on-year, less than consensus expectations of a 0.3-percent rise. Core inflation rose 0.8 percent, versus 0.9 percent expected.
Inflation continues to come in weak, even as the ECB is doing all it can to push it toward its two-percent goal. Last month, the central bank extended its stimulus program by six months to March 2017, as well as changed the range of assets eligible for purchase.
Besides progress on inflation, the ECB would also like a weaker euro. And there likely is a new twist in the mix.
Back in August, China abruptly devalued its currency by two percent. Last month, the yuan was included in the IMF’s reserve currency basket. With this out of the way, the People’s Bank of China is letting the bottom fall out of the yuan – so to speak. This has the potential to force competitive devaluation from peers, particularly Asian counterparts. And the ECB, of course.
Non-commercials’ holdings have gone sideways the past four weeks, but continue to lean heavily bearish.
Currently net short 160.6k, up 93.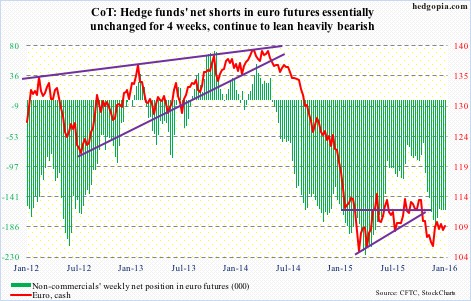
Gold: The metal is attracting some bids, probably thanks to the recent market mayhem… and technicals.
Support at $1,080/ounce was lost in the middle of November, with spot gold moving sideways since.
The rally this week not only helped the metal recapture the afore-mentioned price point but also complete a 10/20 crossover (daily average). Gold bugs have been able to use this near-term momentum to their advantage. The metal is above its 50-day moving average, and weekly momentum indicators are swinging higher.
After having substantially cut back net longs since particularly October last year, non-commercials are yet to aggressively accumulate, but have been adding of late.
Currently net long 26.6k, up 7.5k.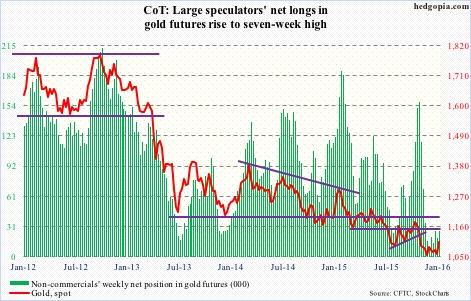
Nasdaq 100 index (mini): Last week, the Nasdaq 100 lost 4560, which has proven to be an important line in the sand between bulls and bears. This week, it lost the 200-day moving average.
Importantly, Apple (AAPL), which makes up nearly 13 percent of the index, lost crucial support at $105-plus, completing a head-and-shoulders pattern.
More importantly, the Nasdaq 100 rallied a very strong 8.4 percent – relatively speaking – last year. But this was driven primarily by the likes of Facebook (FB), Amazon (AMZN), Netflix (NFLX) and Alphabet (GOOGL, formerly Google). Otherwise, breadth was much weaker.
Non-commercials reduced net longs to an 11-week low – timely.
Currently net long 36k, down 25k.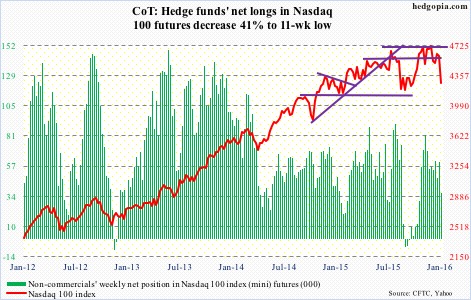
Russell 2000 mini-index: Back in late September when the S&P 500 successfully tested the August low, the Russell 2000 index, along with the S&P 400 mid-cap index, was one of the major U.S. indices to have undercut those lows.
Investors/traders were avoiding small-caps then, and they are avoiding them now. This week, the Russell 2000 undercut the September low as well.
And once again, kudos to non-commercials for having so doggedly remained bearish Russell 2000 futures. They have been rewarded.
Net shorts are at the highest since October 2014.
Currently net short 50.4k, up 852.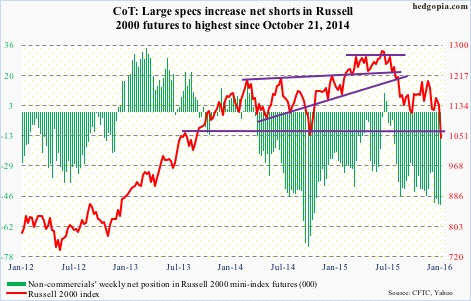
US Dollar Index: Rather uncharacteristically, the dollar index failed to rally on the coattails of this week’s market turmoil.
Yes, the Japanese yen is the pre-eminent risk-averse currency and yes the euro has become a safe-haven proxy along with the yen, but the index’s inability to break out is probably one more sign of waning momentum.
Judging by their holdings, non-commercials have been hinting at this for a while now. Two weeks ago, they cut back net longs to a nine-week low. This week, they added some.
A peak in the dollar is music to the ears of U.S. exporters.
Currently net long 40.7k, up 7.1k.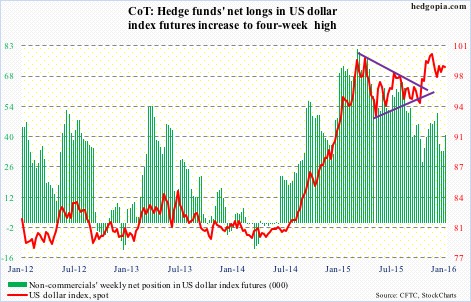
VIX: On December 14th, spot VIX shot up to 26.81 before reversing hard. The S&P 500 this week undercut the intra-day low in that session by 3.8 percent, yet VIX could barely surpass the intra-day high back then.
Also, the S&P 500 is less than three percent from testing the August low, yet VIX has to nearly double to reach the intra-day high back then.
It is so uncharacteristic of VIX – not able to rally when the S&P 500 is taking it on the chin.
Investors/traders were either already protected or do not anticipate a bigger decline in stocks. That is one way to look at this. Using this logic, the time is perhaps right to look for signs of a spike-reversal. Not there yet.
The VIX:VXV ratio is now overbought – 1.03 – ripe enough to begin to unwind, which, should it happen, should bode well for stocks. But it needs to begin to drop.
Currently net short 9.8k, up 1.4k.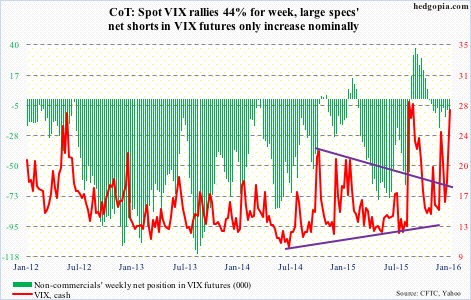
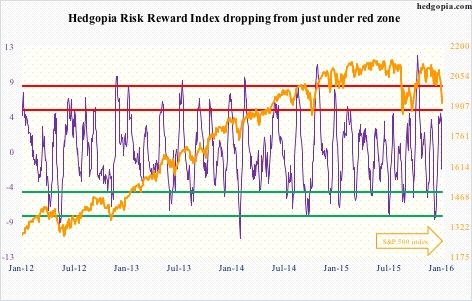
Hedgopia Risk Reward Index