The following are futures positions of non-commercials as of February 2, 2016. Change is week-over-week.
10-year note: There you go! Again.
Less than three months after instituting the first rate hike in nine years, Fed officials are behaving as if they are regretting the decision.
This week, we heard from two important members – Stanley Fischer, vice-chair, and William Dudley, president of the New York Fed.
The former was speaking on Monday and the latter on Wednesday.
Mr. Fischer all but said policy makers have no clue what to do next.
For reference, the FOMC’s mid-December dot plot projected four quarter-point hikes this year, which was very aggressive to begin with. Markets never agreed with this scenario. Stocks globally started out 2016 all panicky.
Mr. Fischer says it is too difficult to gauge the impact on the U.S. economy from recent turmoil in financial markets and uncertainty over China.
Mr. Dudley voiced similar concerns, saying financial conditions had tightened considerably since the hike and that policymakers would have to take that into consideration should that persist.
Translation: Markets will have to behave for the Fed to continue to tighten. Fully aware that the latter has painted itself into a corner, the former knows when to thrown a tantrum, and will continue to do so as long as this works.
Currently net long 5.9k, down 38.7k.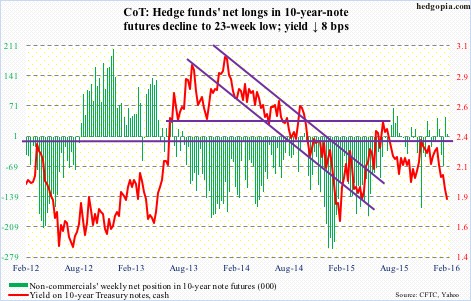
30-year bond: Major economic releases next week are as follows. It is a relatively light week.
On Tuesday, the NFIB survey of small business economic trends comes out for January. The optimism index was up four-tenths of a percent in December sequentially to 95.2. The index recently peaked at 100.4 in December 2014 – the highest since October 2006. Comp plans in particular have been perking up of late, with December’s 20 matching the high in November 2006 – probably a false positive.
Also on Tuesday, we get JOLTS for December. Job openings were 5.4 million in November, up 82,000 over October. The all-time high was recorded in July last year at 5.7 million. November quits were a record 2.8 million – shows a high level of conviction among employees. Not sure if this is the right read into this.
Retail sales for January are on tap on Friday. This is one of the several data series lacking in momentum. December was up 2.2 percent year-over-year to a seasonally adjusted annual rate of $448.1 billion; as early as August 2014, sales were growing at 4.9 percent.
Also on Friday, the University of Michigan’s consumer sentiment reading for February (preliminary) is published. January fell six-tenths of a percent month-over-month to 92. They cycle high of 98.1 was reached in January last year, which was an 11-year high.
Three Fed officials are on schedule to publicly speak during weekdays. Chair Janet Yellen speaks twice, on Wednesday and Thursday (both begin at 10AM).
Currently net long 11.3k, up 6.9k.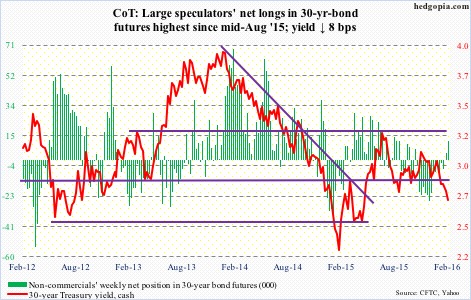
Crude oil: After having ignored what would otherwise be a bearish inventory report in the prior two weeks, spot West Texas Intermediate crude this week succumbed to bad fundamentals. The spot lost 8.1 percent.
For the week ended January 29th, U.S. crude stocks jumped 7.8 million barrels, to a record 502.7 mb. This was preceded by an 8.4-mb build in the prior week and a four-mb build in the week before that. All in all, stocks have gone up by 20.2 mb in three weeks!
In the prior two weeks, between intra-day high and low, the WTI rallied 26 percent.
In normal circumstances, markets able to comfortably digest bad news should be viewed as bullish. Particularly so considering the persistent, months-long decline oil has suffered.
That said, oil’s rally coincided with persistent rumors surrounding talks of production cutbacks. Hard to decipher what was behind the rally: selling exhaustion (positive) or rumors (negative if they do not turn into reality).
Besides aggressive crude inventory build, most other items in this week’s EIA report were negative as well.
Gasoline stocks increased by 5.9 mb, to 254.4 mb. This was the 12th straight weekly increase – a fresh record (data goes back to 1990).
Crude imports rose by 647,000 barrels per day, to 8.26 mbpd – a seven-week high.
Refinery utilization fell by eight-tenths of a percent, to 86.6 – a 15-week low. Utilization peaked at 96.1 percent in the August 7th week.
In the meantime, crude production dropped by 7,000 bpd, to 9.21 mbpd – a five-week low. Production peaked at 9.61 mbpd in the June 5th week.
And distillate stocks declined by 777,000 barrels, to 159.7 mb. Three weeks ago, stocks (165.6 mb) were the highest since the January 21, 2011 week.
At least near-term, the line in the sand on spot WTI continues to be $34.50-$35, which already repelled a rally attempt last week.
Currently net long 191.6k, down 19.4k.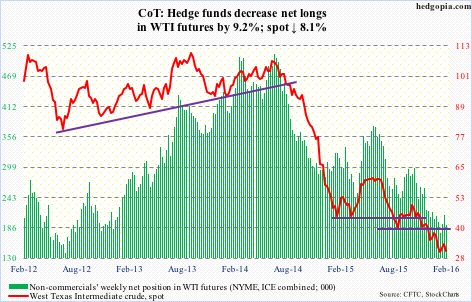
E-mini S&P 500: Heard someone on TV the other day citing 2017 earnings estimates to argue valuation support for stocks. Really? 2017? Not 2016? The year has barely started, and if one has to go all the way out to 2017, there has got to be a reason. There is.
Operating earnings estimates for 2017 started out at $141.11 three weeks ago and as of January 29th stood at $140.31. Based on these earnings, the S&P 500 trades at less than 13.5x – not terribly cheap but not very expensive either. Try to value it using 2016 estimates of $121.87, and the multiple jumps to just under 15.5x.
Even more important, how reliable are these estimates? Not very. In February last year, 2016 was expected to come in at $137.50, which has so far been slashed by more than 11 percent. Similarly, from peak estimates to the present, 2015 has been cut by more than 23 percent.
Unlike in the past, the public has easy access to these numbers, and they are probably beginning to take notice of earnings deceleration.
Money continues to leave stocks. In the week ended Wednesday, another $6.5 billion left U.S.-based equity funds (courtesy of Lipper). In the past five weeks – since 2016 started – $33.9 billion has been withdrawn, and $42.5 billion since September 30th last year.
Separately, as of Thursday, $2 billion came out of SPY, the SPDR S&P 500 ETF (courtesy of ETF.com).
Year-to-date, the S&P 500 is down eight percent, but it also rallied 7.4 percent off of the January 20th low before coming under pressure. Daily momentum indicators are overbought. That low likely is in play.
Non-commercials aggressively added to net shorts.
Currently net short 225.9k, up 94k.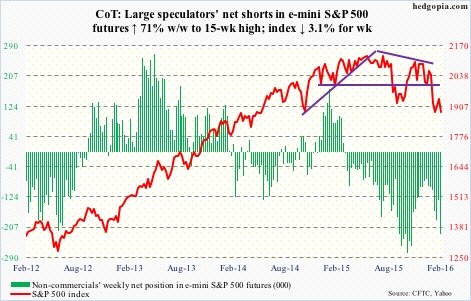
Euro: Surged 1.6 percent on Wednesday, past its 200-day moving average. This was the largest single-session move since December 3rd last year. Back then, the currency rallied 3.1 percent; markets decided that Mario Draghi, ECB president, was not dovish enough, and that he failed to live up to expectations.
On Thursday, Mr. Draghi said that the risk of acting too late on ultra low inflation was greater than that of acting too early as a wait-and-see stance could lead to a lasting loss of confidence. The euro rallied one percent anyway. Markets either decided he was merely jawboning or just traded on technicals. The Thursday rally essentially took care of the one-percent loss last Friday post-Bank of Japan surprise decision to deploy negative interest rates.
By Thursday, the euro was sitting right underneath resistance, which it tried to break out of on Friday, but reversed hard. The daily chart is now in need of unwinding tons of overbought conditions.
Non-commercials’ net shorts are now down to a 15-week low.
Currently net short 87.1k, down 40.1k.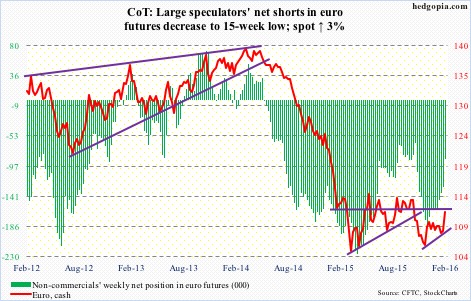
Gold: Owing to lesser odds of the Fed continuing to tighten, a weaker dollar, flight-to-safety, retail-buying ahead of the Chinese New Year, or just pure technicals, or something else, gold’s price action has improved immensely.
Coming into the week, the yellow metal already had back-to-back up weeks. This week, it rallied another five percent. Momentum had been gradually building, especially since it bounced off of the rising 50-day moving average in the middle of last month.
The 1,140 resistance has been taken care of, and on a weekly chart, there is room to go up still, although it closed the week right underneath resistance at 1,180. A breakout here would be major. That said, daily conditions are overstretched.
In the week ended Thursday, $889 million moved into GLD, the SPDR Gold ETF (courtesy of ETF.com).
Non-commercials have been adding to net longs as well, with holdings at a 13-week high.
Currently net long 72.8k, up 13.8k.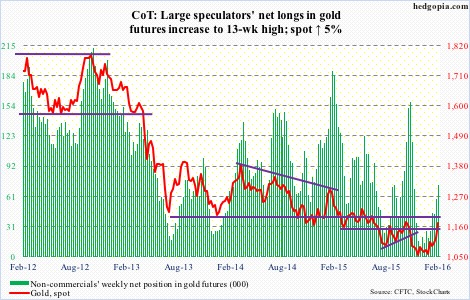
Nasdaq 100 index (mini): Down six percent for the week, the Nasdaq 100 continues to underperform its major U.S. peers. Here is the problem: It is a market-cap-weighted index.
The top five weights in QQQ, the Nasdaq 100 ETF, are: Apple (AAPL), 11.4 percent; Alphabet (GOOGL, formerly Google), 9.2 percent (both A and C); Microsoft (MSFT), 8.5 percent; Amazon (AMZN), 5.8 percent; and Facebook (FB), 4.5 percent.
Last year, the ETF rallied 9.4 percent, better than its U.S. peers. AAPL was a dud, down three percent, but the rest more than made up for this. AMZN surged 117.8 percent, GOOGL 46.6 percent, FB 34.2 percent, and MSFT 22.7 percent.
So far this year, QQQ is down 12.3 percent, with contribution from all top fives. AAPL is down 10.2 percent, GOOGL 9.5 percent, MSFT 9.6 percent, AMZN 25.7 percent, and FB 0.6 percent.
And there are signs of exhaustion.
QQQ had red candles in December and January, and so far this month. This followed a monthly doji in November. Similarly, AMZN, which more than doubled last year, had a monthly doji in December, followed by a down January and a down February. Now a laggard, AAPL struggled in the $130 area from February to July last year, before giving way in August.
Similarly, after breaking out of a three-month horizontal resistance at $108 last week, FB on Tuesday produced a long-legged doji right outside the upper Bollinger Band. Also on Tuesday, in a high-volume, post-earnings session, GOOGL produced a shooting star, preceded by a doji on Monday.
Non-commercials continue to reduce net longs.
Currently net long 21.7k, down 8.5k.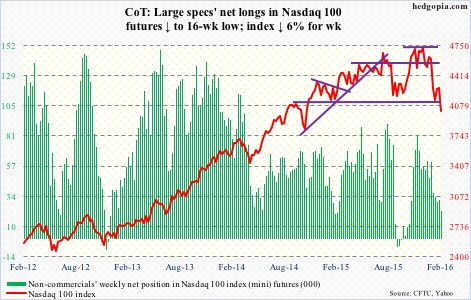
Russell 2000 mini-index: In the week ended Thursday, $702 million came out of IWM, the iShares Russell 2000 ETF (courtesy of ETF.com).
The index acts weak. A retest of the January 20th low (958) looks imminent.
Currently net short 61.9k, up 13.1k.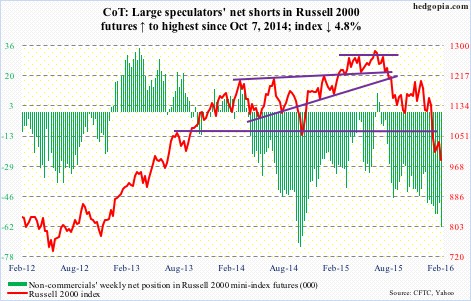
US Dollar Index: Collapsed 1.6 percent on Wednesday. Was it reacting to January’s ISM non-manufacturing PMI, which dropped 2.3 points to 53.5 – the lowest since February 2014? Possibly.
That said, unlike U.S. manufacturing, non-manufacturing is still in expansion. Manufacturing has languished sub-50 the past four months.
Or was it reacting to the 10-year yield that swooned to 1.79 percent intra-day Wednesday before ending up two basis points to 1.88 percent? (Incidentally, with a shooting star on Wednesday, TLT, the iShares 20+ Year Treasury Bond Fund, looks like a short near-term.)
Rate-hike odds are fading… fast. The dollar index had hugged the 50-day moving average for nearly two months. Once it lost that, the reaction has been violent.
The question is, is it a double-top? The 93-plus is yet to be breached. The daily chart is oversold, with encouraging action on Friday. It now faces resistance in the 98 range.
One thing is crystal clear. Non-commercials do not wax enthusiastic over the dollar’s prospects.
Currently net long 44.9k, up 647.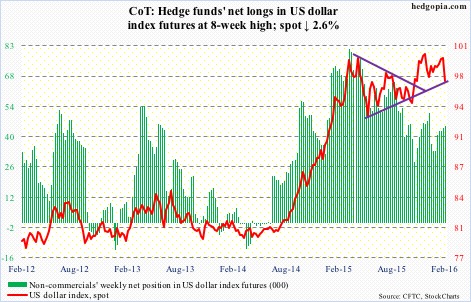
VIX: On Monday, volatility bulls stepped up to support the 50-day moving average, which is now slightly rising. Ditto with the 200-day.
Near-term, there is room to unwind daily oversold conditions.
Currently net long 22.5k, up 8.3k.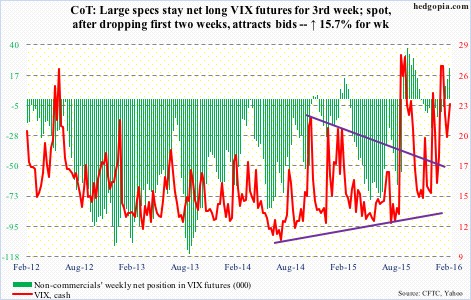
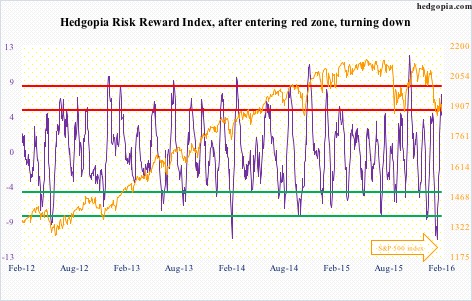
Hedgopia Risk Reward Index