The following are futures positions of non-commercials as of April 12, 2016. Change is week-over-week.
10-year note: Glass half full or half empty?
Yet again, the IMF issued a downward revision to its prediction for global GDP growth, cutting 2016 forecast to 3.2 percent from forecast of 3.4 percent in January. This comes on the heels of a similar reduction in its projection in July and October last year.
The U.S.’s was reduced from 2.6 percent to 2.4 percent, matching 2.4 percent (actual) in 2015. The Street, however, is at 2.1 percent this year. Looking at how things are shaping up, the IMF may still have to reduce its forecast in the months to come.
As of April 13th, the Atlanta Fed’s GDPNow model is forecasting real GDP growth of 0.3 percent in the first quarter. TheStreet is at 1.3 percent. With the 10-year yield persistently under two percent, the bond market probably agrees with GDPNow.
This is a glass half empty scenario.
Here is glass half full.
In a rather surprise move, the IMF slightly nudged higher China’s growth this year from 6.3 percent to 6.5 percent. Of the major economies, China is the only one to see upward revision.
Back in January, one primary reason behind global equity sell-off was investor fears over yuan devaluation and hard-landing in China. The IMF is essentially saying the economy will do just fine.
Currently net short 24.4k, down 92.9k.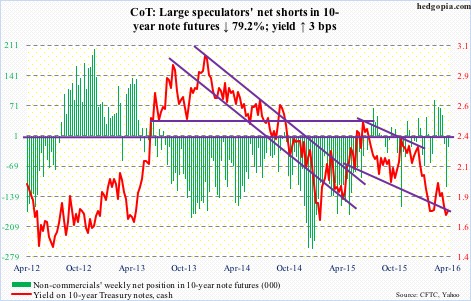
30-year bond: Major economic releases next week are as follows.
On Monday, April’s NAHB/Wells Fargo housing market index comes out. March was unchanged at 58. The cycle peaked at 65 in October last year, which was at a 10-year high.
Housing starts for March are published on Tuesday. February was up 5.2 percent month-over-month to a seasonally adjusted annual rate of 1.18 million units. This was the 11th consecutive month of one-plus million units, with the 12-month rolling average of 1.13 million – the highest since June 2008.
On Wednesday, March’s existing home sales are printed. February was down 7.1 percent m/m to 5.08 million (SAAR). The cycle peaked at 5.48 million last July, which was the highest since 5.79 million in February 2007.
Three FOMC members are scheduled to speak during weekdays.
Currently net long 55.9k, up 2.1k.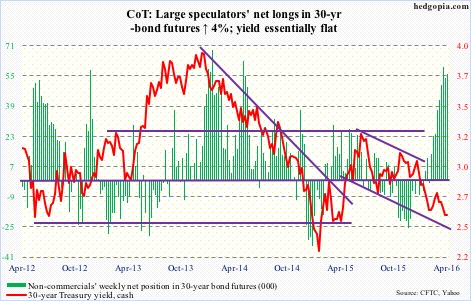
Crude oil: Will Sunday’s Doha talks live up to expectations? Likely not. An agreement that solidifies on earlier output-cut proposals probably ends up raising risks that a lot of shale oil that was at risk of being cut – a Saudi goal all along – would be profitable again. The glut remains in this scenario.
In the meantime, the International Energy Agency says global oil demand will grow by around 1.2 million barrels per day this year, below 2015’s 1.8 mb/d.
For the week ended last Friday, U.S. crude stocks rose by 6.6 million barrels to 536.5 million barrels – the highest since the all-time high of 545 million barrels in 1929. In the past 14 weeks, stocks have gone up by 54.2 million barrels!
Crude imports, too, rose, but by only 686,000 b/d to 7.94 mb/d – a three-week high.
Refinery utilization fell 2.2 percentage points to 89.2.
The good news came in the way of crude production and gasoline stocks. The former fell by 31,000 b/d to 8.98 mb/d. This was the first time production fell below nine mb/d since October 2014.
Gasoline stocks dropped 4.2 million barrels to 239.8 million barrels. Stocks have fallen by 18.9 million barrels in the past eight weeks. Distillate stocks, however, rose by 505,000 barrels to 163.5 million barrels.
Spot West Texas Intermediate crude rallied strongly after crucial support at $34.50-$35 held on April 5th. Subsequently, it ran past its 200-day moving average, and has retreated since Tuesday after hitting the upper Bollinger Band.
Conditions are grossly overbought. Should there be a post-Doha rally on Monday, that likely gets sold.
Currently net long 293.6k, up 257.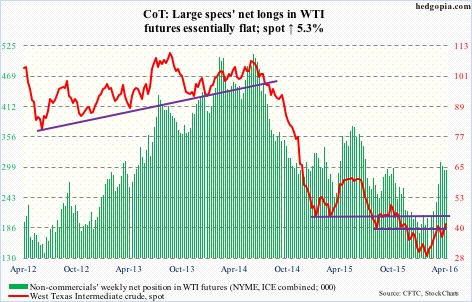
E-mini S&P 500: We are in the midst of earnings, and buybacks are missing in action. Flows continue to disappoint.
In the week ended Wednesday, $4.8 billion came out of U.S.-based equity funds (courtesy of Lipper). Since February 10th, $12.1 billion has been withdrawn; stocks bottomed on the 11th.
The S&P 500 has gone on to rally 15 percent since that low.
Inflows into SPY, the SPDR S&P 500 ETF, have helped. Since February 11th, just shy of $2 billion has moved into the ETF, with the week ended Wednesday pulling in $1.3 billion (courtesy of ETF.com). This was preceded by $1 billion in inflows in the prior week.
Should equity bulls rejoice this latest inflows? Without a doubt, particularly if Lipper data follows suit.
Short interest remains high on an index level – both the NYSE composite and Nasdaq composite. Although SPY shorts have already been taken to the cleaners. In the middle of September last year, short interest on the ETF was 436.7 million shares. By the end of March, this had dropped to 254.1 million – a one-year low.
Bulls should also take heart from the fact that 2040 support has been defended. Last week, this was tested in four out of five sessions, followed by two more sessions this week.
Daily conditions are insanely overbought, but that has not mattered much – yet.
Currently net short 89.5k, down 14.7k.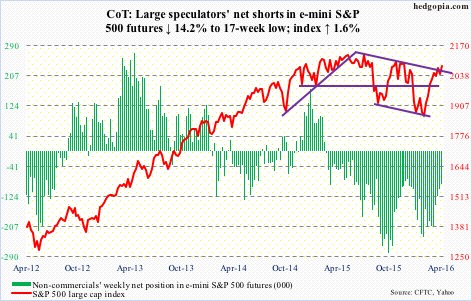
Euro: Eurozone inflation in the year to March has been revised up to flat from the initial estimate of a 0.1-percent drop and February’s 0.2-percent annual decline.
This is not even remotely close to the European Central Bank’s target of just below two percent. And it is just one month’s data. Nonetheless, it is probably a small morale booster for policymakers that are leaving no stone unturned to get the inflation dial moving.
On March 10th, the ECB announced uber-dovish stimulus measures, including purchases of corporate bonds. The move was supposed to weaken the euro, which instead ended up rallying. From 108.22 intra-day on March 10th, it rallied to 114.475 this Monday, retreating since.
Resistance at 114-114.50 goes back to January last year. A breakout here would be massive, but that was not to be – at least not this time.
Daily overbought conditions are currently unwinding. The 50- and 200-day moving averages lie at 111.83 and 110.58, respectively.
Currently net short 52.1k, down 1.4k.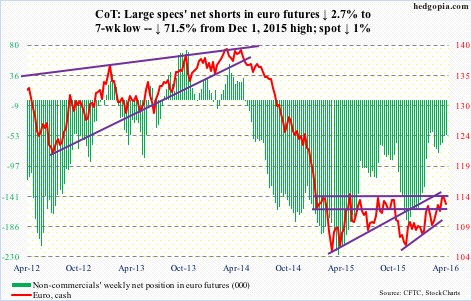
Gold: Last week, gold bugs fought off a bearish descending triangle pattern on spot gold, but were unable to build on it this week.
The metal peaked at 1287.8 on March 11th, and has essentially gone sideways since a month prior to that.
On a weekly chart – overbought – gold has tons of unwinding left. That process has begun on a daily chart. And flows are not cooperating. In the week ended Wednesday, GLD, the SPDR gold ETF, lost $381 million (courtesy of Lipper).
The lower end of the two-month range lies at 1200-plus, with the lower Bollinger Band at 1210. If and when these levels are tested, gold would have already lost its 50-day moving average (1231).
Underneath, there is six-plus year support at 1180 – a must-hold.
Importantly, non-commercials’ net longs jumped 12 percent to the highest since August 2011. At least going back to 2012, these are levels that have marked major peaks – in both net longs and spot gold.
Currently net long 213.8k, up 23.4k.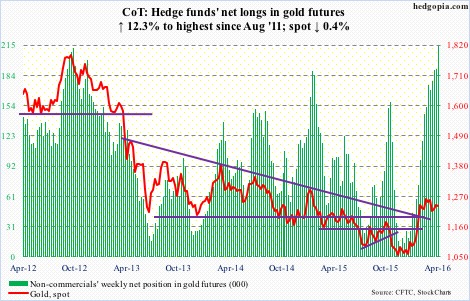
Nasdaq 100 index (mini): In the week ended last Wednesday, $307 million came out of QQQ, the PowerShares Nasdaq 1000 ETF. This week, it attracted $7.2 million, with a whopping $688 million on Wednesday. The index rallied 1.3 percent in that session, following a 0.8-percent rise on Tuesday.
Regardless how overbought conditions are, the index has continued to attract bids at/near support. Last week’s daily bearish MACD crossover is on the verge of being negated.
That said, Thursday produced a doji right under the upper Bollinger Band.
Currently net long 38.1k, up 8.8k.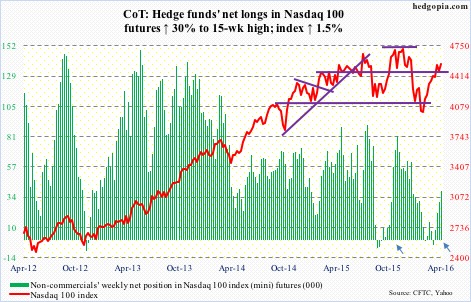
Russell 2000 mini-index: By Thursday, the Russell 2000 was up 2.9 percent for the week, and had just tagged its 200-day moving average as well as the upper Bollinger Band. The session produced a doji.
The Thursday as well as Friday highs also kissed a declining trend line from last June. A breakout here would be major development, and would be quite a feat given the amount of flows out of IWM, the iShares Russell 2000 ETF.
In the week ended Wednesday, $136 million was withdrawn from the ETF (courtesy of Lipper). Last week, $890 million left.
Non-commercials continue to stay put with their bearish bias even though they have been wrong since February 11th.
Currently net short 66.9k, up 3.5k.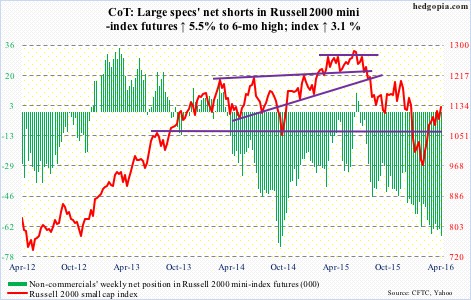
US Dollar Index: Prior to Wednesday’s 0.9-percent jump, the US dollar index produced several doji sessions. A sign of fatigue – fatigue of going down.
Then on Tuesday, Japan’s finance minister warned against excessive yen strength – perhaps more fodder for strength in the dollar index.
On a daily basis, it just had a bullish MACD crossover.
Overhead resistance is strong – particularly around 97, which is where the 200-day moving average lies as well (97.05). The 50-day moving average (96.09) continues to drop.
The next thing to watch is if and when non-commercials begin to add to net longs. Has not happened yet. Latest holdings were at a 10-month low.
Currently net long 13.8k, down 3.5k.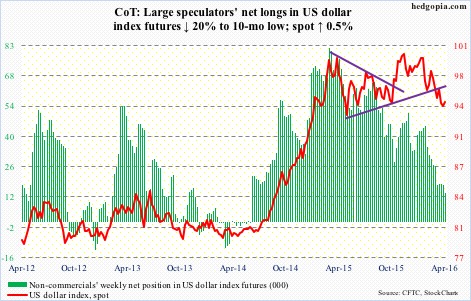
VIX: After it was rejected by the upper Bollinger Band on Tuesday, spot VIX went on to lose north of three points in three sessions, closing below 14 on Wednesday through Friday. The bands are narrowing. A sharp move is probably round the corner. Given VIX is in the low teens and remains oversold, the probable path of least resistance is up.
The VIX-to-VXV ratio once again dipped below 0.8. Four weeks ago, the ratio dropped to 0.782 – a one-year low. This, too, is signaling an impending move higher in spot VIX.
Currently net short 40.3k, up 6k.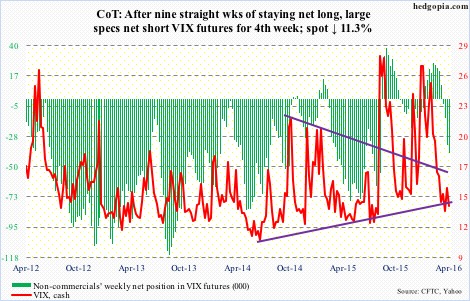
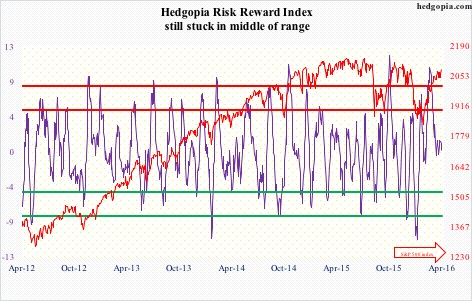
Hedgopia Risk Reward Index