
Following futures positions of non-commercials are as of May 28, 2019.
10-year note: Currently net short 376.2k, down 47.2k.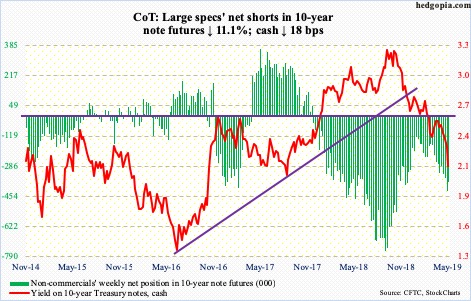
Where is the bottom?
The 10-year Treasury yield (2.14 percent) last Thursday sliced through support at 2.36 percent. This week, it built on that mini-breakdown, with yields down 18 basis points. A major breakdown occurred mid-March this year when 2.62 percent, which goes back a decade, gave way.
For now, the September 2017 low of two percent is the most relevant reference point, although yields do not have to – and may not – get there in a straight line. Since the 10-year peaked at 3.25 percent last October, it has persistently made lower highs and lower lows. This week’s low is yet another in this respect. For this pattern to remain intact, yields can rally anytime, yet can retreat before making a higher high.
Importantly, it remains to be seen if in the next rally 2.36 percent acts as resistance. Mid-April, 2.62 percent did. Until the downward momentum is broken, it will continue to be an uphill task for non-commercials, who have sizable holdings in net shorts in 10-year-note futures. They cut back some this week.
30-year bond: Currently net short 9.3k, down 34.7k.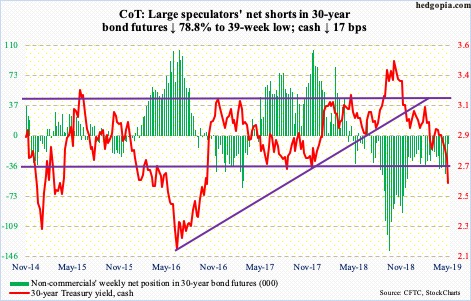
Major economic releases next week are as follows.
May’s ISM manufacturing index is scheduled for Monday. April activity fell 2.5 points month-over-month to 52.8 – a 30-month low.
Tuesday brings April’s revised durable goods data. The advance report showed orders for non-defense capital goods ex-aircraft – proxy for business capex plans – decelerated to year-over-year growth of 1.3 percent. This was the slowest pace since January 2017.
The ISM non-manufacturing index for May is due out Wednesday. Services activity in April dropped six-tenths of a point m/m to 55.5.
Revised productivity numbers for 1Q19 will be published Thursday. Preliminarily, non-farm output per hour jumped at an annual rate of 3.5 percent in the quarter – the best rate in 18 quarters.
May’s employment report comes out Friday. April produced 263,000 non-farm jobs for a monthly average this year of 205,000, versus last year’s monthly average of 223,000.
Crude oil: Currently net long 536.9k, down 45.4k.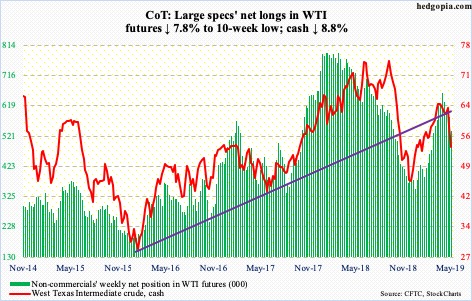
After peaking at $66.60/barrel on April 23, the cash ($53.50) went on to post a lower high on May 20. All along, the crude made lower lows, including this week. It lost another 8.8 percent this week. Unwinding of overbought weekly indicators has picked up momentum. There was decent support at $54-55, and bulls were unable to save it.
The EIA report for the week of May 24 was mixed, but markets focused on the negatives. US crude production rose 100,000 barrels per day to 12.3 million bpd, matching a record high of a month ago. Gasoline stocks increased 2.2 million barrels to 230.9 million barrels. Distillate stocks, however, fell 1.6 million barrels to 124.8 million barrels. Crude stocks, too, dropped 282,000 barrels to 476.5 million barrels but the drop was less than expected; prior week’s total was the highest since July 2017. Crude imports declined 81,000 bpd to 6.9 mbpd. Refinery utilization rose 1.3 percentage points to 91.2 percent.
E-mini S&P 500: Currently net long 92.4k, down 8.4k.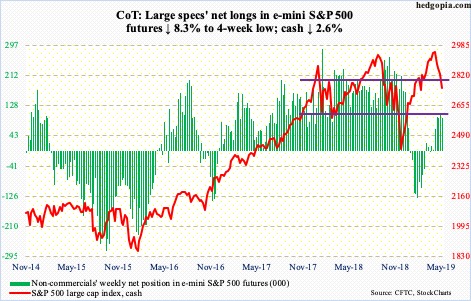
US-based equity funds lost $22 billion in the week to Wednesday (courtesy of Lipper). This was the biggest weekly withdrawal since last December. Bulls are probably thinking this is as good as a washout. For reference, in the couple of weeks ended December 19 back then, $80.8 billion left these funds.
Also in the week to Wednesday, SPY (SPDR S&P 500 ETF), VOO (Vanguard S&P 500 ETF) and IVV (iShares core S&P 500 ETF) lost a combined $3.5 billion (courtesy of ETF.com). In the meantime, money-market assets rose $18 billion to $3.15 trillion – the highest since March 2010 (courtesy of ICI). The buildup in these funds is a headwind for stocks. This will turn into a tailwind once the trend reverses.
The cash (2752.06) peaked on May 1 at 2954.13. Through Friday’s intraday low, it was down 6.9 percent from that high. Overbought weekly indicators have begun unwinding, and this can continue. Bulls lost 2800 on Wednesday. In a doji session Thursday, bears used that level to sell/go short. Come Friday, the 200-day moving average fell.
The daily is grossly oversold. The next time the S&P 500 rallies, shorts are likely to get active at 2800.
Euro: Currently net short 99.7k, down 1.4k.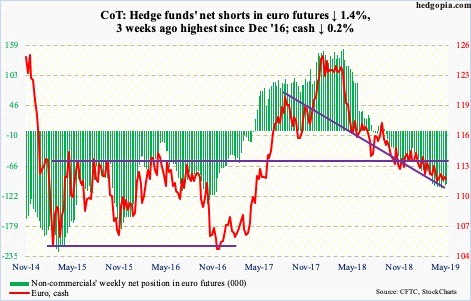
Last Friday’s intraday high of $112.13 was all euro bulls could manage after bottoming at $111.08 one day prior. The 50-day, which continues to drop, was not even tested. The average has resisted rally attempts the past three months.
That said, the cash ($111.81) this week defended one-month support just north of $111. On the weekly, after last week’s hammer, a dragonfly doji showed up. These are potentially positive developments provided $111 is not breached.
Gold: Currently net long 86.7k, down 2.1k.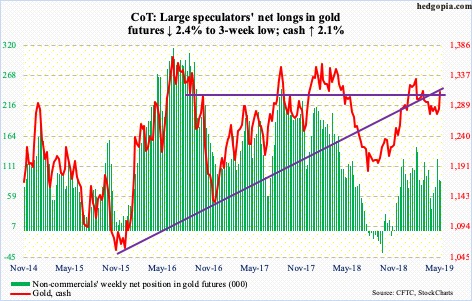
Thursday, the cash ($1,311.10/ounce) rallied 0.5 percent to retake the 50-day, closing right on a falling trend line from February 20 when gold retreated after tagging $1,349.80. Come Friday, the metal broke through. Since that high, gold bugs repeatedly failed to take out $1,300, which has been an important price point going back to September 2010. Friday’s 1.5-percent rally took care of that. This likely opens the door to a test of $1,360s in due course. Flows do need to cooperate a whole lot better in this scenario.
In the ween through Wednesday, GLD (SPDR gold ETF) took in $84 million, while IAU (iShares gold trust) lost $32 million (courtesy of ETF.com).
Nasdaq 100 index (mini): Currently net long 17.7k, up 4.8k.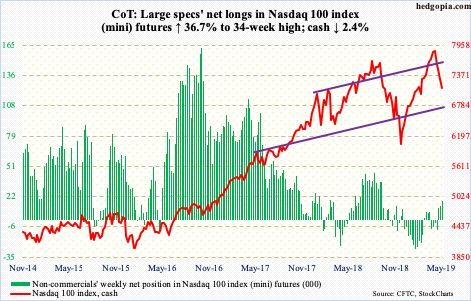
In the week ended Wednesday, QQQ (Invesco QQQ trust) lost $355 million, reversing inflows of $664 million in the prior week (courtesy of ETF.com). The cash (7127.96) began the holiday-shortened week where it left off last week – down. By Friday, bulls lost dual support – horizontal at 7200 and the 200-day. Should they put their foot down near term, it will be interesting to see if these levels – and 7350 after that – attract sellers.
Medium term, risk likely is to the downside.
Russell 2000 mini-index: Currently net short 16.4k, up 1.7k.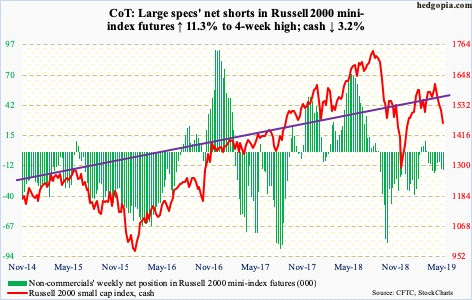
Small-cap bulls were unable to stop the cash (1465.49) from posting a lower low this week. In the week to Wednesday, $737 million came out of IWM (iShares Russell 2000 ETF) and $174 million out of IJR (iShares core S&P small-cap ETF). This compares with combined inflows of $1 billion in the prior week (courtesy of ETF.com).
Since May 6 when it was rejected at 1600-plus, the Russell 2000 has struggled to save support zones – both major and minor. It has been under the 50- and 200-day for three weeks now. The daily is oversold but has been helpless in front of the overbought weekly, which continues to unwind.
There is decent support at 1450s, which was just about tagged Friday. In the event of a rally, short-term resistance lies at 1505.
US Dollar Index: Currently net long 27.1k, up 386.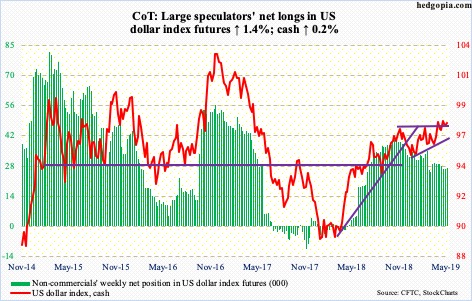
The breakout at 97.50s two weeks ago remains intact, but barely. Dollar bulls are having difficulty meaningfully building on it. Last Thursday, the cash (97.67) rose to a two-year high of 98.26 but only to reverse hard, ending with a candle with a long wick. This Thursday, it went after that high, but unsuccessfully. Trend-line support from last September gets tested around 96, which approximates the 200-day.
VIX: Currently net short 105.8k, up 507.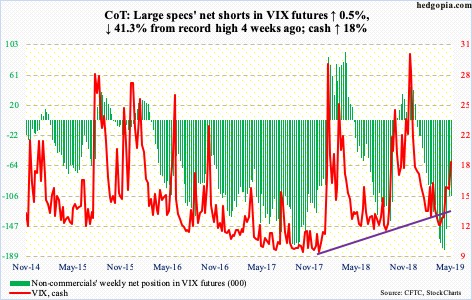
This week, the S&P 500 lost 2.6 percent, the Nasdaq 100 2.4 percent and the Russell 2000 3.2 percent to new lows this year. Bulls nonetheless are not aggressively buying protection. For the week, the cash rallied 2.86 points to 18.71. VIX remains substantially under the May 9th intraday, four-month high of 23.38.
The consolation for volatility bulls is that last week the 50-day was defended. The average is beginning to turn up. This week, VIX rallied past the 200-day. Longer-term, several momentum indicators on the monthly have turned up.
Near term, a rally/spike into the low-20s has the potential to attract volatility sellers.
Elsewhere, the 21-day moving average of the CBOE equity-only put-to-call ratio closed Friday at 0.6968, up from 0.5962 on April 30. Historically, the ratio tends to revert from high-0.60s/low-0.70s. As that happens, equities go the other way.
Thanks for reading!
