
Following futures positions of non-commercials are as of January 14, 2020.
10-year note: Currently net short 223.6k, up 44.3k.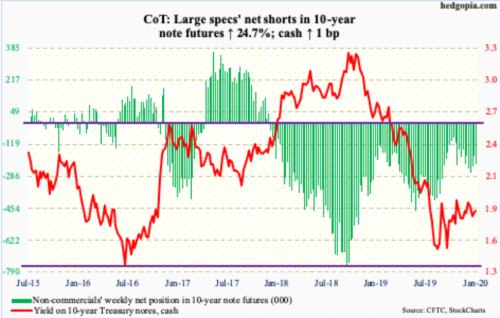
Bond bulls and bears continue to fight over control of trend-line support from early September when the 10-year Treasury yield (1.84 percent) bottomed at 1.43 percent, which essentially matched the July 2012 trough of 1.39 percent and the low four years after that of 1.34 percent. That trend line extends to 1.70s. Both Wednesday and Thursday, rates touched 1.78 percent intraday before rising.
Even if bears (on price) succeed in pushing the 10-year rate higher, which is likely near term, the 50-day moving average lies right at 1.84 percent. A little above that, around 1.88 percent, lies trend-line resistance from Christmas Eve. Then comes 1.95-1.97 percent which provided resistance in both November and December. The 200-day rests at 1.96 percent.
In other words, there is plenty of overhead resistance for a sustained rally to occur – not music to the ears of non-commercials who hold tons of net shorts in 10-year note futures.
30-year bond: Currently net short 57.2k, down 41.5k.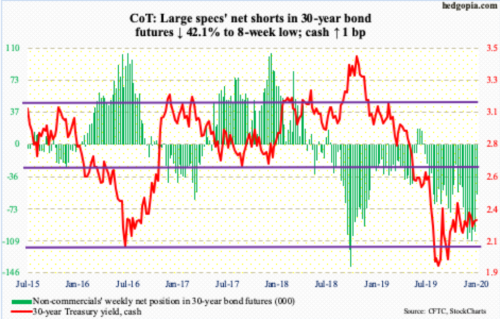
Markets are closed Monday for observance of Martin Luther King Jr. holiday.
Existing home sales (December) are due out Wednesday. November sales were down 1.7 percent month-over-month to a seasonally adjusted annual rate of 5.35 million units. The cycle high 5.72 million was recorded in November 2017. During the housing bubble, sales peaked at 7.26 million in September 2005. Despite this, the price of an existing home jumped to a new all-time high of $285,300 last June, with November at $271,300. Inventory stood at 1.64 million in November – a nine-month low.
WTI crude oil: Currently net long 719.2k, down 45.3k.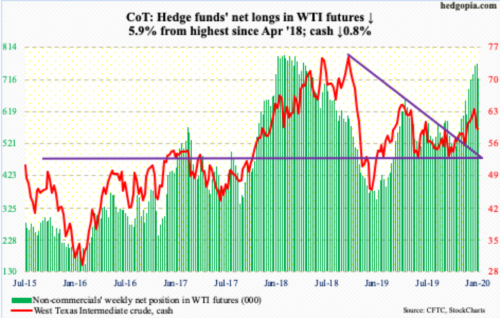
Last Wednesday, the cash ($58.58/barrel) staged a massive reversal after tagging $65.65 intraday. The downward momentum continued this week, although the drop was contained, down 0.8 percent for the week. The 50-day ($58.94) was lost Monday. The 200-day ($57.80) also lies in the vicinity, which bulls defended all week. Right around here also lies trend-line support from the lows of early October last year. A breach exposes the crude to a test of $55.
In the meantime, the EIA report for the week to January 10 showed US inventory rose 100,000 barrels/day to 13 million b/d – a new record. Gasoline and distillate inventory increased as well – up 6.7 million barrels and 8.2 million barrels to 258.3 million barrels and 147.2 million barrels respectively. Refinery utilization edged lower eight-tenths of a percentage point to 92.2 percent. Crude stocks, however, fell 2.5 million barrels to 428.5 million barrels. Crude imports fell as well – down 178,000 b/d to 6.6 mb/d.
E-mini S&P 500: Currently net long 33k, down 7.8k.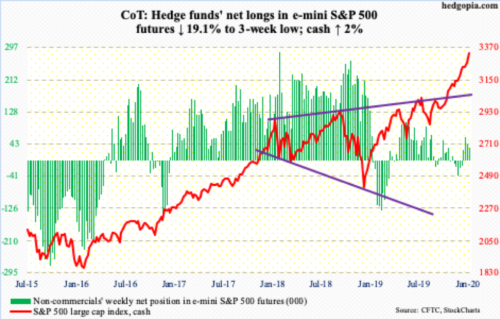
The cash (3329.62) rallied all along the rising daily upper Bollinger band. With two weeks to go, it is already up 3.1 percent this month. Investor optimism was very high – giddy by some measures – going into the 4Q19 earnings season. The bar customarily has been lowered for companies to meet or beat (more on this here). This has nothing but helped bullish momentum to stay on the current trajectory. No matter how overbought conditions are. On the S&P 500, with both the daily and weekly RSI well above 70 for the last several weeks, now the monthly has crossed 70.
In the week to Wednesday, SPY (SPDR S&P 500 ETF), VOO (Vanguard S&P 500 ETF) and IVV (iShares Core S&P 500 ETF) together took in $3 billion (courtesy of ETF.com). In the same week, US-based equity funds lost $1.1 billion (courtesy of Lipper).
Euro: Currently net short 48.2k, down 13.5k.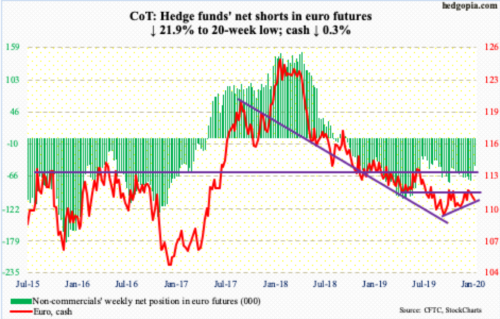
Until Thursday, euro bulls and bears continued to show up at the 50- and 200-day respectively. The former was defended last week, and the latter this week. Come Friday, the 50-day was breached. Not much separate the two, with the 50-day at $110.95 and the 200-day at $111.41. Should these levels fall, there is then horizontal resistance at $111.80s and support at $110.75. The latter represents a trend line from early October when the cash ($110.85) bottomed at $108.85. As things stand, it is likely support gets tested in the sessions ahead, not resistance.
Gold: Currently net long 319.2k, down 3.1k.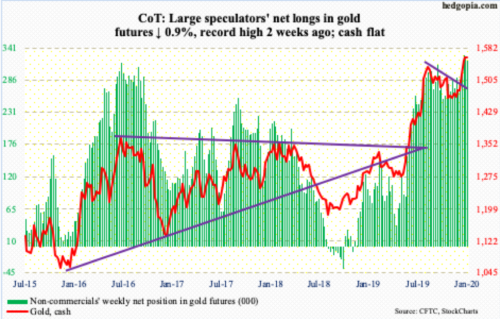
In the week to Wednesday, $413 million came out of GLD (SPDR Gold ETF), while IAU (iShares Gold Trust) took in $46 million (courtesy of ETF.com). In the prior week, GLD lost $328 million. This is precisely what bulls do not want to see happen given where the metal sits currently.
The cash ($1,560.30/ounce) rallied big after bottoming at $1,440s last November, before reversing on the 8th this month after tagging $1,613.30 intraday. Resistance at $1,550s-60s, which goes back to April 2011, is massive. Thus far, it is holding. Non-commercials in this regard are the other wildcard. They rode the recent rally in gold perfectly and are heavily exposed on the long side.
Nearest support lies at $1,520s, and after that the 50-day at $1,496.22. Should a test occur, this will be an opportunity for gold bugs to reload. Tuesday’s intraday drop to $1,536.40 was bought.
Nasdaq 100 index (mini): Currently net long 16.7k, up 51.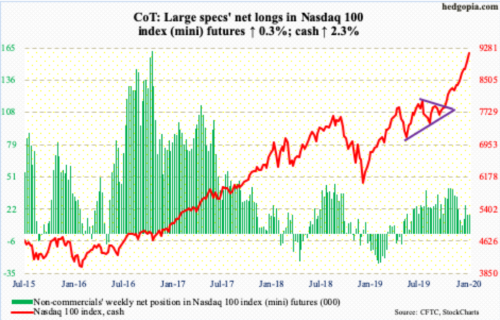
In the week to Wednesday, QQQ (Invesco QQQ Trust) attracted $208 million (courtesy of ETF.com). This was the sixth positive weekly total out of seven, during which a total $2.4 billion came in. Bulls have made full use of it.
The cash (9173.73) rallied 2.3 percent this week to yet another high. This was the 14th up week in the last 16. Conditions are way overbought, with the daily, weekly and monthly RSI all in the 70s, but momentum remains up. The last time the 20-day was tested was five weeks ago.
Tech remains the go-to sector for bulls, accounting for 23.2 percent of the S&P 500 market cap last year; health care was a distant second at 14.2 percent (more on this here). The top five companies were all tech – Apple (AAPL), Microsoft (MSFT), Alphabet (GOOG/L), Amazon (AMZN) and Facebook (FB). The ongoing rally is increasingly top-heavy. At some point, the lop-sided nature of the uptrend becomes more of a risk than a reward. Until then, bears keep getting gored.
Russell 2000 mini-index: Currently net long 48.7k, up 2.8k.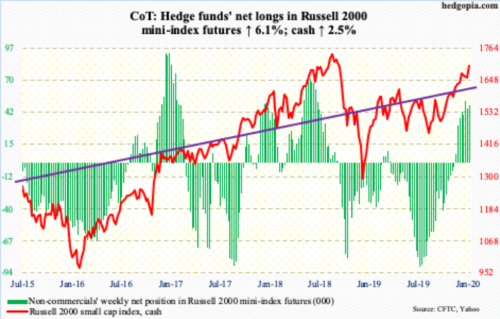
At least until Wednesday, flows were not in cooperation, with IWM (iShares Russell 2000 ETF) losing $713 million in the week ended that session and IJR (iShares Core S&P Small-Cap ETF) drawing in $58 million (courtesy of ETF.com). But that did not even remotely matter.
Seven weeks ago, the cash (1699.64) broke out of major resistance just north of 1600. Before this, bulls resolutely defended support at 1450s. Using a measured-move target, range breakout traders would be looking to at least test the all-time high of 1742.09 from August 2018. Before Friday’s intraday reversal, the Russell 2000 tagged 1715.08.
This week, the three-week consolidation following a December 27th retreat got resolved to the upside (more on this here), although the week did not quite end in an encouraging manner. In the sessions ahead, 1680s has now taken on significance.
US Dollar Index: Currently net long 13.3k, up 795.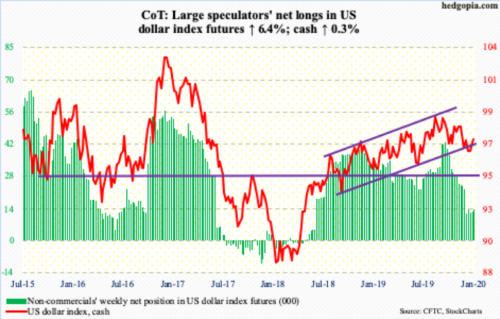
Thursday’s intraday low of 96.82 successfully tested a rising trend line from September 2018. Friday, the cash (97.36) closed right on the 50-day. The 200-day (97.44) lies right above. Then there is horizontal resistance at 97.50s, which is where a falling trend line from early October last year extends to. This is not an easy zone for the US dollar index to sustainably conquer right away. Should this ceiling crack, the upper end of the 17-month channel it is in lies just north of 100.
VIX: Currently net short 167.6k, up 22.7k.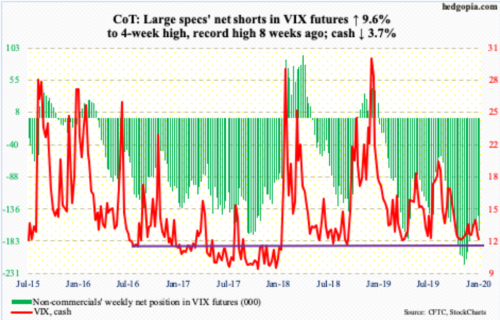
In the last three sessions this week, the cash (12.10) was pushed under 12 intraday but only to crawl its way back up above by close. Despite the incessant rally in the S&P 500, volatility bulls have not lost support at 11-12, let alone 10. But that is small consolation to volatility bulls given rally attempts have been persistently denied at a trend line from early August when VIX tagged 24.81 intraday.
Non-commercials likely anticipate a breach of 12 in the sessions ahead. After cutting back for seven straight weeks from record high, they added this week to net shorts.
In the meantime, the options market continues to exude optimism. Giving credit where it is due, equity bulls have been right on the money for three and a half months for their optimism, which has now risen to giddiness. The 21-day moving average of the CBOE equity-only put-to-call ratio ended the week at 0.506, which is the lowest since July 2014. The rubber band keeps getting stretched.
Thanks for reading!
