
Following futures positions of non-commercials are as of September 7, 2021.
10-year note: Currently net long 780, up 30.6k.
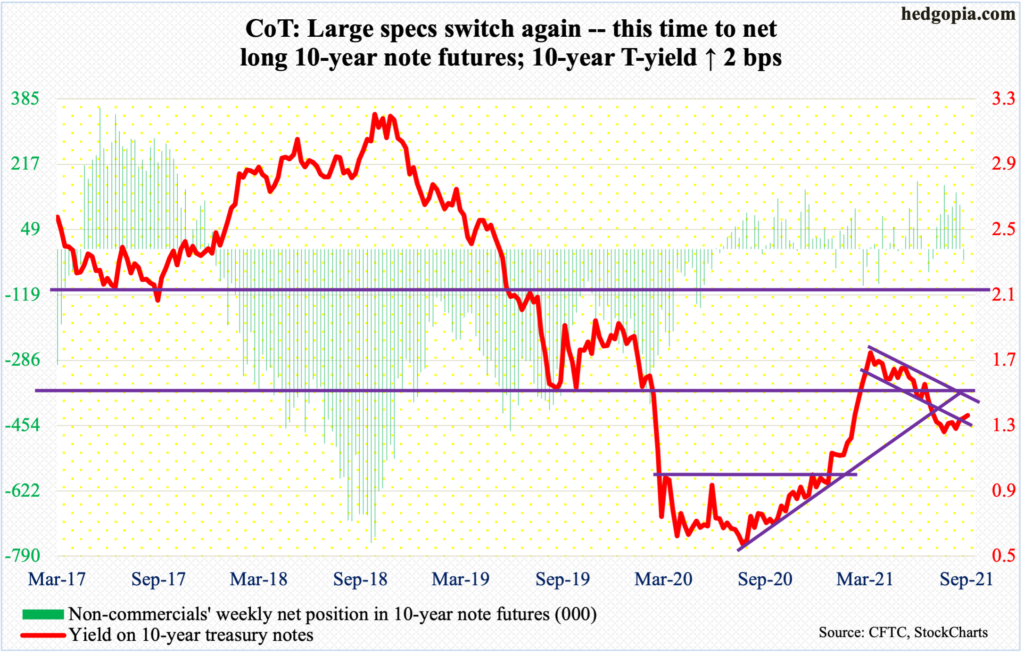
Once again on Tuesday, the 10-year treasury yield faced stiff resistance at just under 1.4 percent; the session high 1.39 percent was sold a tad above the daily upper Bollinger band. This was the third instance in just under a month that bond bears (on price) failed to clear the hurdle, with the prior two having occurred on the 12th and 26th last month.
Rates remain sandwiched between two crucial levels – low-1.40s and one percent. After the 10-year bottomed at 0.4 percent in March last year, one after another resistance gradually fell. In January this year, one percent gave way, followed by low-1.40s the next month. Rates then went on to rally to 1.77 percent by March. The drop from that high bottomed at 1.13 percent in July and August.
Rejection at high-1.30s – before even reaching low-1.40s – speaks of the momentum bond bulls are enjoying. That said, rates are well above one percent, where they are likely to face stiff opposition from the bears.
Right here and now, the 10-year (1.34 percent) has room to head lower – toward low-1.20s, or 1.13 percent in a worse-case scenario for the bears.
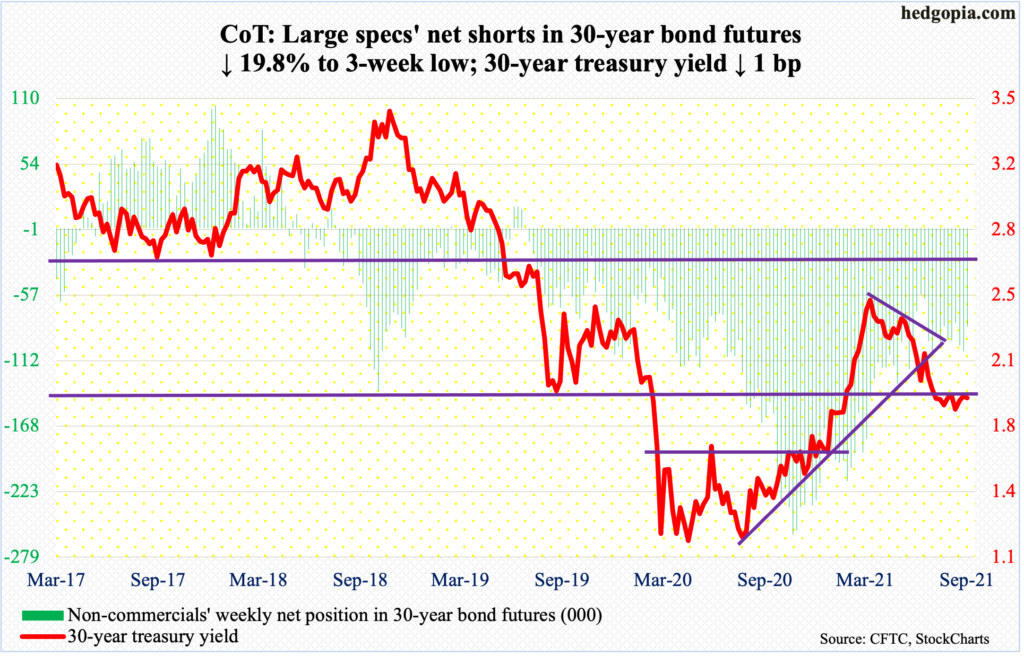
30-year bond: Currently net short 83.6k, down 20.6k.
Major economic releases for next week are as follows.
The NFIB optimism index (August) and the consumer price index (August) are due out on Tuesday.
Small-business job openings rose three points month-over-month in July to 49 – a new record.
In July, headline and core CPI increased 0.5 percent and 0.3 percent respectively over June. Over a year ago, they respectively jumped 5.4 percent and 4.3 percent.
Industrial production (August) comes out on Wednesday. Capacity utilization edged up 0.9 percent m/m in July to 76.1 percent – a 17-month high.
Thursday brings retail sales (August) and Treasury International Capital data (July).
Retail sales increased 15.8 percent year-over-year in July to a seasonally adjusted annual rate of $617.7 billion. Sales have weakened since April when they surged 53.4 percent y/y to a record $628.8 billion.
In the 12 months to June, foreigners purchased $312.5 billion in US stocks, which is massive but the trend is down with record high $405.5 billion posted in March.
The University of Michigan’s consumer price index (September, preliminary) is scheduled for Friday. Sentiment in August tumbled 10.9 points m/m to 70.3, undercutting the post-pandemic low of 71.8 from April last year.
WTI crude oil: Currently net long 359k, down 3k.
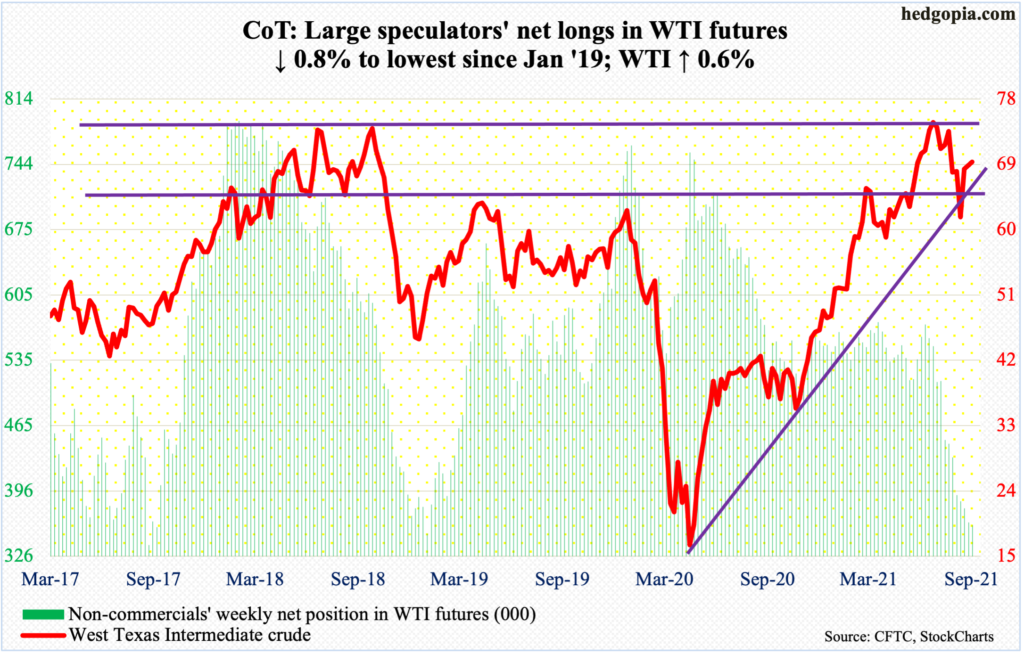
Last week, oil bulls were rejected at a confluence of a falling trend line from July 6 when West Texas Intermediate crude ($69.72/barrel) reversed lower after ticking $76.98 and the 50-day moving average ($69.86).
This week, the 20-day ($67.60) consistently drew bids, rallying 0.6 percent to close right on the dual resistance. One would think the crude would do a lot better this week on the back of Hurricane Ida. Should it manage to break out of the roadblock next week, $70-$71 is achievable, but staying there can prove tough.
In the meantime, Ida’s impact was felt throughout the oil infrastructure. US crude production in the week to September 3 declined 1.5 million barrels per day to 10 mb/d. Crude imports dropped as well, down 530,000 b/d to 5.8 mb/d. As did stocks of crude, gasoline, and distillate, which were down 1.5 million barrels, 7.2 million barrels and 3.1 million barrels to 423.9 million barrels, 220 million barrels and 133.6 million barrels, in that order. Refinery utilization tumbled 9.4 percentage points to 81.9 percent.
E-mini S&P 500: Currently net short 28.4k, down 359.
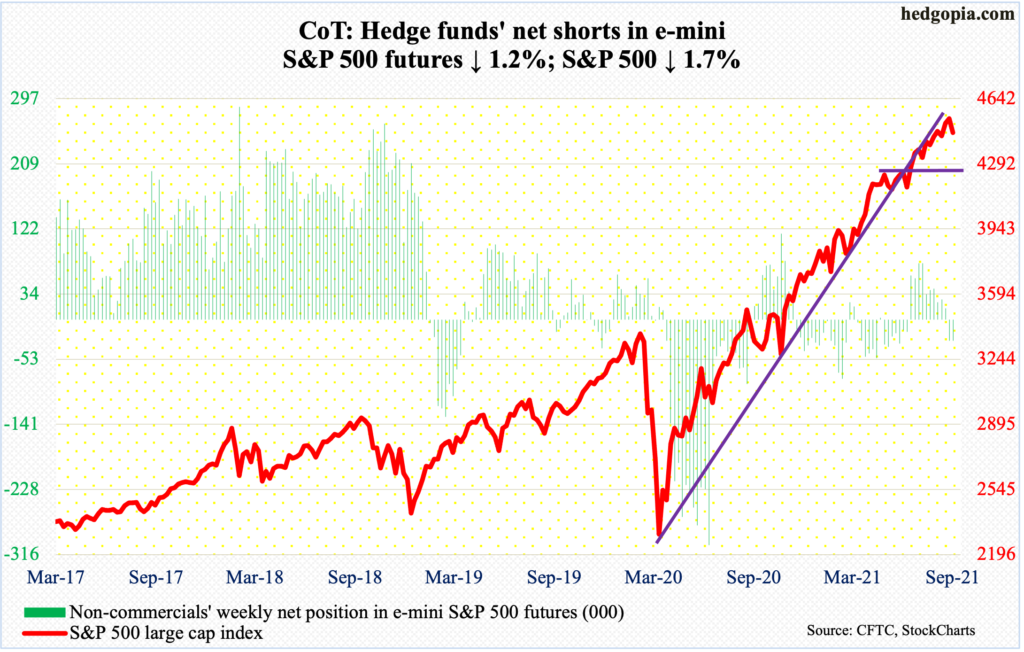
Both Thursday and Friday last week produced doji indecision. This followed an 11-session, 4.1-percent intraday rise through last Thursday’s all-time high of 4546; that rally got going after a successful test of the 50-day.
This week, the S&P 500 – in overbought territory on nearly all timeframes – came under pressure right from the start, dropping in all four sessions, for a weekly decline of 1.7 percent.
The September 2 all-time high also kissed the daily upper Bollinger band. The lower band at 4407 is 1.1 percent lower. The 50-day is just a tad above at 4424. This will be an 11th test from May last year, with bulls successfully defending the prior 10. A breach – likely – exposes the large cap index (4459) to a test of 4360s.
Ahead of this, $5.1 billion moved into SPY (SPDR S&P 500 ETF), VOO (Vanguard S&P 500 ETF) and IVV (iShares Core S&P 500 ETF) in the week to Wednesday, preceded by $9 billion in inflows in the prior week (courtesy of ETF.com). In the same week, US-based equity funds gained $1.1 billion; in the prior week, inflows were $12.7 billion (courtesy of Lipper).
Euro: Currently net long 26.3k, up 15.8k.
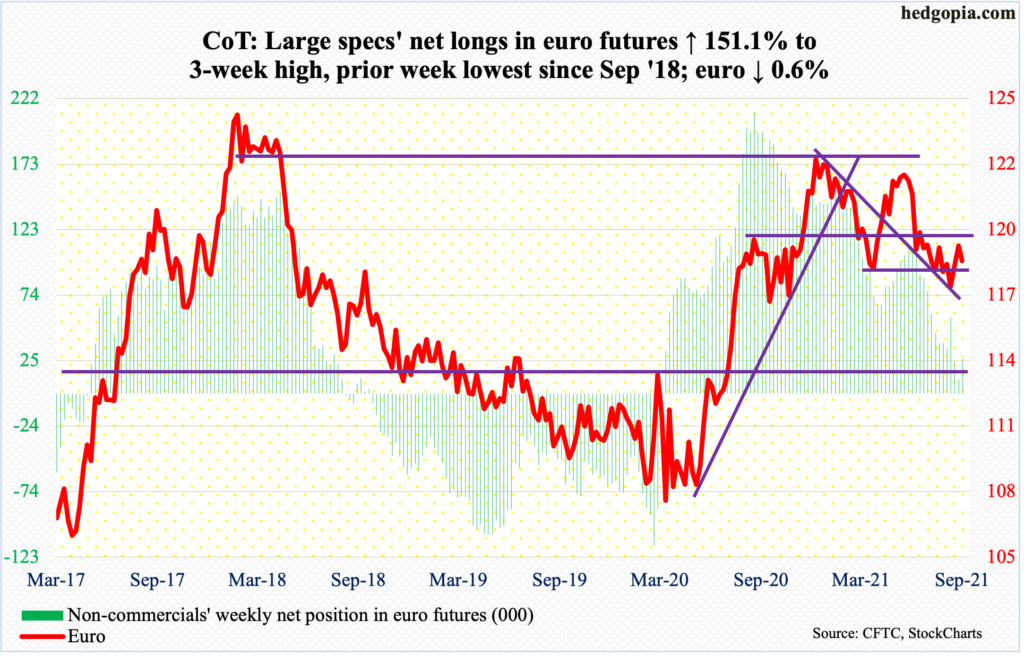
The European Central Bank is slowing down the pace of stimulus under its pandemic emergency purchase program (PEPP). The bond-buying program began in March last year with an aim to buy €1.85 trillion in bonds; it is slated to run until March next year.
Thursday’s ECB decision was expected, although it was short on specifics. It currently buys €80 billion of assets every month; in reaction, the euro ($1.1811) initially dropped but bounced off session lows at the 50-day to edge up 0.1 percent, but only to give it back on Friday.
A week before that, the currency ticked $1.1909 intraday but closed poorly, leaving behind a large upper shadow. Resistance at $1.19-$1.20 has proven to be an important level going back more than 18 years.
The 50-day at $1.1802 is right in line with horizontal support at $1.18, which likely gives way in the sessions ahead.
Gold: Currently net long 206k, down 10.5k.
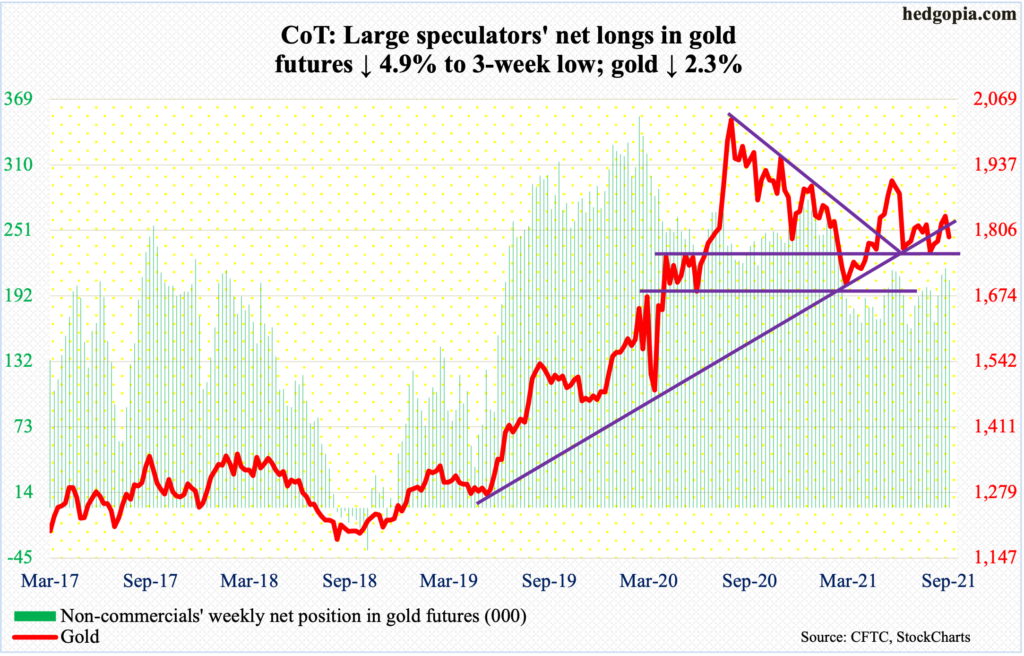
In the week to Wednesday, IAU (iShares Gold Trust), for a change, took in $55 million; in nine of the prior 10 weeks, the ETF lost $511 million. GLD (SPDR Gold ETF) during that time witnessed outflows of $2.6 billion; the trend continued in the week to Wednesday, losing another $102 million (courtesy of ETF.com).
Gold ($1,792/ounce) began the holiday-shortened week with a 1.9-percent tumble past the 200-day. Last week, it closed right on $1,830s resistance; Tuesday’s (this week) session did open there but it was all downhill from there.
A test of crucial support at $1,760s-$1,770s, which goes back a decade, looks imminent. Gold bugs have defended the level several times in the past five months.
Nasdaq 100 index (mini): Currently net long 5k, up 7.4k.
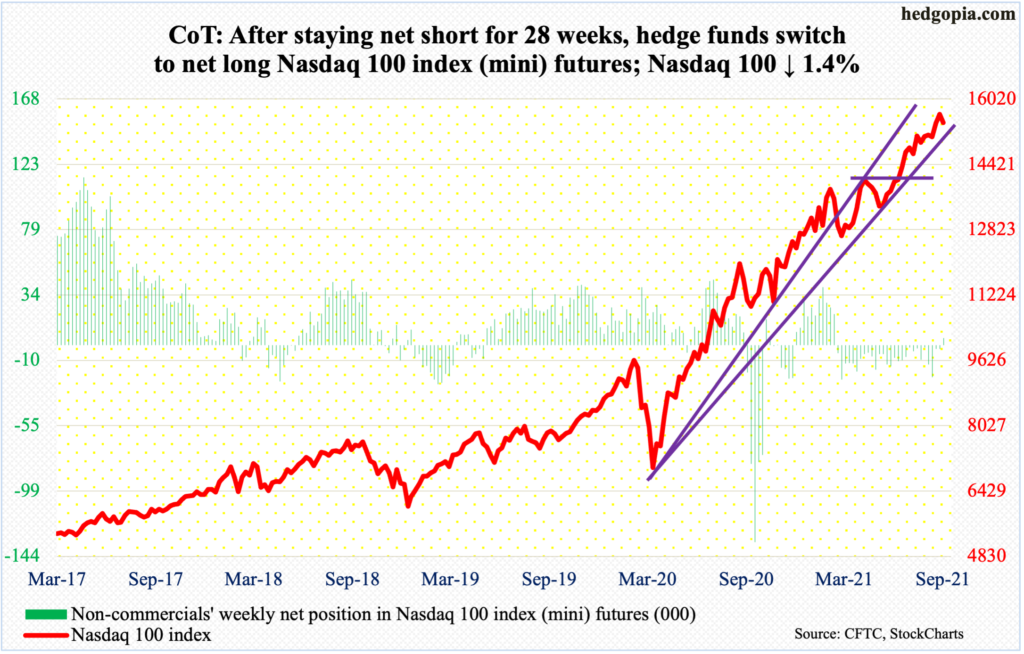
The Nasdaq 100 (15441) gave back 1.4 percent this week, with a new intraday high of 15701 on Tuesday.
Only 16 sessions ago, the 50-day was successfully tested, and from there the index rallied 6.3 percent through this week’s high. The advance-decline line has moved in unison, except it peaked on Thursday last week.
There is support at 15100s, which approximates the 50-day. This will be an important test.
Russell 2000 mini-index: Currently net short 56.4k, down 10.3k.
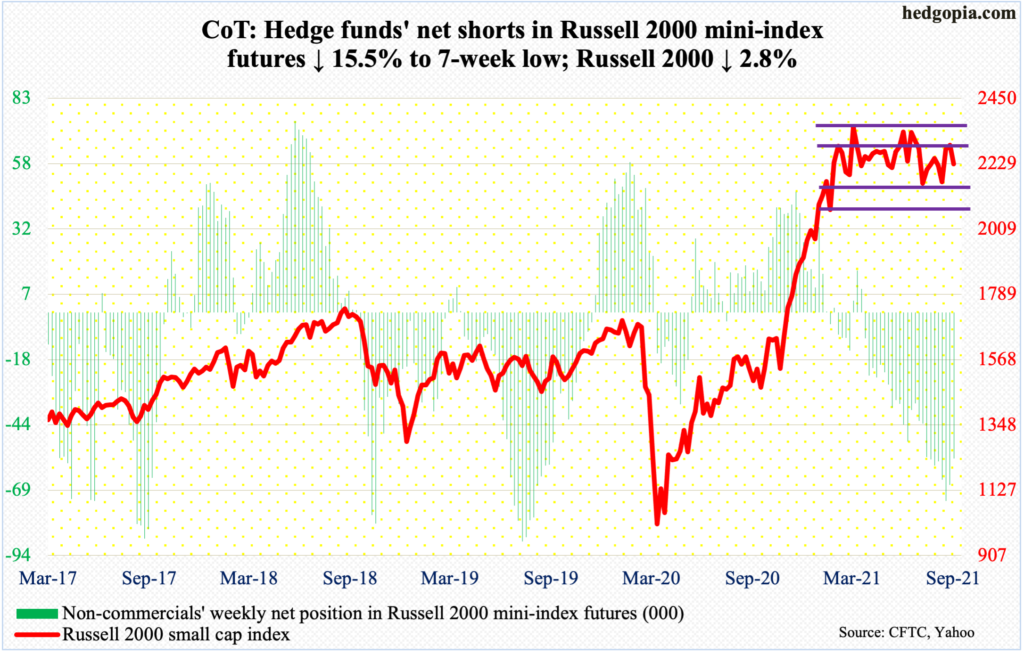
Yet again, small-cap bulls failed to deliver.
Last week, the Russell 2000 closed at 2292, just above 2280s resistance. A decisive takeout would have opened the door to a test of the upper bound of a six-month rectangle at 2350s. This week, the small cap index ticked 2304 intraday Tuesday but only then to weaken as the session progressed. This was followed by intraday highs of 2270s on Wednesday and Thursday, and 2260s on Friday.
The small cap index (2228) is vulnerable to a drop to 2150s and even 2080s, which is where the lower bound of the rectangle lies.
US Dollar Index: Currently net long 21.5k, up 775.
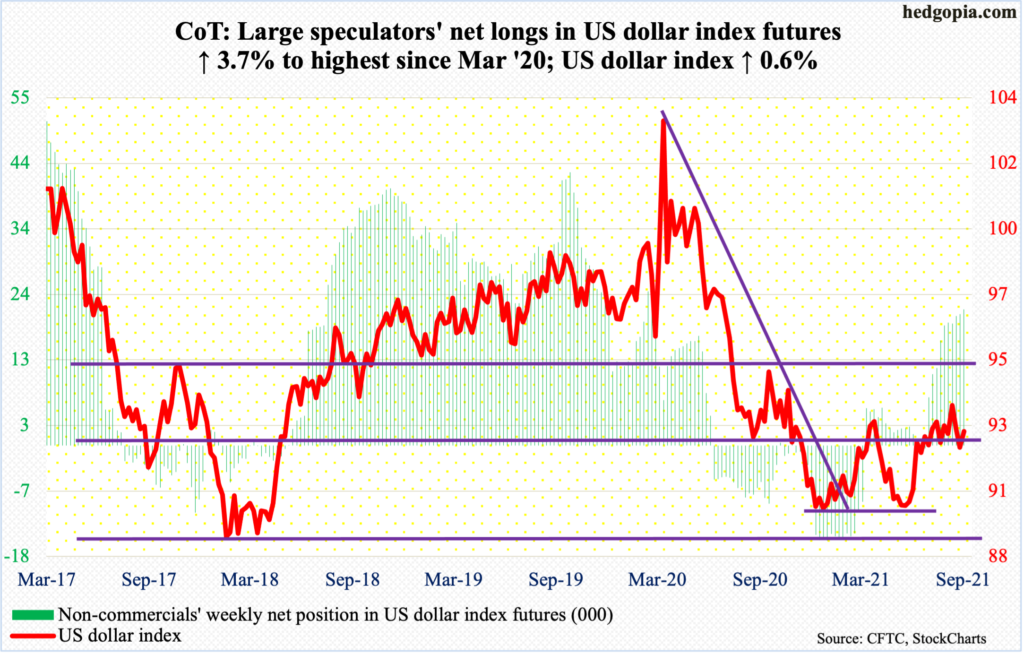
Last Friday, the US dollar index ticked 91.80 intraday before bids showed up to close at 92.03. This was an important test, as support just north of 92 goes back to June 2003.
This week began with a rally on both Tuesday and Wednesday, but the latter’s intraday high of 92.86 drew offers – right at short-term resistance at 92.80s.
As things stand, the index (92.59) is in no man’s land, with an upward bias.
VIX: Currently net short 90.1k, up 4.2k.
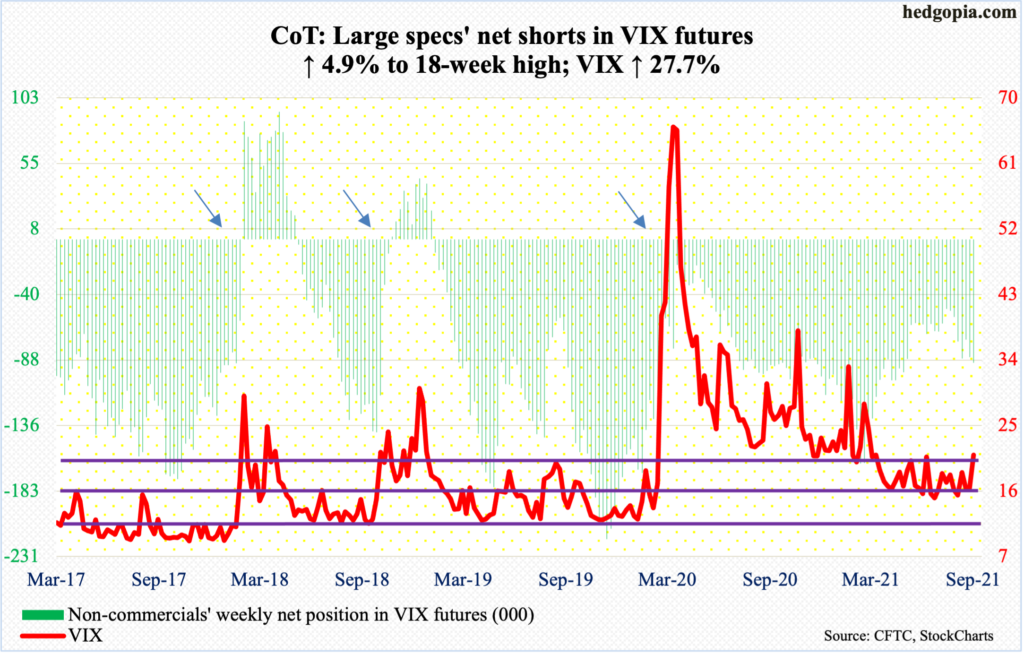
On Wednesday-Friday last week, VIX (20.95) found support at a rising trend line from June 29 when it ticked 14.10. This week, it shot up 27.7 percent, past both the 50- and 200-day, with the latter now beginning to turn up.
The week ended right on low-20s resistance. As things stand, volatility bulls are probably eyeing 25. The spike in volatility this week followed last week’s positive correlation between VIX and the S&P 500 (more on this here).
Longer term, the monthly has plenty of room to rally.
Thanks for reading!
