
Following futures positions of non-commercials are as of December 21, 2021.
10-year note: Currently net short 339.3k, up 65.4k.
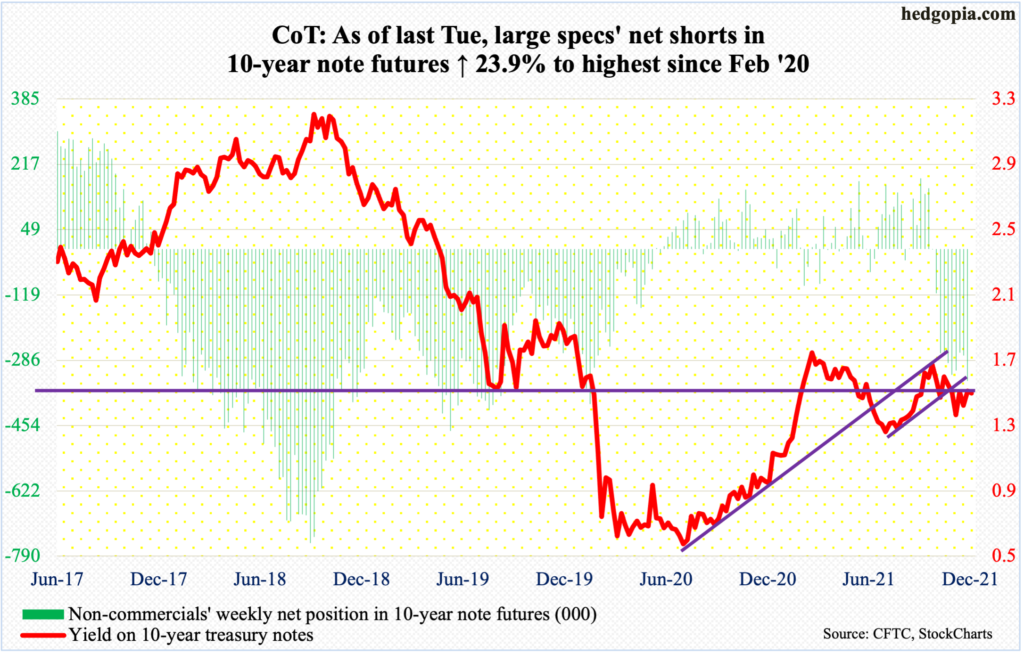
December thus far has been a month in which the 10-year treasury yield has been through lots of ups and downs but is directionless nonetheless. Rates rose as high as 1.54 percent on the 8th and as low as 1.34 percent on the 3rd, ending Monday down a basis point to 1.48 percent.
On the 3rd, the intraday high of 1.54 percent was rejected at the 50-day, which currently stands at 1.53 percent. A takeout of this level can help bond bears, who last week managed to defend 1.37 percent. Mid-1.40s is another level to watch.
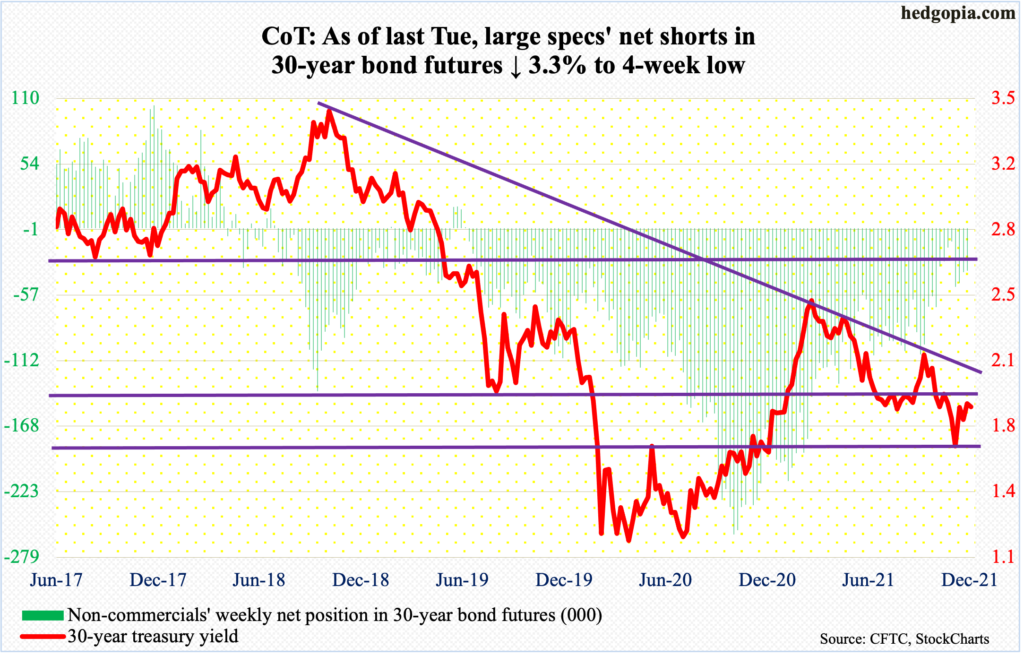
30-year bond: Currently net short 36.1k, down 1.2k.
Major economic releases for rest of the week are as follows. It is a holiday-shortened week. Happy New Year!
Later this morning, the S&P Case-Shiller home price index (October) will be released. In September, US national prices jumped 19.5 percent year-over-year. This was just slightly lower than August’s record 19.8 percent.
WTI crude oil: Currently net long 372k, down 6.8k.
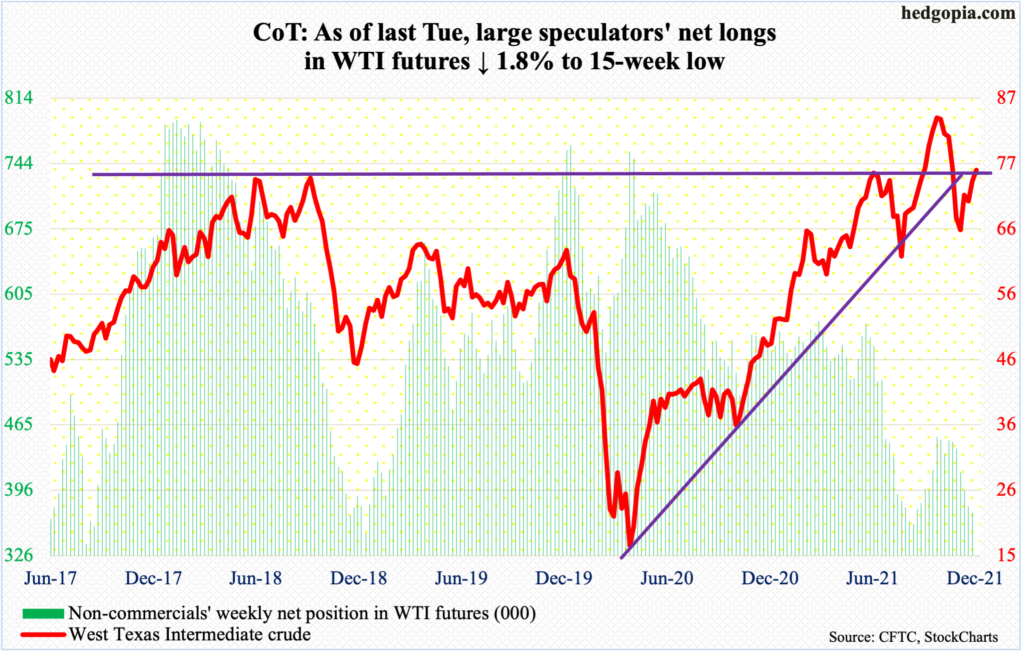
On Monday last week, WTI ($75.57/barrel) tagged $66.12 intraday, which was a test of $66-$67 support, and it held, ending the session at $68.61; the crude then rallied in each of the remaining three sessions, reclaiming the 200-day moving average ($70.52). The 50-day is right above at $76.71, which coincides with horizontal resistance at $76-$77. If WTI manages to get up there, this will be a major test.
E-mini S&P 500: Currently net long 136.4k, down 31.4k.
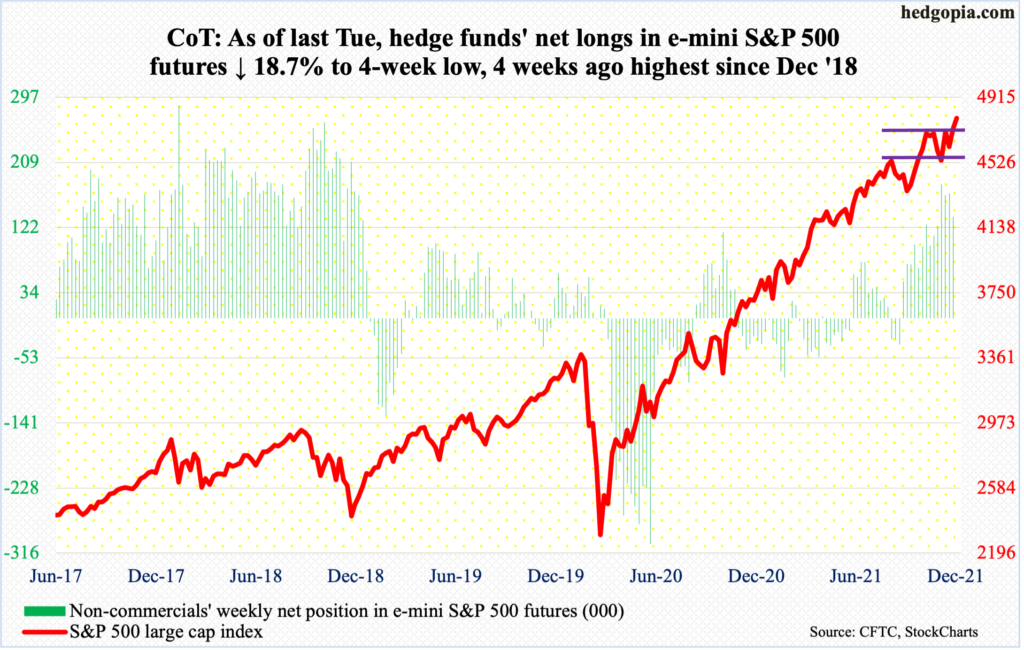
With four sessions remaining, the S&P 500 is up 4.9 percent this month and is on course for a bullish hammer. This comes after November’s potentially bearish shooting star.
On the 22nd last month, the large cap index retreated after posting a new intraday high of 4744; last Friday’s intraday high of 4741 fell short of that high by three points. Come Monday, the S&P 500 (4791) jumped 1.4 percent to break out of eight-week congestion and can rally to 4900 on a measured-move basis.
Euro: Currently net short 10.2k, down 1.7k.
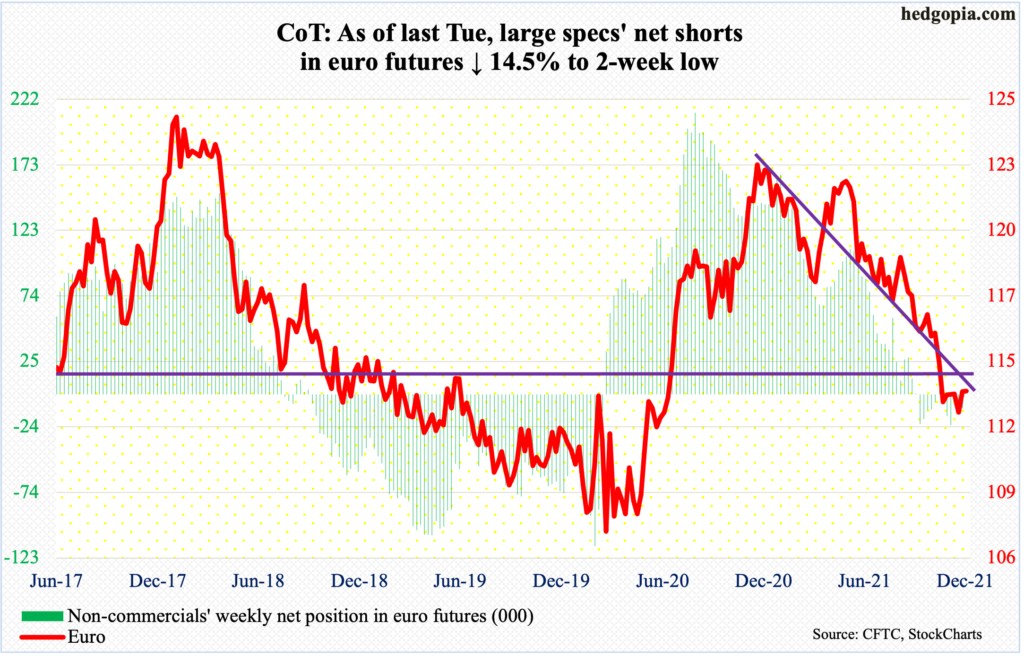
Daily Bollinger bands are tightening on the euro. When this occurs, a sharp move can follow. Odds favor it will be to the upside.
Concurrently, a potentially bullish 10- and 20-day crossover is in the making. Leading up to this, the currency ($1.1328) dropped from $1.2345 in January this year to $1.1186 on November 24.
There is resistance at $1.14-$1.15, which goes back at least 18 years. For over a month now, sellers have showed up just south of $1.14. This is the hurdle for now, followed by the 50-day at $1.1420 and then $1.1510s. Momentum will decidedly shift upward once euro bulls reclaim these levels.
Gold: Currently net long 205.8k, up 3.4k.
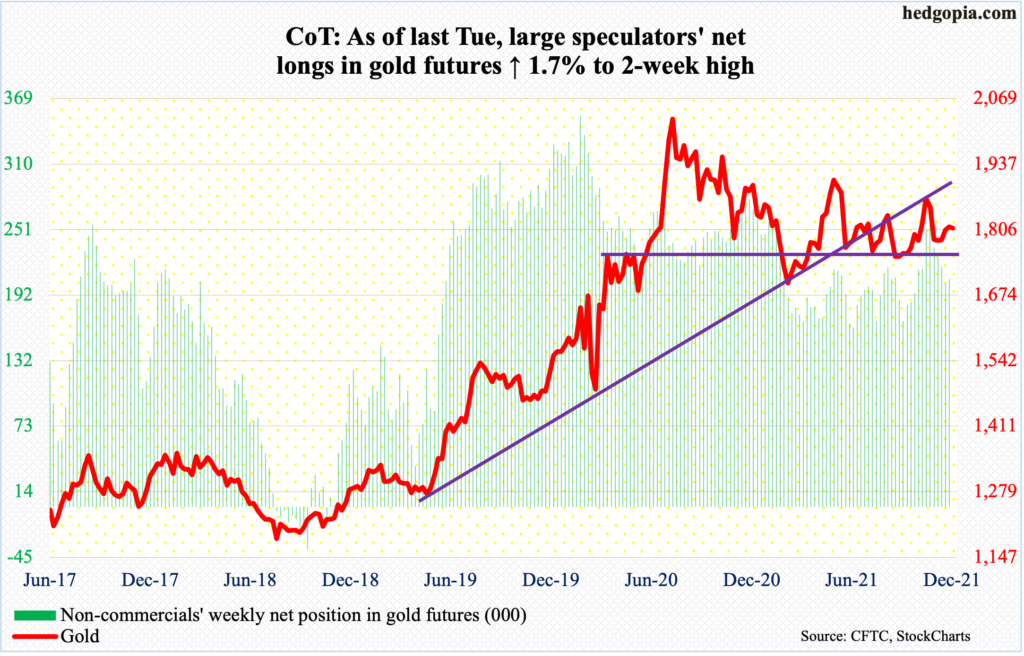
Once again, gold bugs last week defended a rising trend line from August 9 when gold bottomed at $1,670s. They have also been stepping up to save horizontal support at $1,760s-$1,770s. They have, however, been facing difficulty just north of $1,800.
Last week, gold ($1,809/ounce) closed near its weekly high of $1,812, slightly above both the 50- and 200-day. So long as $1,760s-$1,770s remains intact, gold bugs deserve the benefit of the doubt. At least near term, they would have improved their odds if they succeed in taking out $1,816, which was just about tested on Monday.
Nasdaq 100 index (mini): Currently net long 25.4k, down 8.1k.
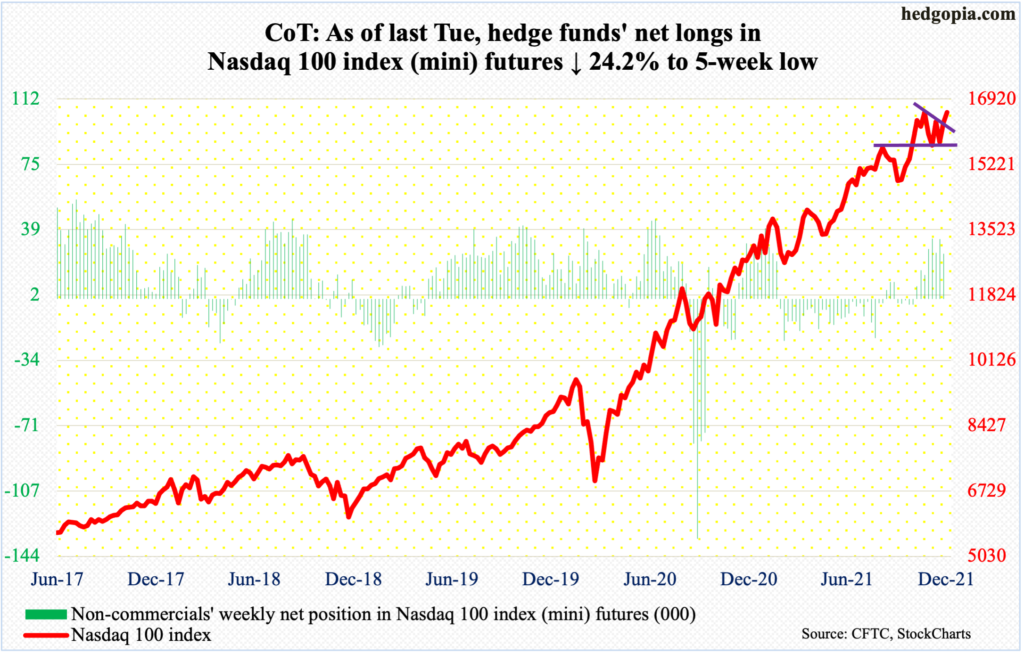
Last week, the Nasdaq 100 rallied 3.2 percent to come within 2.8 percent of its intraday high of 16765 from November 22. Monday’s 1.6-percent rally narrowed the distance to 1.2 percent.
Bulls last week defended straight-line support at 15700s as soon as the week got underway, having dropped as low as 15509 intraday. With four sessions to go this month, the index is up 2.7 percent and is on course for a monthly bullish hammer, which for now potentially negates November’s bearish shooting star.
Russell 2000 mini-index: Currently net short 12.2k, down 15.5k.
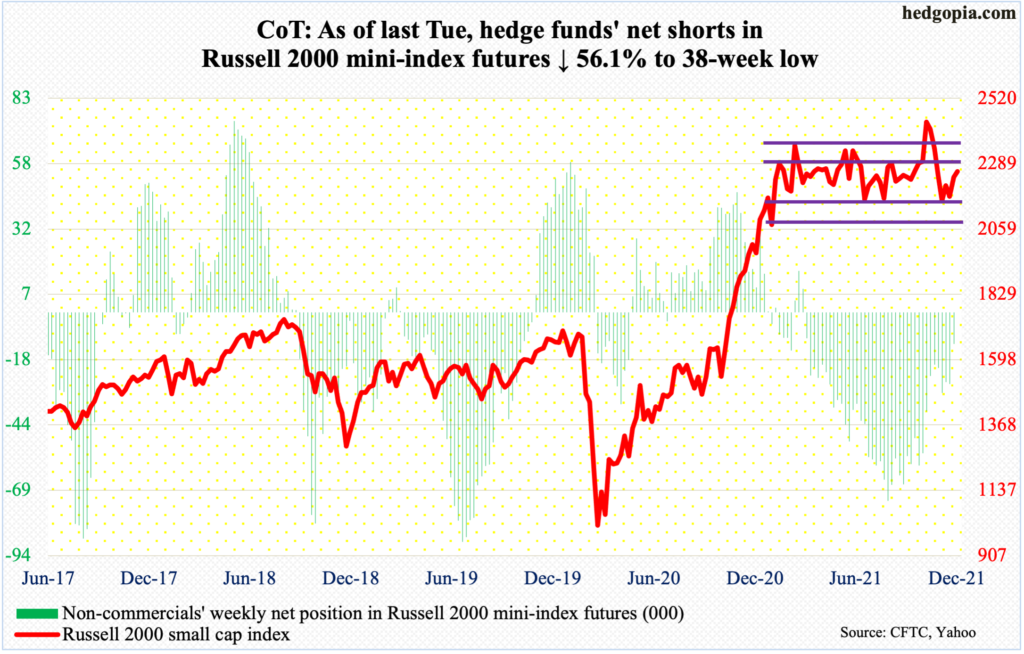
On Monday last week, the Russell 2000 just about tested the lower bound of a nine-plus-month rectangle. Since March last year, the small cap index has gone back and forth between 2350s and 2080s, and between 2280s and 2150s within this box. On Nov 3, it broke out but was quickly followed by a failed retest on the 19th.
The index (2261) is just under nine percent from its Nov 8 record high. In contrast, the S&P 500 is at a new high.
Small-caps tend to have larger exposure to the domestic economy, while its larger-cap cousins also have international exposure. Small-caps’ rangebound action comes amidst the ongoing growth deceleration in the US economy (more on this here). If the Russell 2000 is sending the right signal versus large-caps’, next year’s elevated earnings estimates are probably in for a decent haircut. Time will tell.
US Dollar Index: Currently net long 35.1k, up 3.9k.
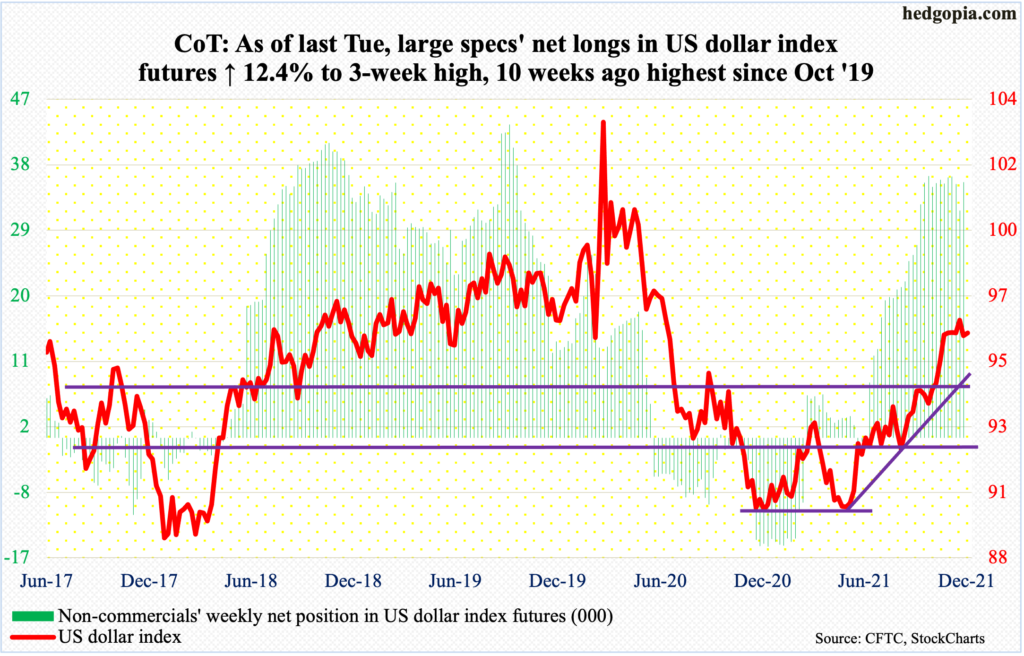
In five of the last six weeks, the US dollar index closed around 96, including last week’s 95.99. This has continued this week, with Monday ending at 96.09. Earlier, it rallied from May’s 89.51 to 96.94 posted on November 24. Horizontal resistance around 97 goes back at least 18 years.
From last month’s high, the index has posted lower highs, even as dollar bulls have defended 95.80s. As is the case with the euro, Bollinger bands have tightened on the daily; this is likely to resolve to the downside.
Nearest decent support lies at 94.50s, which is a combination of a multi-year straight line and a rising trend line from May.
VIX: Currently net short 31.6k, down 13.3k.
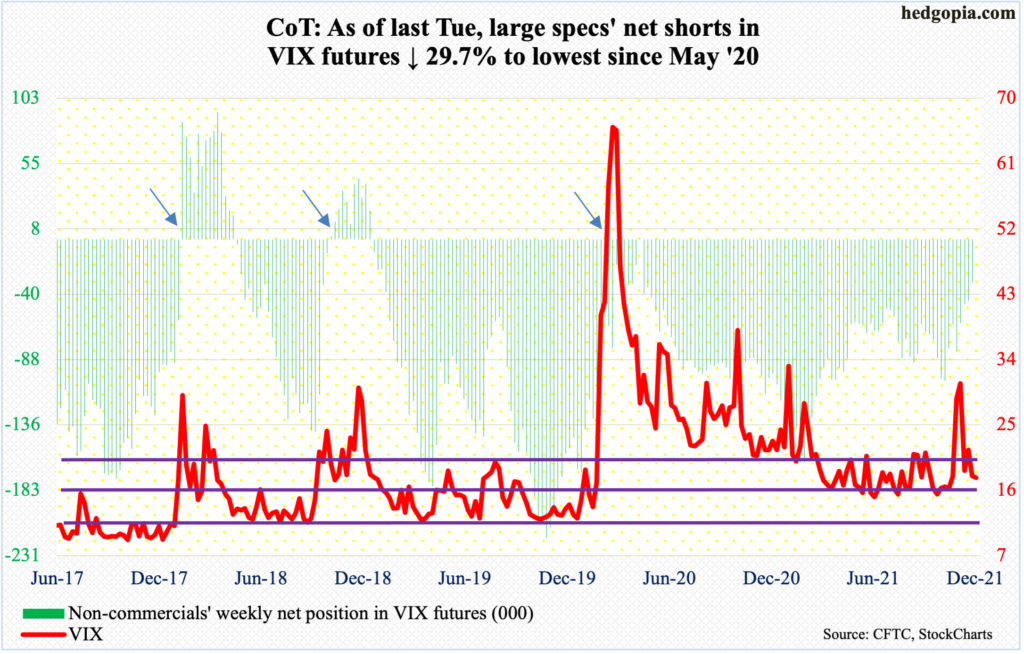
With four sessions left, December is on course for an ugly looking reversal candle. Early this month – on the 3rd to be precise – VIX spiked as high as 35.32 but only to reverse hard lower. The inability to hold on to the highs persisted last week when the volatility index ticked 27.39 intraday but closed at 22.87. By Friday, both the 50- and 200-day had been breached.
It is a seasonally favorable period for equity bulls. If things continue to go in their favor near term, volatility bears can hope to hit 15ish, which along with horizontal support also represents trend-line support from November 2017 when VIX (17.68) reached an all-time low of 8.56.
Thanks for reading!
