
Following futures positions of non-commercials are as of February 15, 2022.
10-year note: Currently net short 174.1k, down 27.8k.
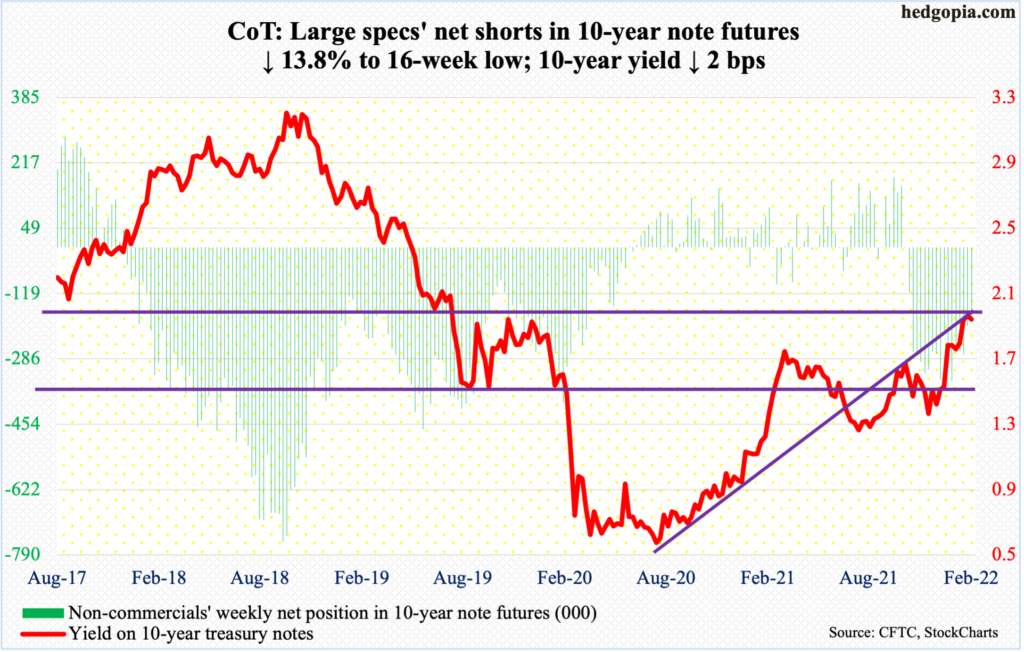
Inflation has persisted much longer and broadened to more industries than the Fed initially – and stubbornly – expected. Benchmark interest rates are still zero-bound and the central bank has still not put a complete stop to its bond-buying program.
Red-hot inflation readings have now forced several FOMC members to be in favor of an accelerated tightening cycle. Jim Bullard, St. Louis Fed president and a voting member, is prominent among them. He said this week that he would favor hiking the fed funds rate by a full percentage point over the next three meetings and that rates would need to rise above two percent to tame inflation.
At the other end of the spectrum are the likes of Neel Kashkari, president of the Minneapolis Fed and a voting member next year, who advised this week “not to overdo it.” Consumer inflation is at four-decade highs, and he is outlining a restrained approach to rate hikes. Perhaps not by coincidence, markets are readjusting their rate-hike expectations for March.
In the futures pit, traders expect up to seven 25-basis-point hikes this year. Post-January’s CPI report on the 10th, the odds of a 50-basis-point hike in next month’s meeting shot up to 94 percent but have now softened to 36 percent. Markets are aware that at the end of the day these officials will grab any pretext they get to go easy. If inflation softens, which is a likelihood as the year progresses, Bullard’s prescription may just prove to be a wishful thinking. Be that as it may, he deserves praise for showing willingness to take inflation head on.
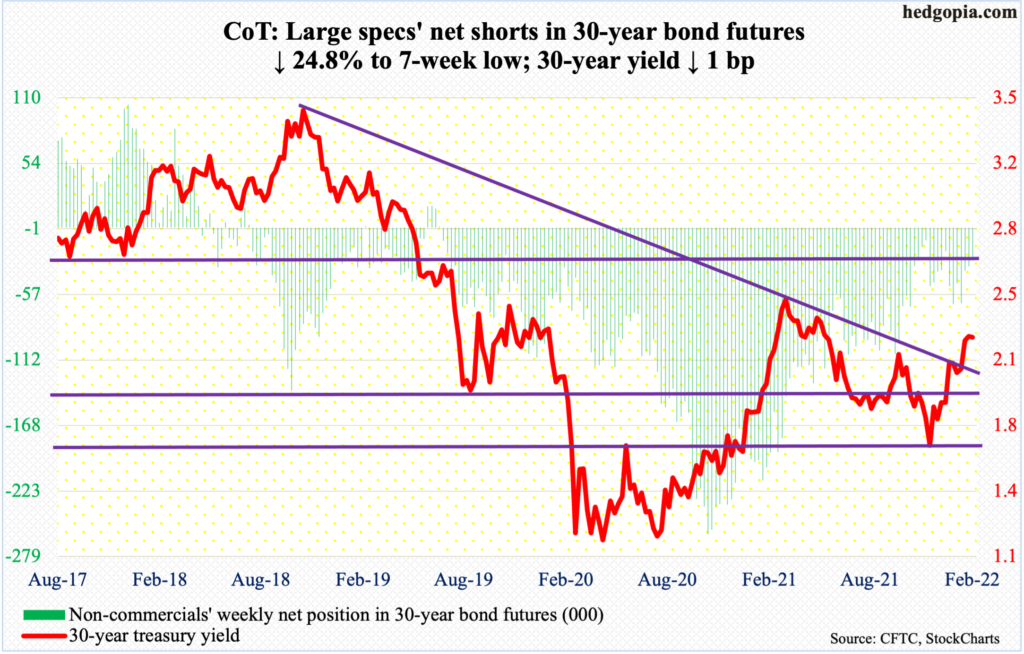
30-year bond: Currently net short 24.8k, down 8.2k.
Major economic releases for next week are as follows. Markets are closed Monday for observance of Presidents’ Day.
The S&P Case-Shiller home price index (December) is due out on Tuesday. In November, US home prices surged 18.8 percent year-over-year. Since last August’s record 20 percent appreciation, the rate of increase has softened a bit.
GDP (4Q21, 2nd print) and new home sales (January) will be published on Thursday.
The first print showed real GDP grew at an annualized rate of 6.9 percent last quarter. This was the best growth rate in five quarters.
Sales of new homes jumped 11.9 percent month-over-month in November to a seasonally adjusted annual rate of 811,000 units – a nine-month high.
Friday brings personal income/spending (January), durable goods orders (January) and the University of Michigan’s consumer sentiment index (February, final).
In December, headline and core PCE (personal consumption expenditures) each increased 0.5 percent m/m. In the 12 months to December, they respectively jumped 5.8 percent and 4.9 percent – the steepest rise since July 1982 and September 1983 respectively.
Orders for non-defense capital goods ex-aircraft – proxy for business plans for capital expenditures – edged up 0.3 percent m/m in December to $79.2 billion (SAAR), which is a new high.
Preliminarily in February, consumer sentiment tumbled 5.5 points m/m to 61.7, which was the lowest reading since October 2011.
WTI crude oil: Currently net long 345k, down 20.7k.
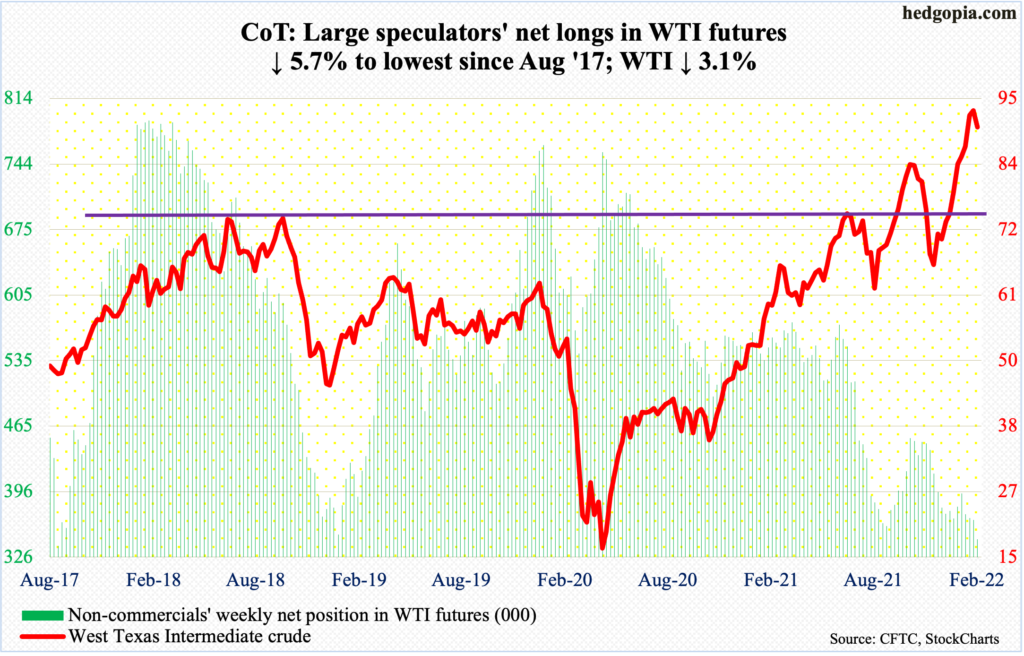
WTI ($90.21/barrel) suffered its first down week in nine, dropping 3.1 percent. The week started out well with Monday ticking $95.82 intraday, which was the highest price since September 2014. Offers then began to overwhelm bids.
As recently as December 2, the crude bottomed at $62.43, so has come a long way. Last week, the weekly RSI pushed into 70s. In at least going back to last March, each time this metric reached 70s, the crude came under pressure sooner or later.
There is room for WTI to weaken further. There is horizontal support at $85, which the crude broke out of late January.
In the meantime, US crude production in the week to February 11 was unchanged at 11.6 million barrels per day. Crude imports declined 599,000 b/d to 5.8 mb/d. As did stocks of gasoline and distillates, which were respectively down 1.3 million barrels and 1.6 million barrels to 247.1 million barrels and 120.3 million barrels. Crude inventory, however, increased 1.1 million barrels to 411.5 million barrels. Refinery utilization decreased 2.9 percentage points to 85.3 percent.
E-mini S&P 500: Currently net long 195.1k, up 17.5k.
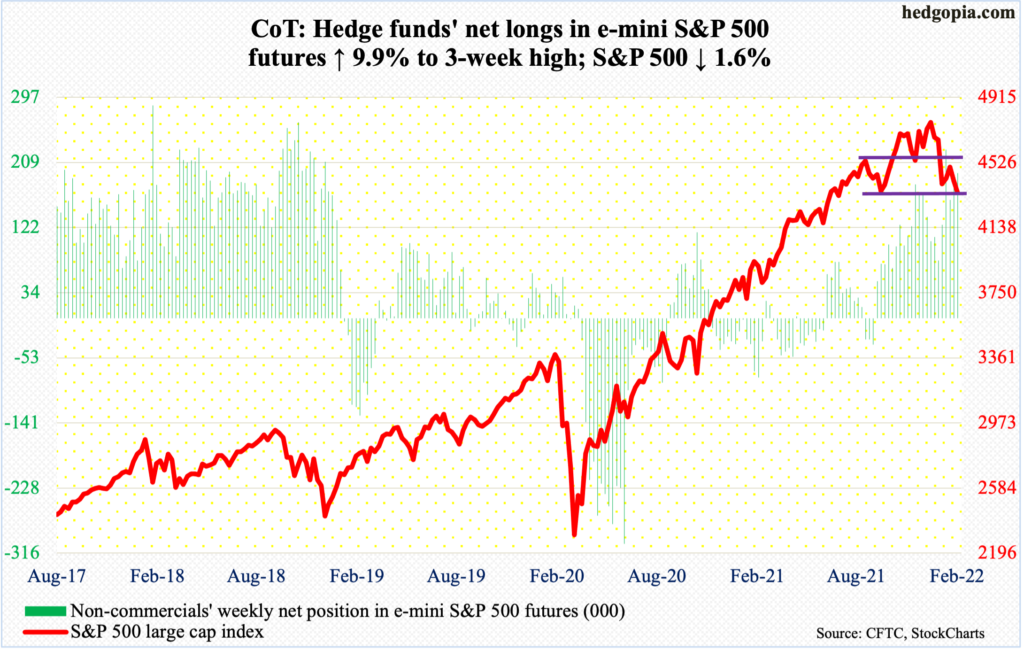
The week saw a lot of back-and-forth. Monday’s early weakness was bought. Come Tuesday and Wednesday, the S&P 500 stayed above the 200-day moving average (4458) but only to lose it again on Thursday.
At Wednesday’s high, the large cap index (4349) was up 1.6 percent and down 2.1 percent at Friday’s low, ending the week down 1.6 percent. This was the second negative week in a row.
There is room for the daily to continue lower.
Amidst this, Investors Intelligence bulls this week fell 0.4 percentage points week-over-week to 33.7 percent. This was the lowest reading since April 2020. Back then, the bulls-to-bear ratio dropped as low as 0.72 percent in March. This week, the ratio dropped to 1.21, which is not panic territory but low enough to possibly ignite some buying interest (more on this here). Nevertheless, bears this week were 27.9 percent; in comparison, they were 41.7 percent in March 2020. As things stand, bears are not panicky just yet.
Euro: Currently net long 47.6k, up 8.7k.
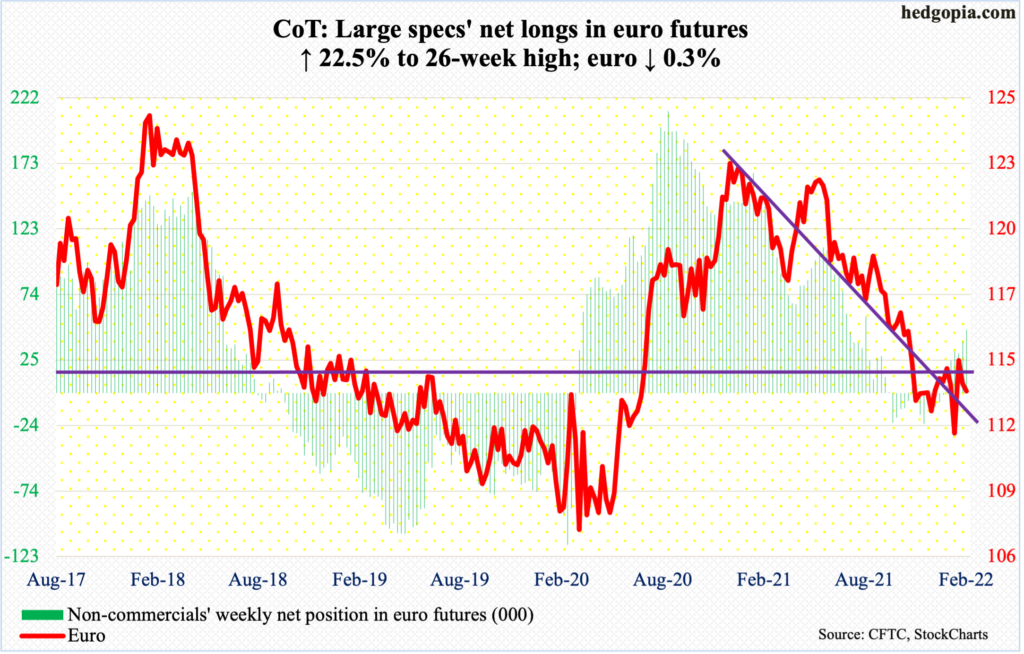
After last Thursday’s rejection just under $1.15, with a session high $1.1495, this week began with Monday’s breach of the 50-day, which was reclaimed in the very next session and lost again on Friday.
Unless euro bulls are able to break past $1.14-$1.15, which goes back at least 18 years and drew sellers mid-January and again this month, the euro ($1.1321) remains in no-man’s land.
Gold: Currently net long 213.6k, up 26.9k.
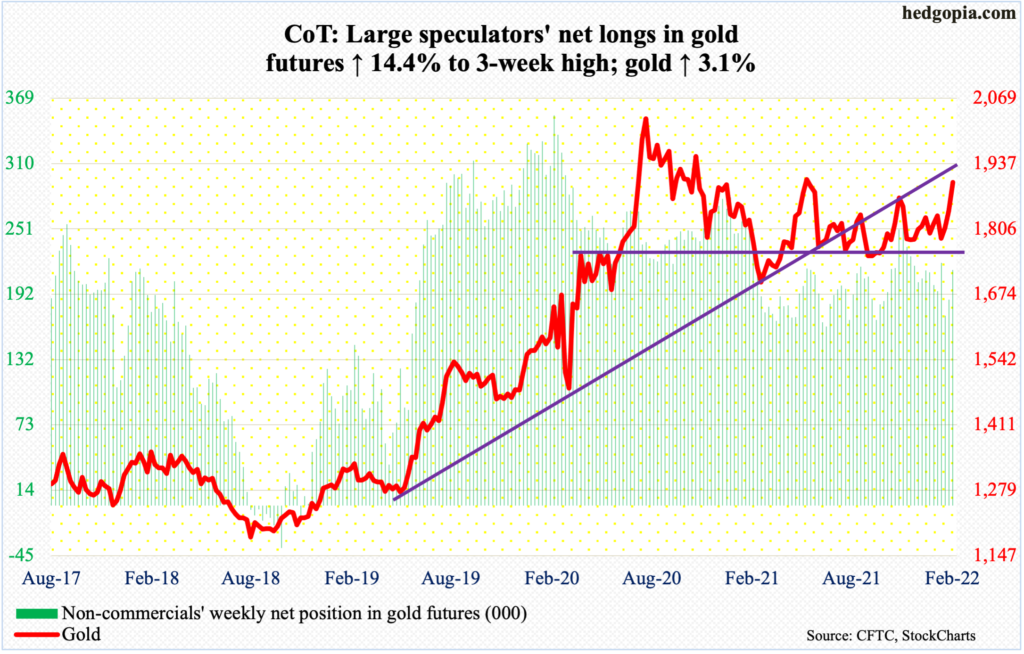
Gold regained its luster this week, rallying 3.1 percent for a higher high; mid-November (last year), the metal ($1,900/ounce) retreated after printing $1,880, which was reclaimed on Thursday. There is major resistance at $1,920s.
In September 2011, the yellow metal retreated after touching $1,924. Gold did not bottom until December 2015 when it tagged $1,045. The prior high was surpassed in July 2020, followed by a new high $2,089 in August that year. A decisive break of $1,920s opens the door toward that high.
Right here and now, momentum remains up.
Nasdaq 100 index (mini): Currently net long 9.3k, up 1.4k.
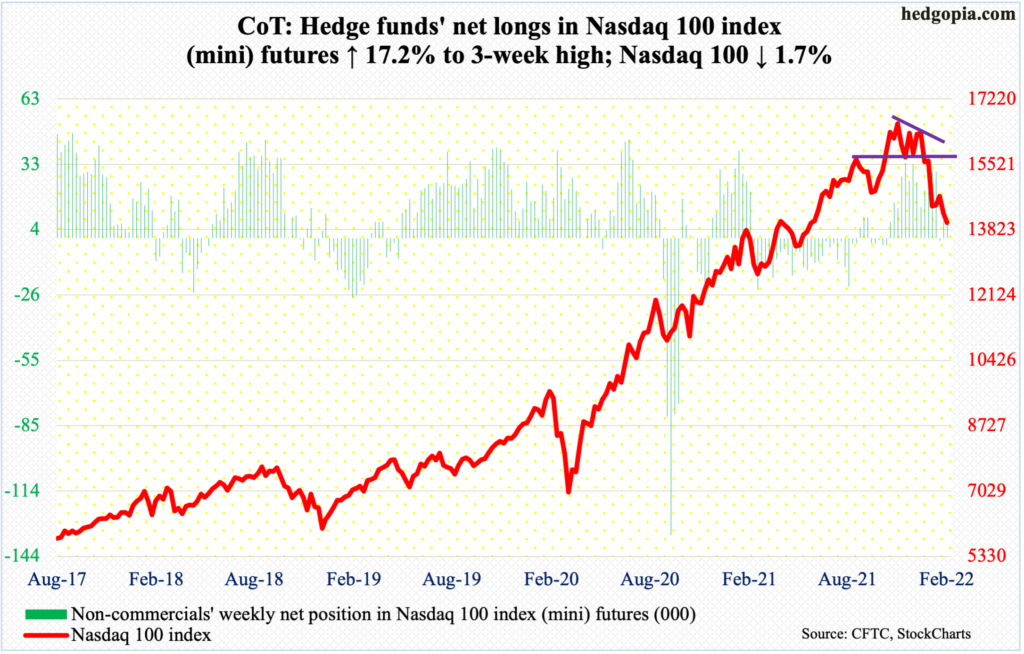
The Nasdaq 100 suffered technical damage last month and this requires time to repair.
Between the November 22 (last year) high and the January 24 low, the tech-heavy index collapsed 18.1 percent, worse than the S&P 500’s 12.4 percent drop between last month’s high and low. On the 2nd (this month), the Nasdaq 100 retraced just short of 50 percent of this decline before sellers showed up. Last week, they appeared at the 200-day.
In all probability, the 10-year yield for now has seen its highs, having tagged 2.07 percent on Wednesday and ended the week at 1.93 percent, for a back-to-back weekly shooting star. Of late, tech has tended to sell off as rates rise. If the sector fails to rally on lower rates, that will be a tell; this was the case both Thursday and Friday (more on this here).
Bulls cannot afford to lose the January 24 low of 13725. The Nasdaq 100 closed out the week at 14010.
Russell 2000 mini-index: Currently net short 31.7k, down 6k.
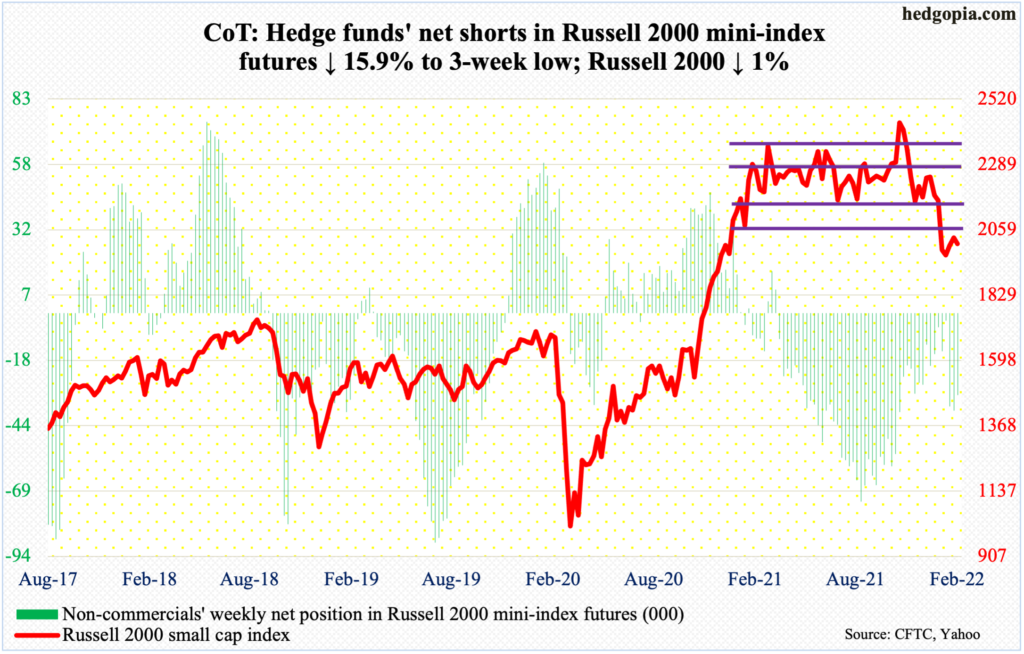
From March last year through last month, the Russell 2000 was rangebound between 2350s and 2080s, and between 2280s and 2150s within this rectangle. On Nov 3, it broke out but was quickly followed by a failed retest on the 19th (November). On the 19th last month, the small cap index fell out of the box.
Since that breakdown, there have been several back-tests, but all ended in failure, including this week. The price point where the breakdown occurred is attracting sellers. Until this changes, it remains bears’ ball to lose. Post-breakdown, the Russell 2000 (2009) dropped as low as 1901 on January 28, which has now gained in significance.
US Dollar Index: Currently net long 35.4k, up 1.6k.
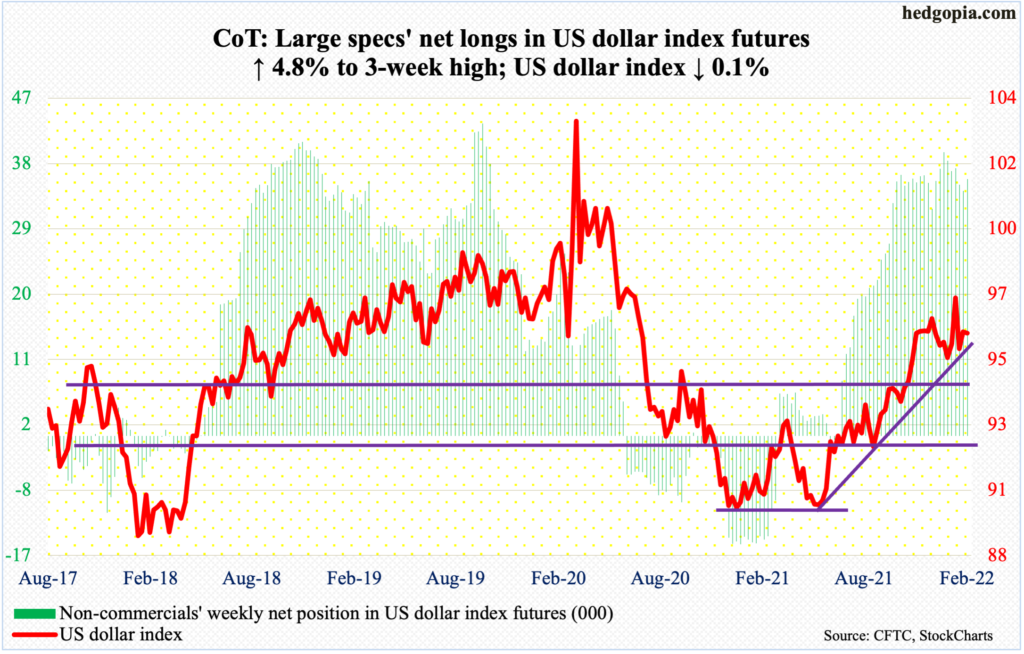
The US dollar index pretty much hugged the 50-day (95.99) all week, touching a high of 96.43 on Monday, a low of 95.67 on Wednesday and a close of 96.02. As things stand, it is in no man’s land, with dollar bulls enjoying a slight edge.
Horizontal resistance around 97 goes back at least 18 years, while there is decent horizontal support at 94.50s, which was defended mid-January. Before 94.50s is tested, there is minor support at 95.10s.
VIX: Currently net short 46.1k, up 10.9k.
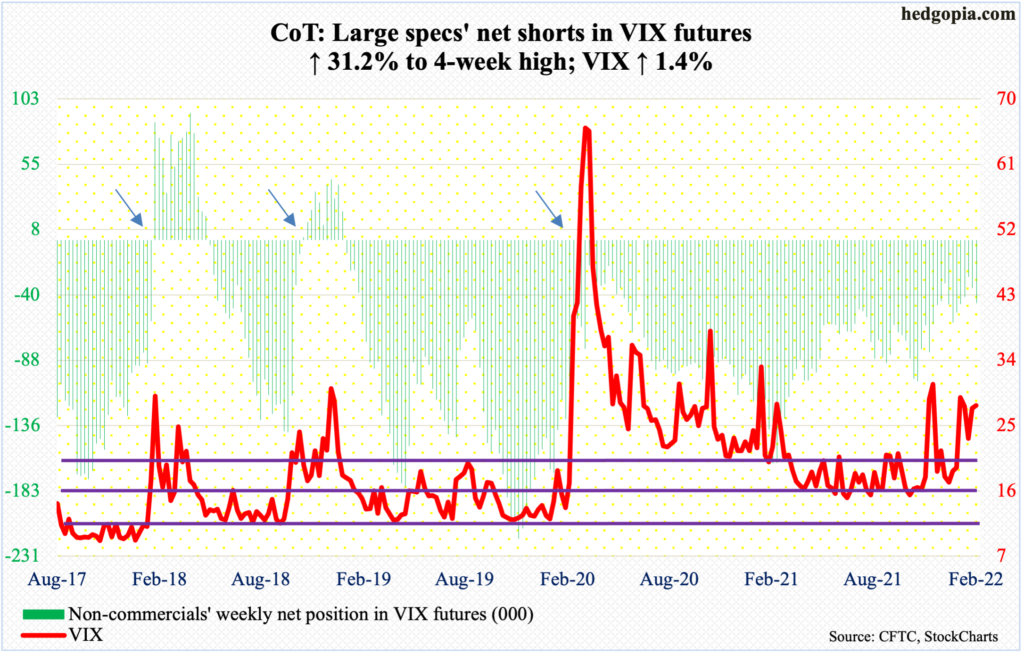
Monday’s session high 32.04 established a three-week high but at the same time remained well under last month’s high 38.94, which set a pattern of higher lows and higher highs. For this to continue, VIX needs to take out the January high. This in all probability is not going to be easy right here and now.
Since early December (last year), the volatility index has found it difficult to sustain above 32-33. That said, as long as VIX (27.75) remains above mid-20s in general and low-20s in particular, volatility bulls can remain optimistic in the medium- to long-term.
Thanks for reading!
