
Following futures positions of non-commercials are as of March 1, 2022.
10-year note: Currently net short 365.8k, up 80.7k.
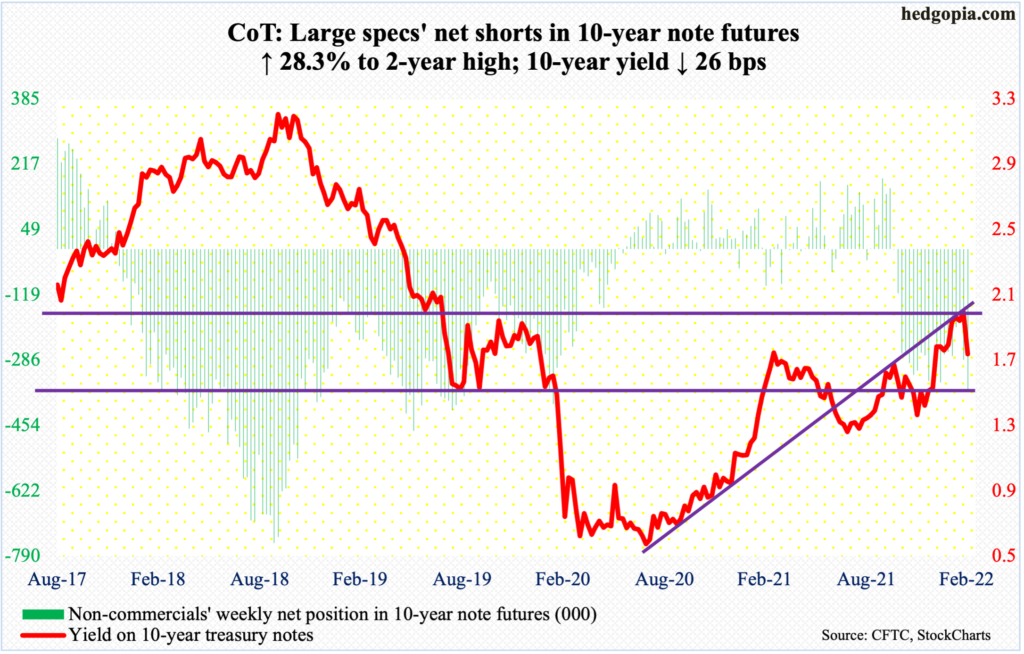
Talk about a whiplash! The 10-year treasury yield went from 2.07 percent to 1.68 percent in nine sessions. That is a nearly 40-basis-point move. The low was posted this Tuesday, breaching the 50-day moving average plus horizontal support at 1.77 percent.
The 1.77-percent level was a retest of a breakout that unfolded in January. Earlier, rates bottomed at 1.34 percent last December and 1.13 percent before that in July. On several timeframes, the 10-year remains overbought. The Federal Reserve’s hawkish switch thanks to persistently rising inflation lit a fire under rates.
Enter the new dynamics involving Vladimir Putin and Ukraine, driving commodity prices, including crude oil, soaring. This will only exacerbate the inflation situation and will for sure adversely impact global growth in the quarters to come.
Last week, the 10-year tumbled 26 basis points to 1.72 percent. Increasingly, it looks like bond bears (on price) have their backs against the wall, as these securities begin to attract bids in a new geopolitical/growth story.
Amidst this, non-commercials raised their net shorts in 10-year futures to a two-year high. In the weeks and months ahead, they in all probability will come under pressure to cover, sending rates lower. There is decent support at mid-1.40s.
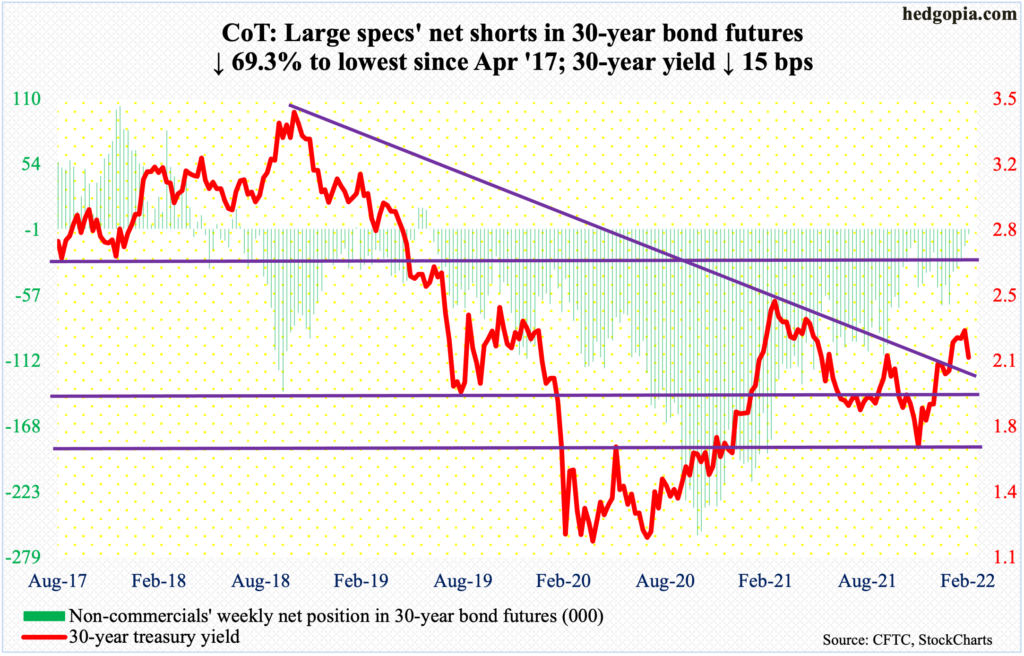
30-year bond: Currently net short 4.5k, down 10.2k.
Major economic releases for next week are as follows.
The NFIB optimism index (February) comes out on Tuesday. Small-business job openings in January fell a couple of points month-over-month to 47. The metric peaked at 51 last September.
Job openings (JOLTs, January) is scheduled for Wednesday. In December, non-farm openings increased 150,000 m/m to 10.9 million, which is just slightly shy of last July’s record 11.1 million.
Thursday brings the consumer price index (February) and the Z.1 report (4Q21).
Headline and core CPI rose 0.6 percent m/m in January. In the 12 months to January, they respectively jumped 7.5 percent and six percent.
In 3Q21, US households’ equity allocation dropped four-tenths of a percentage point from record 37.8 percent in the prior quarter and in all probability posted a new record in 4Q. In the last quarter, the S&P 500 rallied 10.6 percent.
The University of Michigan’s consumer sentiment index (March, preliminary) will be published on Friday. Consumer sentiment tumbled 4.4 points m/m in February to 62.8. This was the lowest reading since October 2011.
WTI crude oil: Currently net long 367.7k, up 31.8k.
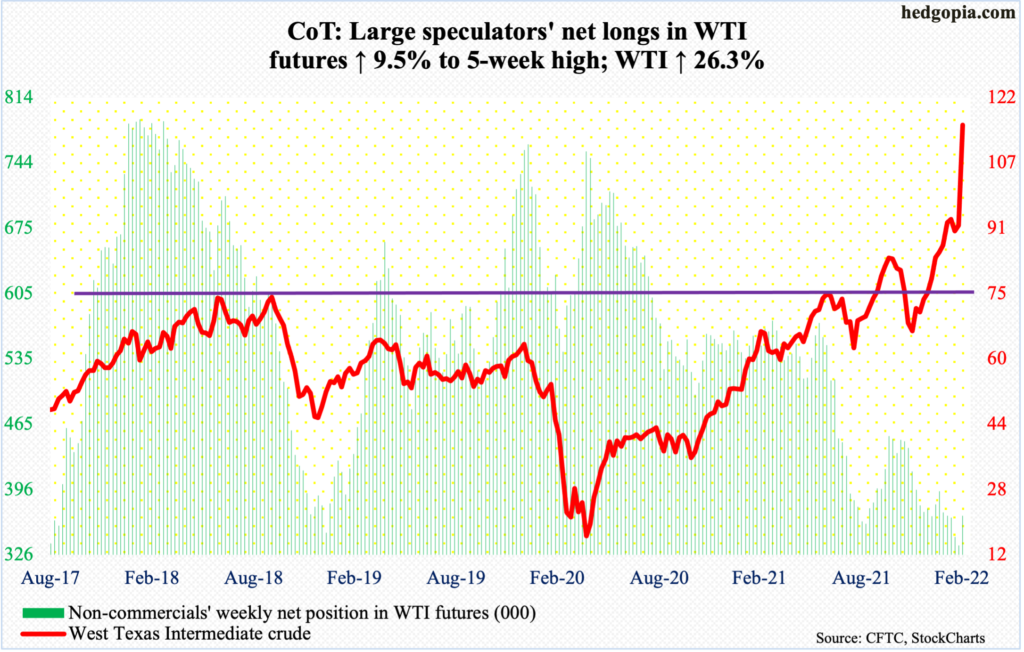
WTI ($115.68/barrel) surged 26.3 percent this week and was up as much as 27.3 percent at Thursday’s high $116.57, which was the highest price since September 2008.
This week’s gains followed an intraday drop to $87.46 on February 18, which essentially tested horizontal support at $85. The rest was taken care of by a spike in bullish sentiment on the back of what is transpiring in Ukraine.
Such parabolic moves do not last. At the same time, given the momentum, it is not even worth guessing when they will stop going up.
Incidentally, the monthly RSI just entered overbought territory, with Friday closing at 73.2. This was the first time since April 2011, when the metric briefly crossed 70, and particularly July 2008 before that. Both those occasions preceded a meaningful decline in the crude.
In the meantime, for the fourth straight week, US crude production in the week to February 25 remained unchanged at 11.6 million barrels per day. Crude imports fell 1.1 mb/d to 5.8 mb/d. As did inventory of crude, gasoline, and distillates, which respectively dropped 2.6 million barrels, 468,000 barrels and 574,000 barrels to 413.4 million barrels, 246 million barrels and 119.1 million barrels. Refinery utilization inched up three-tenths of a percentage point to 87.7 percent.
E-mini S&P 500: Currently net long 161k, down 75.4k.

Investors Intelligence bulls continued to pull in their horns this week, down 2.3 percentage points week-over-week to 29.9 percent, which is lower than the March 2020 low of 30.1 percent; bears rose 3.5 percentage points w/w to 34.5 percent, which is not as bad as the panicky 41.7 percent reading back then. The bulls-to-bears ratio, as a result, went sub-one, to 0.87, this week, which is gross oversold territory (chart here). Similarly, an average of Investors Intelligence bulls, AAII bulls and the NAAIM Exposure Index fell to the lowest since March 2020 this week (chart here).
In ordinary circumstances, sentiment is low enough to ignite at least a reflex rally. At the same time, Ukraine-related headline risks remain, and this is causing a lot of whiplash. This week’s range was Thursday’s 4417 and Tuesday’s 4280, with a close at 4329.
Bulls can take solace in the fact that the index was down 1.8 percent at Friday’s low but recovered to end the session down 0.8 percent, for a hammer.
The 200-day lies at 4466 and the 50-day at 4530, with the latter approximating a 61.8-percent Fibonacci retracement of the January 4-February 24, 14.6-percent decline at 4550.
Euro: Currently net long 64.9k, up 5.6k.
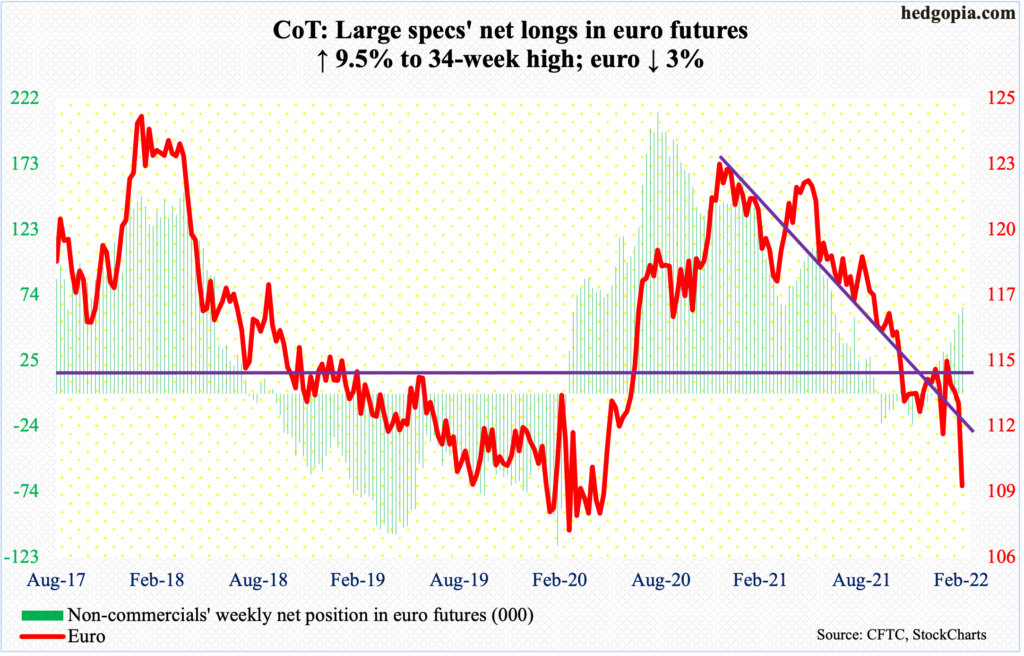
Euro bulls could no longer hold back the amount of sell orders that came their way this week. The currency gave back three percent – its fourth straight down week and sixth in the last seven.
The pattern of lower highs/lower lows continued this week, with Friday breaking down to tag $108.86, closing at $109.34.
The euro has been in a downtrend since peaking at $1.2345 last January.
The daily is oversold, so a rally can always occur. But until the downward momentum ends, it remains euro bears’ ball to lose. Immediately ahead, there is gap-down resistance at $110.30s.
Gold: Currently net long 257.6k, up 14.5k.
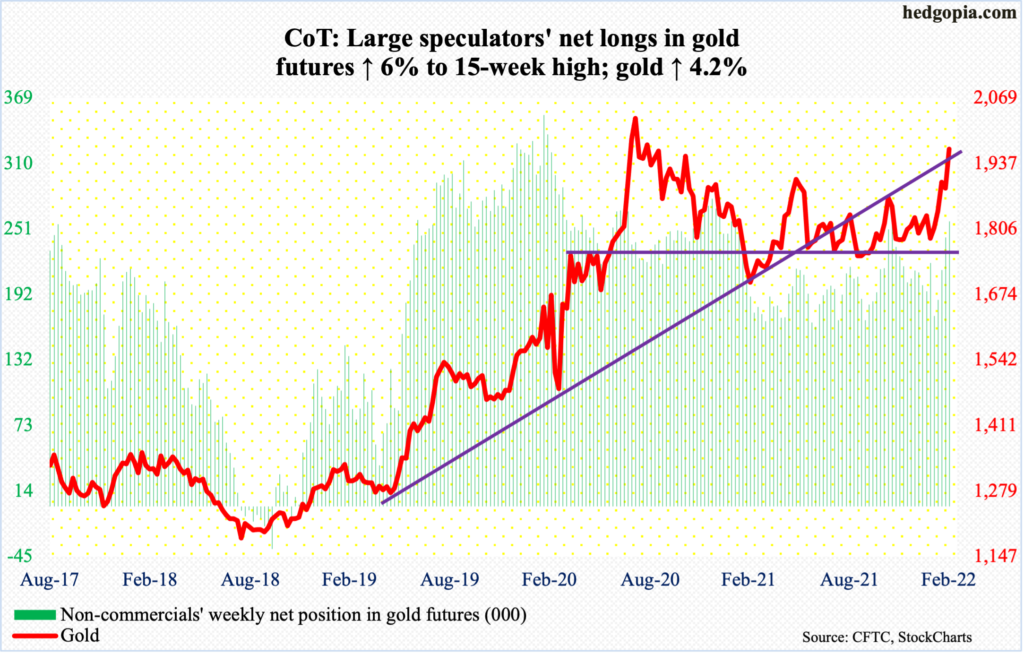
In September 2011, gold retreated after touching $1,924. The metal did not bottom until December 2015 when it tagged $1,045. The prior high was surpassed in July 2020, followed by a new high $2,089 in August that year. A decisive break of $1,920s would have opened the door toward that high.
After several tries going back to 2020, gold bugs finally achieved that feat this week, rallying the yellow metal 4.2 percent this week and closing at $1,967. The path higher becomes much easier once $2,000 gives way.
Non-commercials increasingly are getting bulled up and have been on the right side of this trade thus far.
Nasdaq 100 index (mini): Currently net long 12.1k, down 1.8k.

The Nasdaq 100 tried to build on last week’s hammer reversal, but bears kept up the selling pressure. At Thursday’s high, the tech-heavy index was up 1.1 percent for the week but only to reverse and close down 1.6 percent; bears defended the 20-day in that session. The next day, they showed up at the 10-day.
The index (13838) dropped 22.1 percent between the November 2021 high (16765) and the February 24 low (13065). During this decline, several support zones have been breached. This requires time to repair.
On Thursday, bulls unsuccessfully tried to take out a falling trend line from early January. This now gets tested at 14200. This is the one to watch for now.
Russell 2000 mini-index: Currently net short 29.6k, up 3.5k.
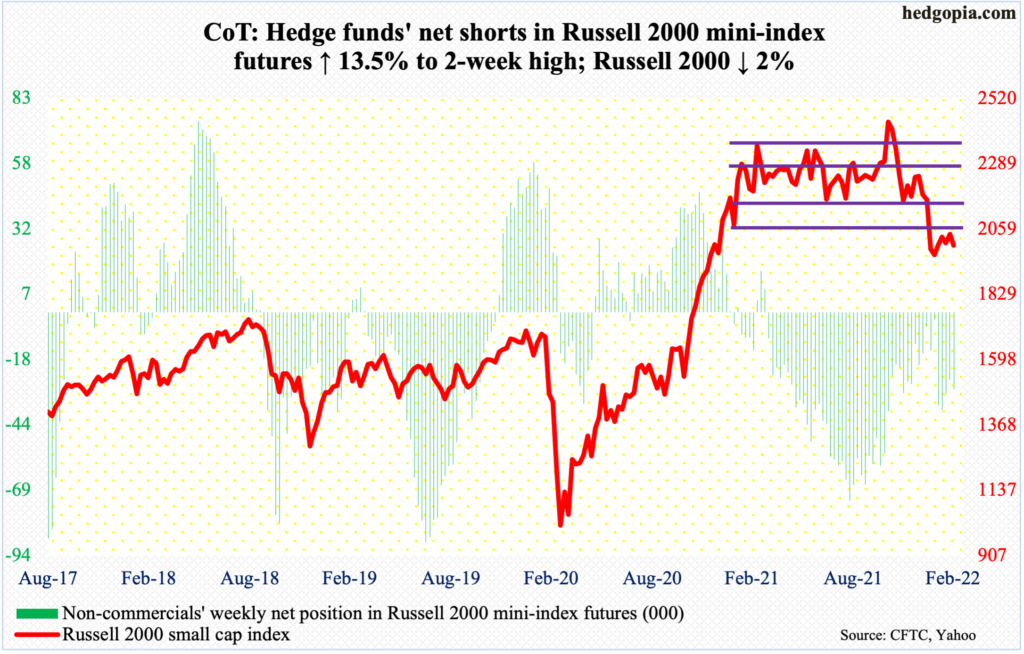
Small-caps may be beginning to generate some interest.
From the November 2021 high of 2459 through the February 24 low of 1895, the Russell 2000 tumbled 23 percent. Last month’s low was a lower low versus January’s, but small-cap bulls are probably not unhappy with the action since.
In the first four sessions this week, the small cap index rallied to 2050s and 2060s, which was just slightly below resistance at 2080s.
From March last year through last month, the Russell 2000 was rangebound between 2350s and 2080s, and between 2280s and 2150s within this rectangle. On Nov 3, it broke out but was quickly followed by a failed retest on the 19th (November), followed by a range breakdown last month.
Recapturing 2080s will be the first step toward repairing the damage the index (2001) has suffered the last several months.
US Dollar Index: Currently net long 34.8k, down 1.3k.
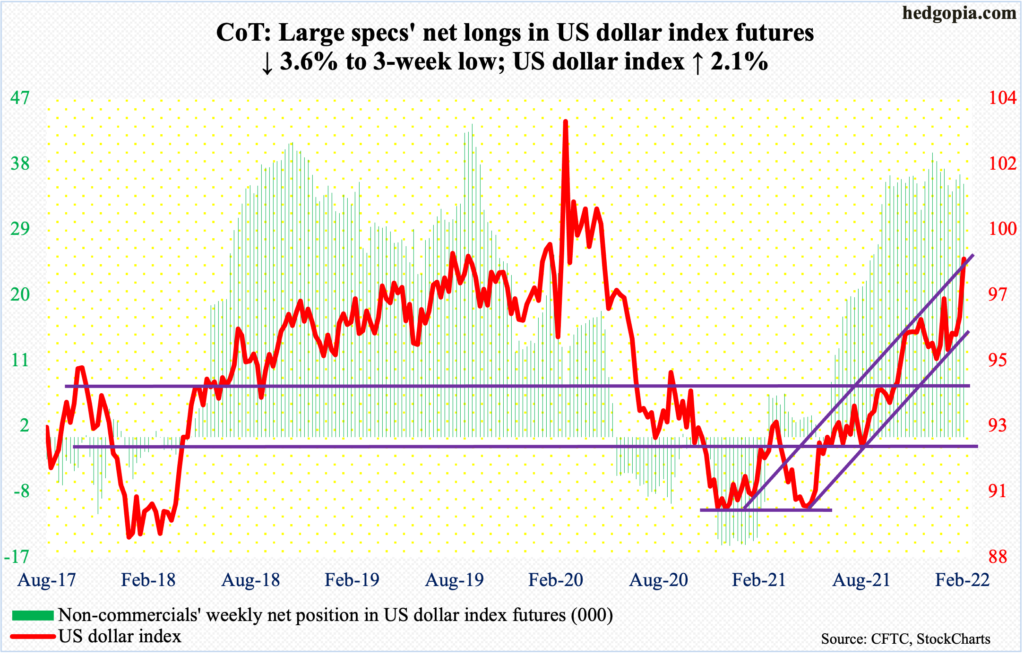
Dollar bulls defended 96.50s early this week to rally the US dollar index past the February 24 high of 97.74. On Friday, it ticked 98.94, which was the highest since May 2020, closing the session at 98.67.
The index has trended higher since last May when it bottomed at 89.51. The upper bound of a rising channel from that low lies around here. Shorts could look for opportunities to get active.
VIX: Currently net short 54.7k, up 9.1k.
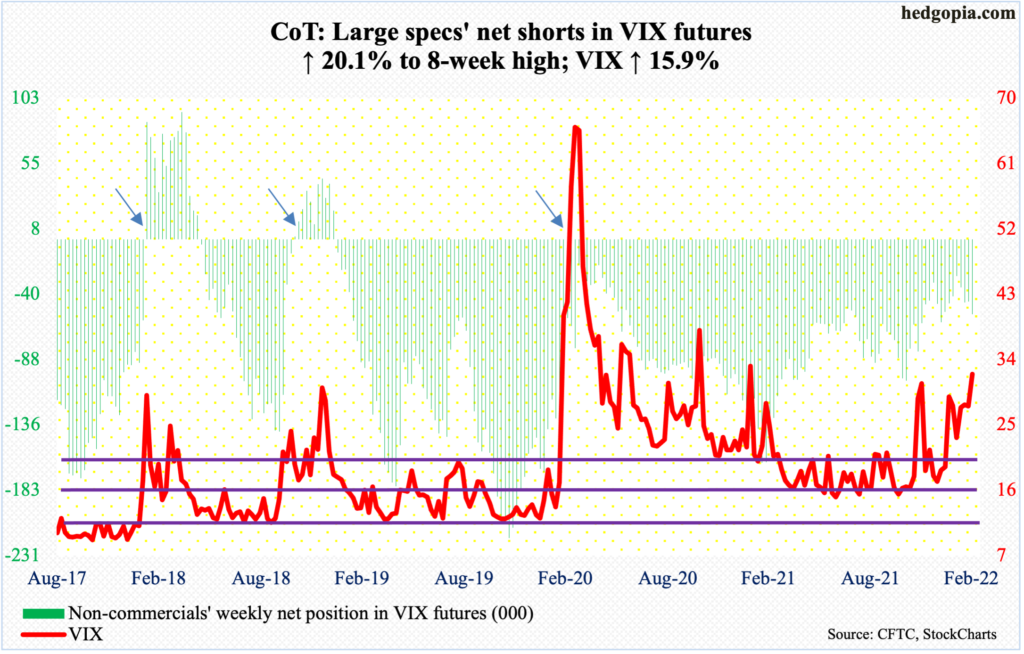
Last week, VIX posted a lower high of 37.79 versus January’s 38.94. This week, the volatility index touched 35.19 on Tuesday before heading lower; Thursday’s long-legged doji was followed by Friday’s gravestone doji.
Since early December (last year), VIX (31.98) has found it difficult to sustain above 32-33. They have had a few opportunities to do so, but volatility bulls have failed to deliver.
Right here and now, the daily is itching to head lower. There is support at mid-20s, and low-20s after that. In this scenario, the ratio of VIX to VXV comes under pressure to unwind its overbought condition (more on this here).
Thanks for reading!
