
Following futures positions of non-commercials are as of March 22, 2022.
10-year note: Currently net short 263.8k, down 57.2k.
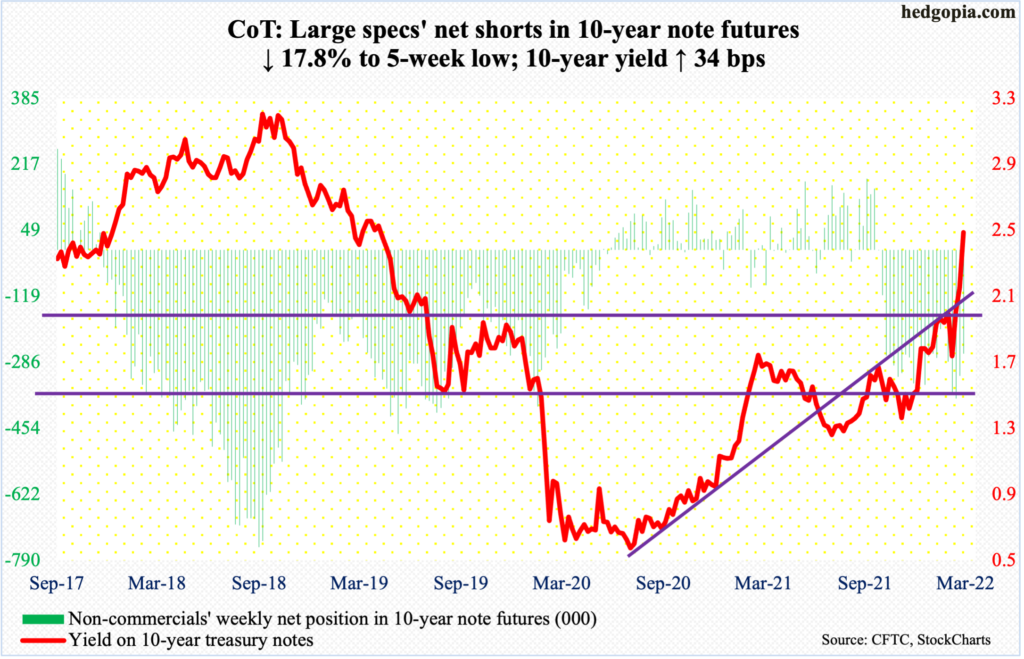
At last, Jerome Powell seems to have gotten religion. Or so it seems. On Monday, the Federal Reserve chair delivered very hawkish comments as per his plan to slow rampaging inflation. This was a 360 from last Wednesday when the Fed raised the fed funds rate by 25 basis points and also said it would announce a plan to shrink its pool of assets in the next meeting, which falls on May 3-4; the dot plot signaled six more hikes this year – essentially one each in the remaining six scheduled meetings – but no 50-basis-point hike was telegraphed.
This changed this week. Powell on Monday sounded much more hawkish than he did last Wednesday. He said that the central bank, if necessary, would be open to raising rates by a half-point at multiple FOMC meetings, adding that it could get “restrictive” to slow economic growth and possibly raise the unemployment rate to tame high inflation. This is Paul Volcker talk. Let us hope he delivers. Given the prevailing four-decade-high consumer inflation, odds are rising that he will be put to a test.
It will be a genuine test since the yield curve is beginning to foretell growth deceleration. Housing, in fact, looks vulnerable (more on this here). On Friday, the spread between 10- and two-year treasury notes ended at 18 basis points. Inversion is not that far away (more on this here). But other spreads are not as definitive. The spread between 10-year notes and three-month bills has in fact widened since the start of the month, ending the week at 193 basis points; if Powell channels Volcker in the months ahead, it is only a matter of time before this spread stops diverging and joins its 10s/2s cousin. Fingers crossed!
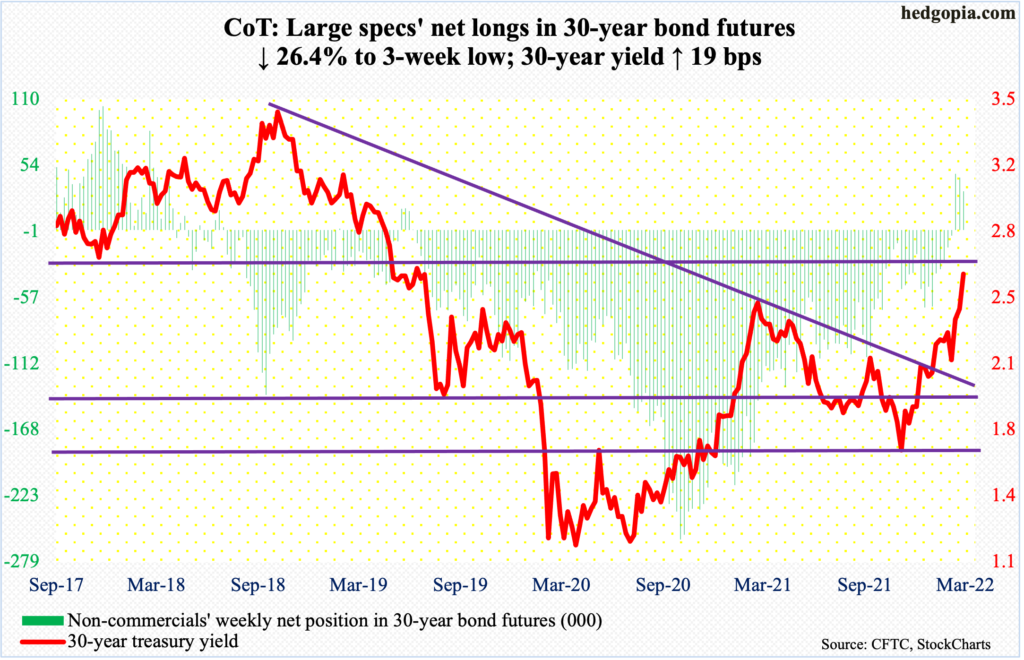
30-year bond: Currently net long 32.6k, down 11.7k.
Major economic releases for next week are as follows.
The S&P Case-Shiller home price index (January) and job openings (JOLTs, February) are due out Tuesday.
Nationally, US home prices surged 18.8 percent in December from a year ago. The pace is slightly off last August’s 20-percent record pace.
Non-farm job openings dropped 185,000 month-over-month in January to 11.3 million. December’s 11.4 million was a record.
Wednesday brings GDP (4Q21, third and final print) and corporate profits (4Q21).
The second estimate showed real GDP surged seven percent in 4Q21, which is the best showing in five quarters.
Corporate profits with inventory valuation and capital consumption adjustments jumped 19.7 percent year-over-year to a seasonally adjusted annual rate of $2.92 trillion – a fresh record.
Personal income/spending (February) is scheduled for Thursday. In January, headline and core PCE (personal consumption expenditures) jumped 6.1 percent and 5.2 percent respectively – the steepest pace since February 1982 and April 1983.
Non-farm payrolls (March) and the ISM manufacturing index (March) will be out Friday.
In February, 678,000 non-farm jobs were created, for a monthly average so far this year of 580,000, which is better than last year’s monthly average of 562,000.
Manufacturing activity rose a point m/m in February to 58.6. This was the third straight sub-60 reading, following three 60-plus readings in a row.
WTI crude oil: Currently net long 354.5k, down 3.9k.
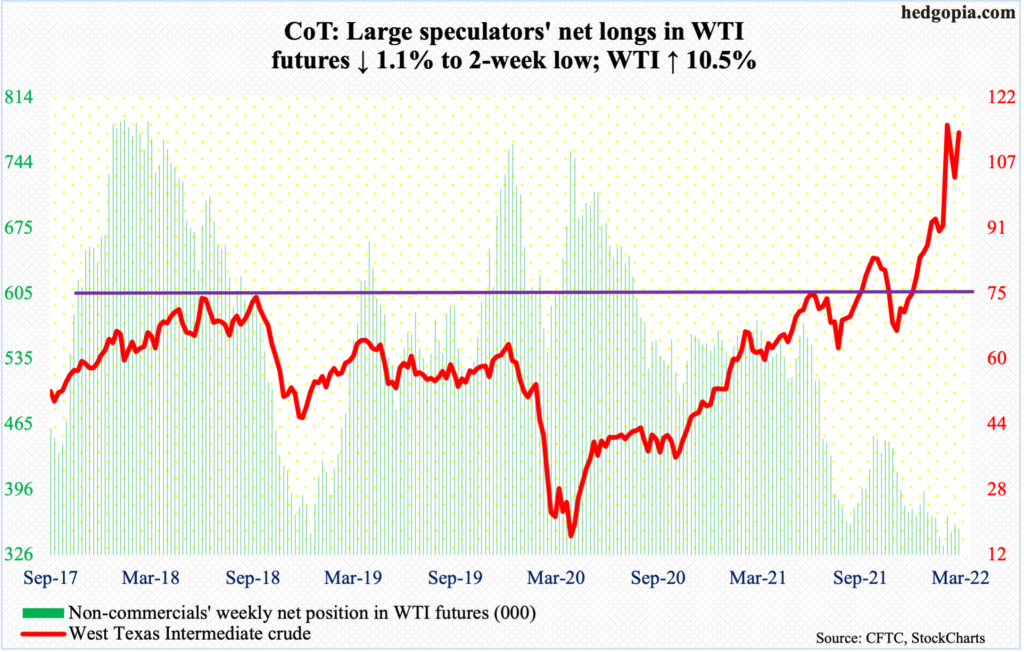
After last week’s successful defense of the 50-day moving average, WTI ($113.90/barrel) this week rallied 10.5 percent. This came after two consecutive down weeks.
Between the December 2 (last year) low and the March 7 high intraday, WTI surged 109 percent, to $130.50. From that high through March 17, the crude shed 28.4 percent. This week, the crude rallied as high as $116.64, which was Thursday.
For now, it is trapped between this month’s high and low. A breach of $93-$94 can open the door toward $85 and then the 200-day at $80.
In the meantime, for the seventh straight week through the 18th, US crude production remained unchanged at 11.6 million barrels per day. Crude imports rose 91,000 b/d to 6.5 mb/d. Inventory was down, with stocks of crude, gasoline and distillates dropping 2.5 million barrels, 2.9 million barrels and 2.1 million barrels to 413.4 million barrels, 238 million barrels and 112.1 million barrels respectively. Refinery utilization increased seven-tenths of a percentage point to 91.1 percent.
E-mini S&P 500: Currently net short 54.2k, up 156.4k.
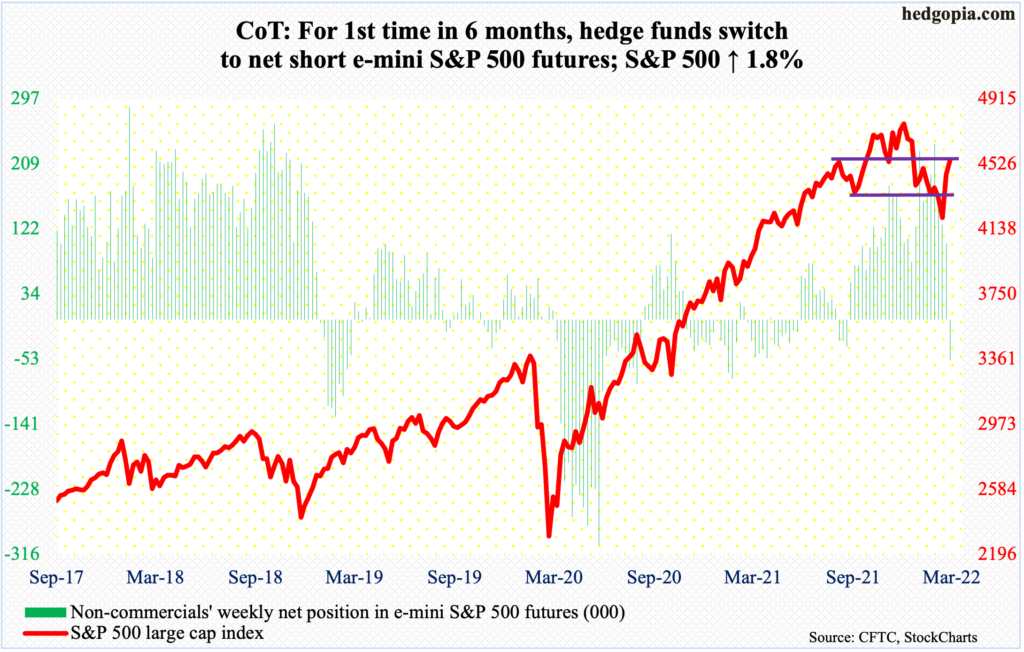
In the first four sessions this week, bulls and bears sought to stick to their ground around the 200-day; in the end, the former won it out with a weekly gain of 1.8 percent. At 4543, the S&P 500 essentially ended the week right at dual resistance at 4550s. Horizontal resistance at that level goes back to last August.
Then, there is the golden ratio resistance. Through the February 24 low of 4115 from its record high of 4819 posted on January 4, the large cap index declined 14.6 percent. A 61.8-percent Fibonacci retracement of that drop lies at 4550. This level can attract shorts. If longs can withstand the potential offers, shorts will eventually end up helping them.
At least that is likely the bulls’ line of thinking as things stand. In the week to Wednesday, they sent $11.3 billion into US-based equity funds (courtesy of Lipper), even as SPY (SPDR S&P 500 ETF), VOO (Vanguard S&P 500 ETF) and IVV (iShares Core S&P 500 ETF) took in $5.7 billion (courtesy of ETF.com).
As the S&P 500 approaches the dual resistance, non-commercials leaned bearish this week, swinging from 102,201 net longs last week to 54,168 net shorts this week.
Euro: Currently net long 23.8k, up 5k.
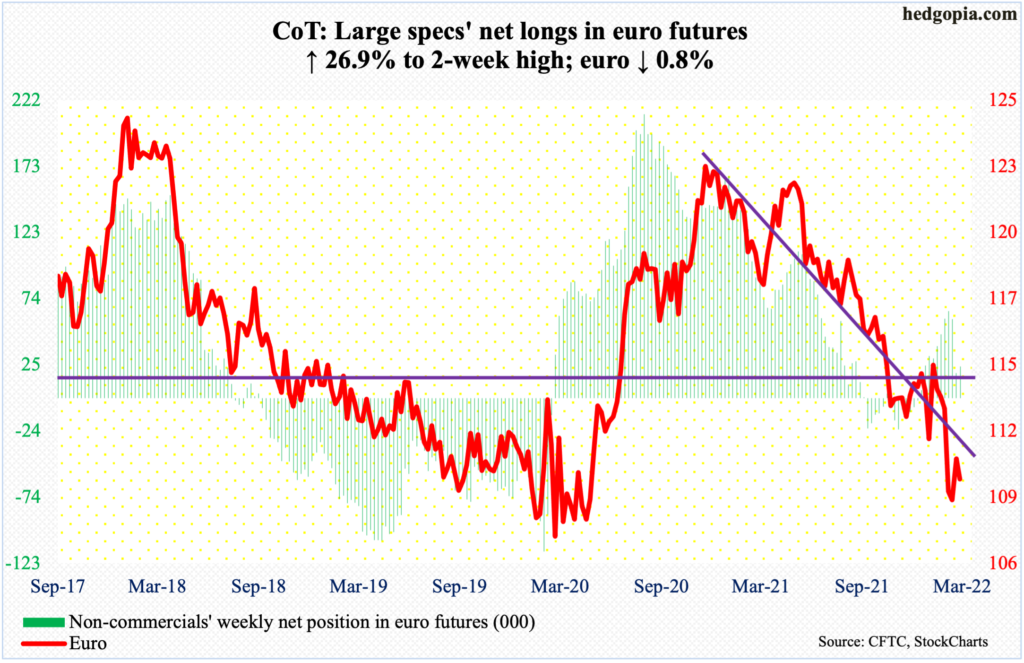
The intraday low of $108.45 on the 7th was a successful test of a rising trend line from January 2017 when the euro ($109.84) bottomed at $103.41. That low is intact; at the same time, bulls have struggled to build on that test.
On the 17th, the currency ticked $111.39 before coming under slight pressure. There is crucial resistance just under $112. For now, the euro is stuck between that resistance and this month’s low, with a downward bias immediately ahead.
Gold: Currently net long 248k, down 13.8k.
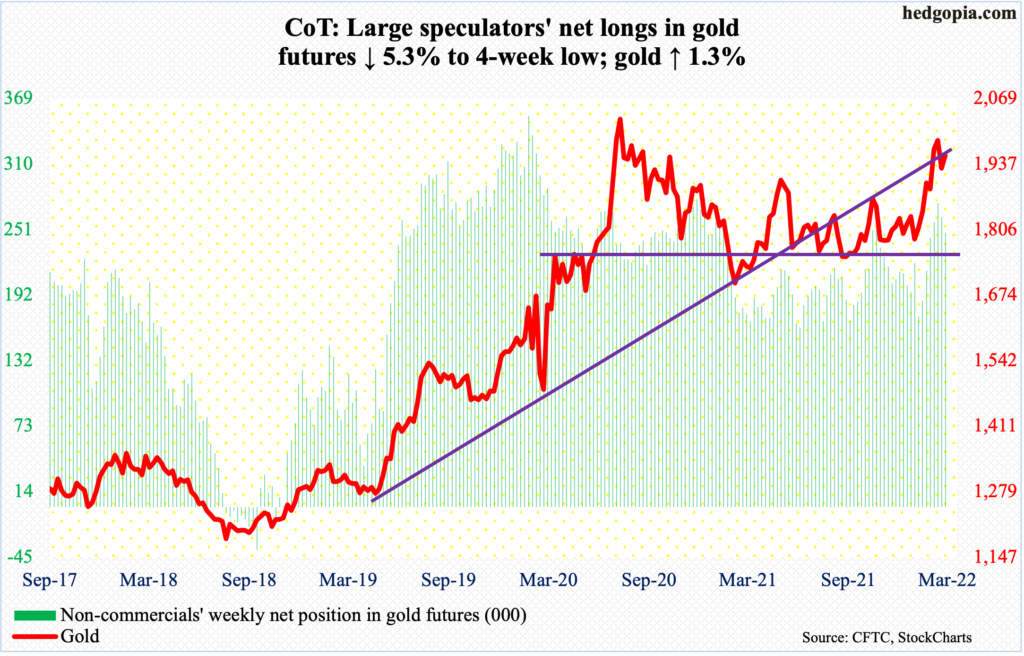
Gold bugs have so far defended February’s crucial breakout.
In September 2011, gold retreated after touching $1,924. Subsequently, the metal bottomed in December 2015 at $1,045. That high was not surpassed until July 2020, followed by a new all-time high of $2,089 a month later.
Fast forward to early this month, bulls reclaimed $1,920s. By the 8th, they were less than $11 short of the August 2020 high, before unraveling quickly. But gold bugs stepped up in defense of $1,920s both this week and last. Thus far, this has been a successful retest. Gold closed at $1,954.
Right here and now, there is room for the daily to continue higher.
Nasdaq 100 index (mini): Currently net long 2.8k, down 16.2k.
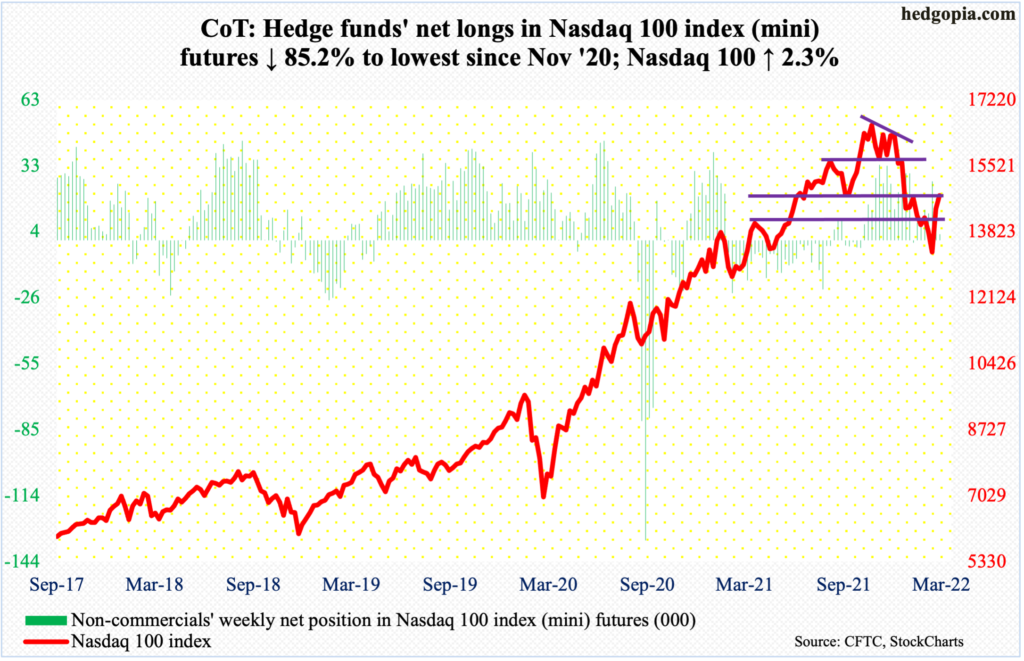
The Nasdaq 100 closed above the 50-day (14327) on Tuesday and stayed north of the average since. This week’s 2.3-percent rally followed last week’s 8.4-percent jump. This materialized after the tech-heavy index ticked 13020 on March 14 to successfully test the February 24 low of 13065.
The 200-day is at 15121. Bulls hope this acts as a magnet for now. The average also approximates horizontal resistance at 15100s. The index closed last Friday at 14754.
Russell 2000 mini-index: Currently net short 47.5k, down 16.4k.
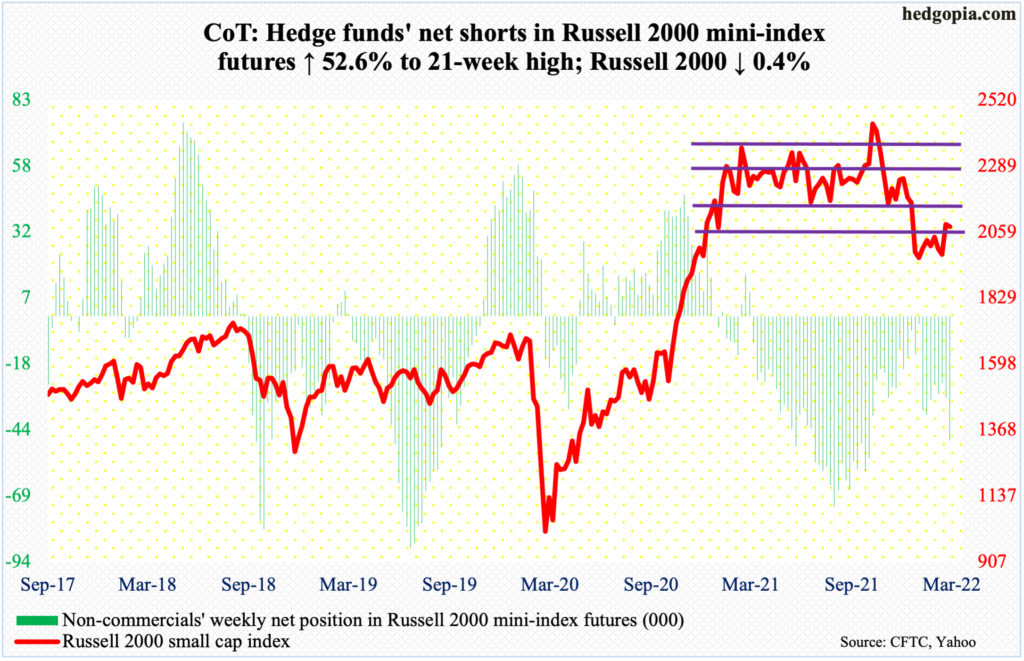
Small-cap bulls kept hammering on the bottom range of a broken rectangle, but to no avail.
From last March through January, the Russell 2000 went back and forth between 2350s and 2080s, and between 2280s and 2150s within this box. On Nov 3, it broke out but was quickly followed by a failed retest on the 19th (November). Soon followed a range breakdown in January; selling stopped near 1900, with a possible double bottom in late January and late February. But a backtest of the range breakdown has consistently failed, including this week.
As things stand, 2080s is a make-or-break. The small cap index ended the week at 2078, down 0.4 percent.
US Dollar Index: Currently net long 29.6k, up 1.3k.
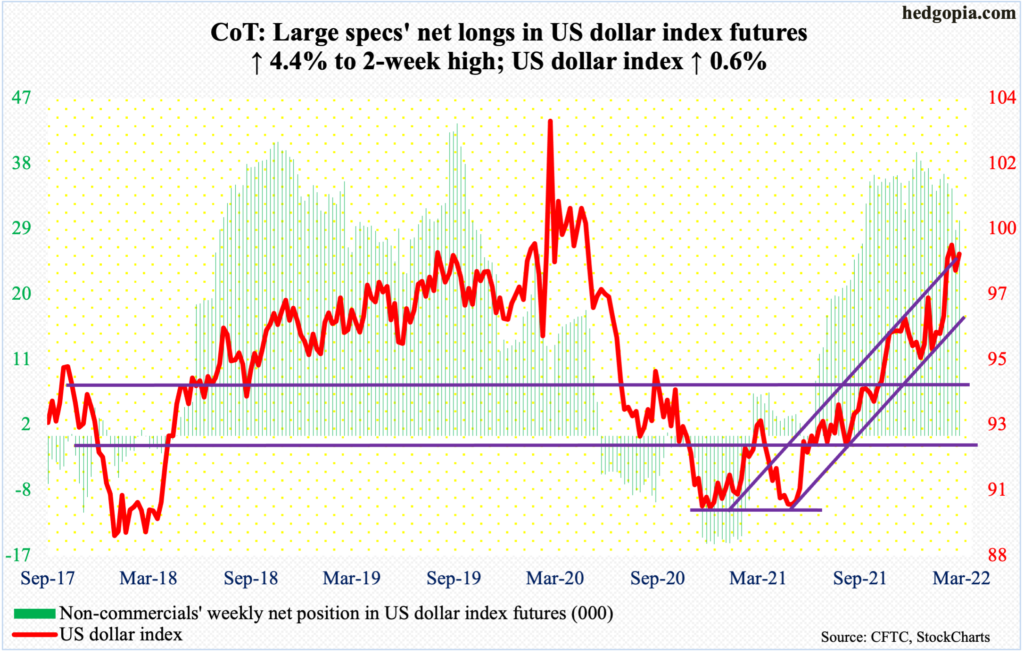
On March 7, the US dollar index ticked 99.42, which was the highest print since May 2020. From that high, it spent the last three weeks with lower highs. Down below, bids showed up at 97.70s. As a result, a descending triangle has formed. This pattern in general tends to resolve to the downside.
Concurrently, the dollar index is also attracting offers at the upper bound of an ascending channel. From last May, it has trended higher after bottoming at 89.51. The 99.42 high three weeks ago was a test of the upper bound.
The index closed the week at 98.82, up 0.6 percent. For now, 97.70s is of importance.
VIX: Currently net short 58.4k, up 10.6k.
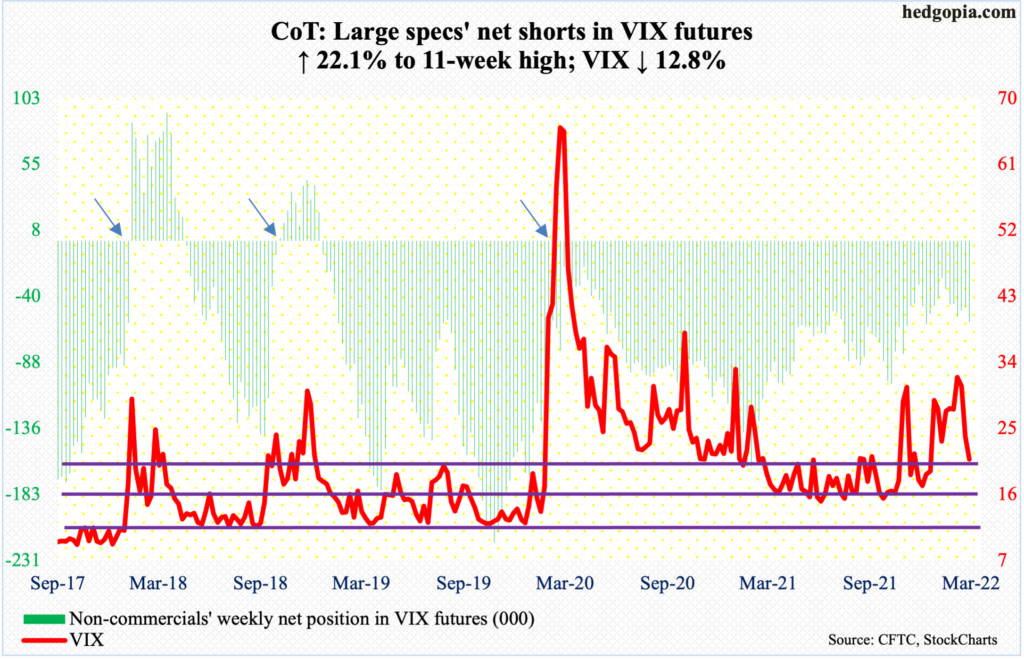
VIX essentially closed out the week at the 200-day (20.67). Down 3.06 points for the week, it closed at 20.81. The volatility index has been above the average for two and a half months now.
The downward pressure this week cost VIX a rising trend line from early January. Hence the significance of the 200-day, which also approximates horizontal support at low-20s. Volatility bulls should be able to hold the line.
Thanks for reading!
