
Following futures positions of non-commercials are as of May 31, 2022.
10-year note: Currently net short 238.9k, up 13.8k.
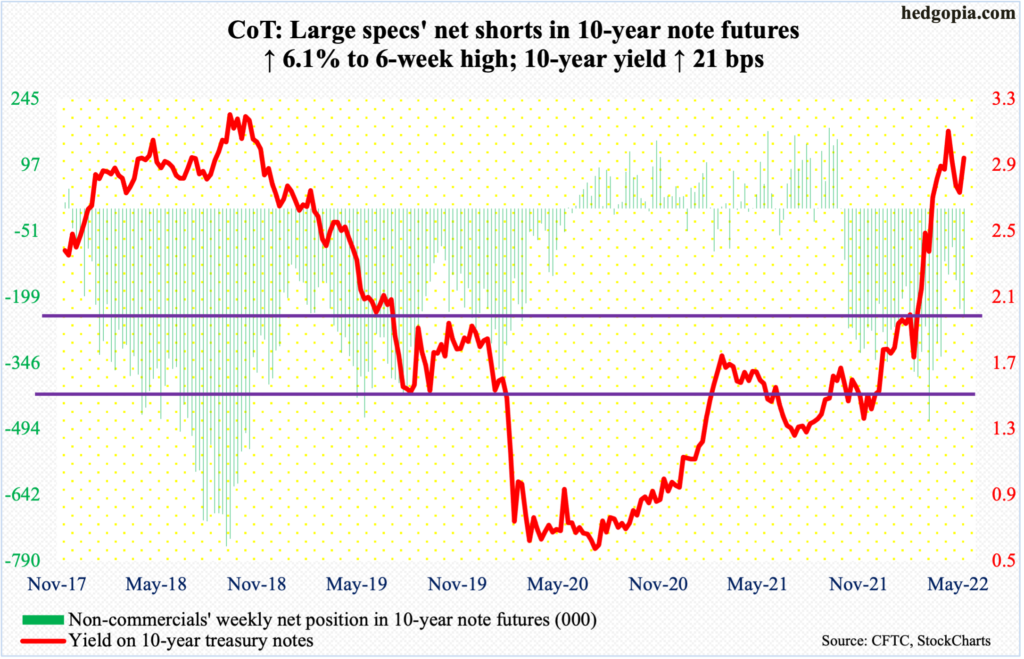
Bond bears (on price) defended the 50-day moving average on the 10-year treasury rate. It tagged 3.17 percent on May 9 before turning down. This preceded a massive rally from 1.13 percent only last August.
Last month’s high was a test of the highs back in October-November 2018 when the 10-year retreated hard after touching 3.24s; this could very well turn out to be a major reversal. Time will tell.
If rates manage to rally back to last month’s high, its behavior there will leave behind a lot of clues. There is this scenario in play as well. The 10-year closed last Friday at 2.96 percent. This can potentially form the right shoulder of a head-and-shoulders formation, where the neckline lies around 2.72 percent, which, if broken, will be bearish for rates.
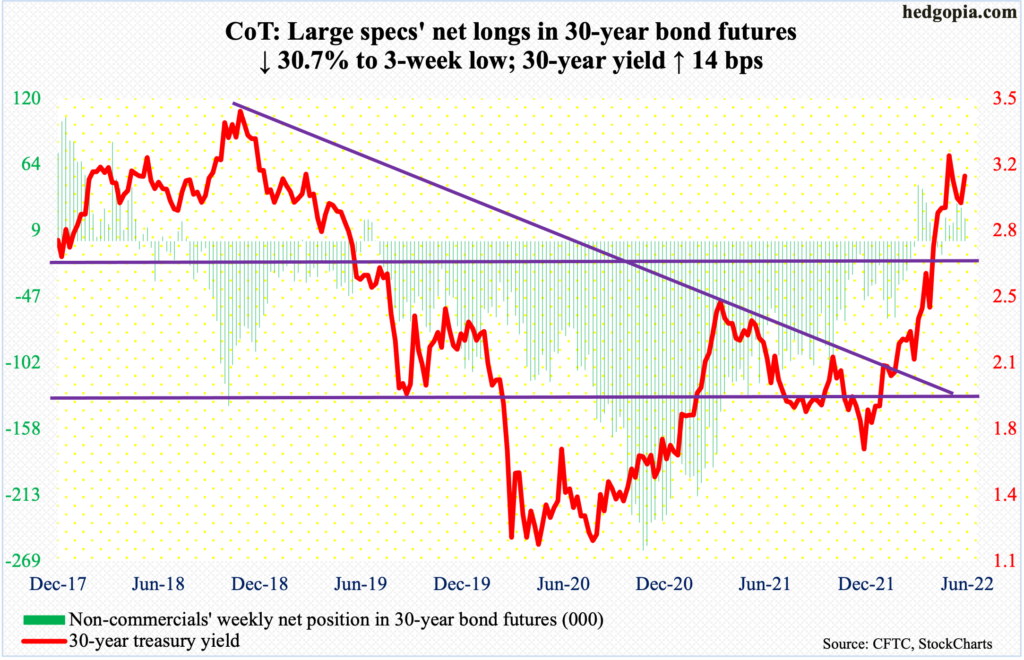
30-year bond: Currently net long 19.8k, down 8.7k.
Major economic releases for next week are as follows.
Thursday brings the financial accounts of the United States, also known as the Z.1 report. In 4Q21, US households’ equity allocation rose to a fresh high 38.12 percent, slightly past the prior high of 38.10 percent from 2Q21.
The consumer price index (May) and the University of Michigan’s consumer sentiment index (June, preliminary) are scheduled for Friday.
In the 12 months to April, headline and core CPI increased 8.3 percent and 6.2 percent respectively, edging lower from March’s 8.5 percent and 6.5 percent, which was the steepest pace since December 1981 and August 1982, in that order.
Consumer sentiment in May tumbled 6.8 points month-over-month to 58.4. This was the lowest reading since August 2011.
WTI crude oil: Currently net long 348k, up 4.8k.
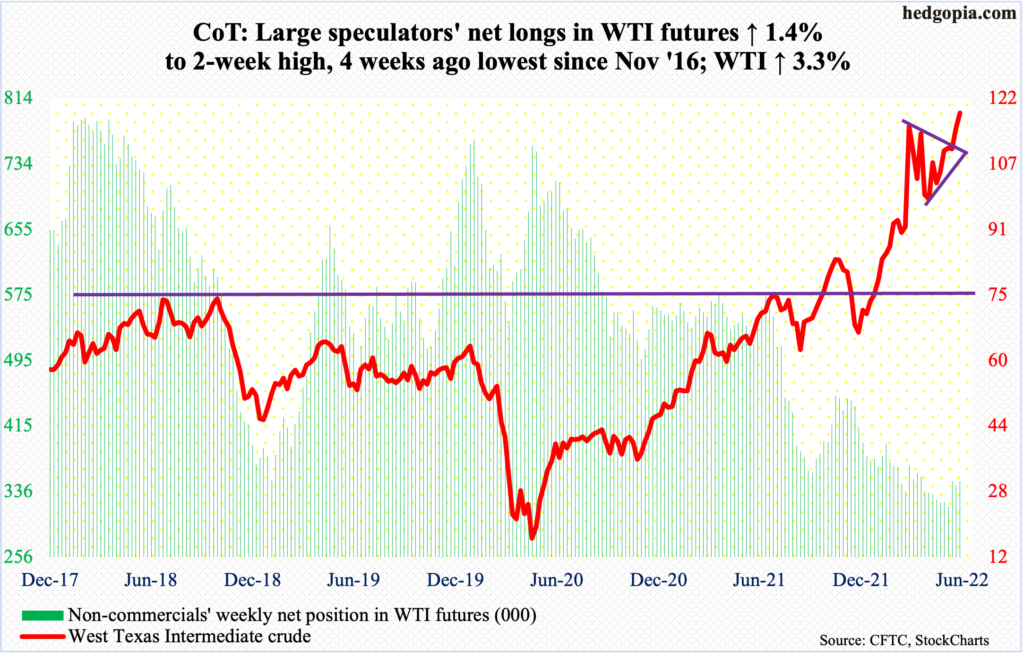
The ongoing stretch of higher highs/higher lows extended to eight weeks, as WTI ($118.87/barrel) tagged $120.46 intraday Friday.
When it was all said and done, WTI rose 3.3 percent for the week, closing above $115-$116, which has proven to be an important level going back to early March. So long as the price remains above this, the March highs just north of $130 could be in play.
In the meantime, US crude production in the week to May 27 remained unchanged at 11.9 million barrels per day. Crude imports declined 268,000 b/d to 6.2 mb/d. As did stocks of crude, gasoline and distillates, which respectively dropped 5.1 million barrels, 711,000 barrels and 529,000 barrels to 414.7 million barrels, 219 million barrels and 106.4 million barrels. Refinery utilization declined sixth-tenth of a percentage point to 92.6 percent.
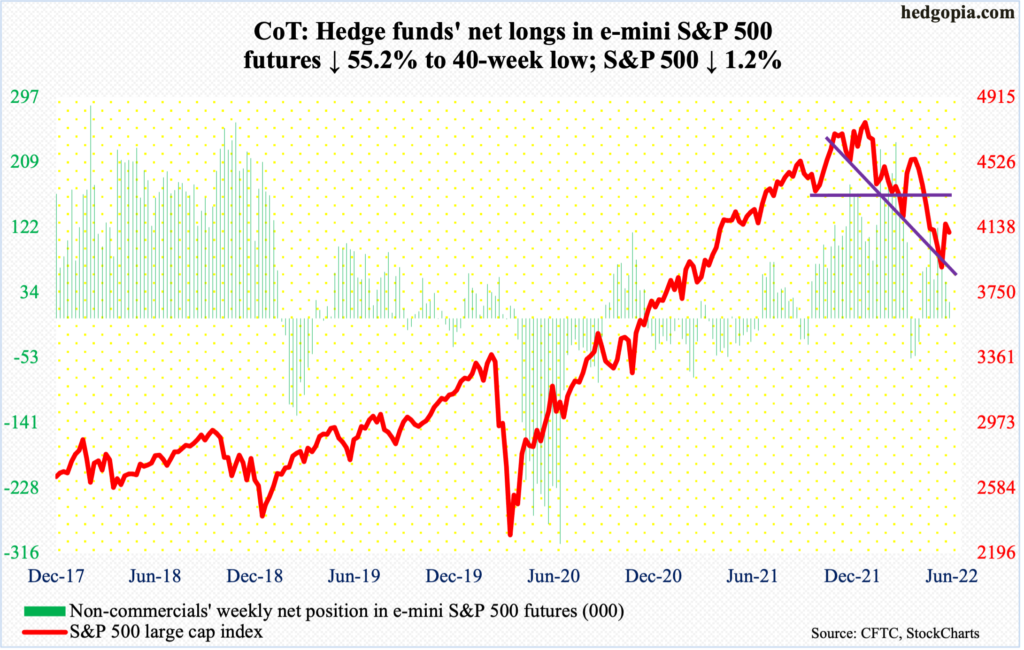
E-mini S&P 500: Currently net long 21.9k, down 27k.
For the second week in a row, flows into US-based equity funds were positive as of Wednesday, taking in $7.4 billion. This followed inflows of $5.2 billion in the prior week. Before that, these funds bled for seven weeks in a row (courtesy of Lipper). As well, SPY (SPDR S&P 500 ETF), VOO (Vanguard S&P 500 ETF) and IVV (iShares Core S&P 500 ETF) in the week to Wednesday attracted $3.8 billion, which came on the heels of inflows of $8.6 billion in the week prior (courtesy of ETF.com).
Investor sentiment improved, with Investors Intelligence bulls jumping seven percentage points to 35.2 percent. The 27.6-percent reading three weeks ago was the lowest reading since September 2015. In the right circumstances, there is room for sentiment to continue to improve.
On the weekly, there is plenty of room for the S&P 500 (4109) to continue higher (more on this here), although on the daily it is overbought. Last week, the large cap index rallied 6.6 percent. This week, it gave back 1.2 percent.
There is resistance at 4160s, a takeout of which should open up the road to the 50-day (4249). In the event the index heads lower, action around the 10- and 20-day (4053 and 4023 respectively) will be key.
Euro: Currently net long 52.3k, up 13.3k.
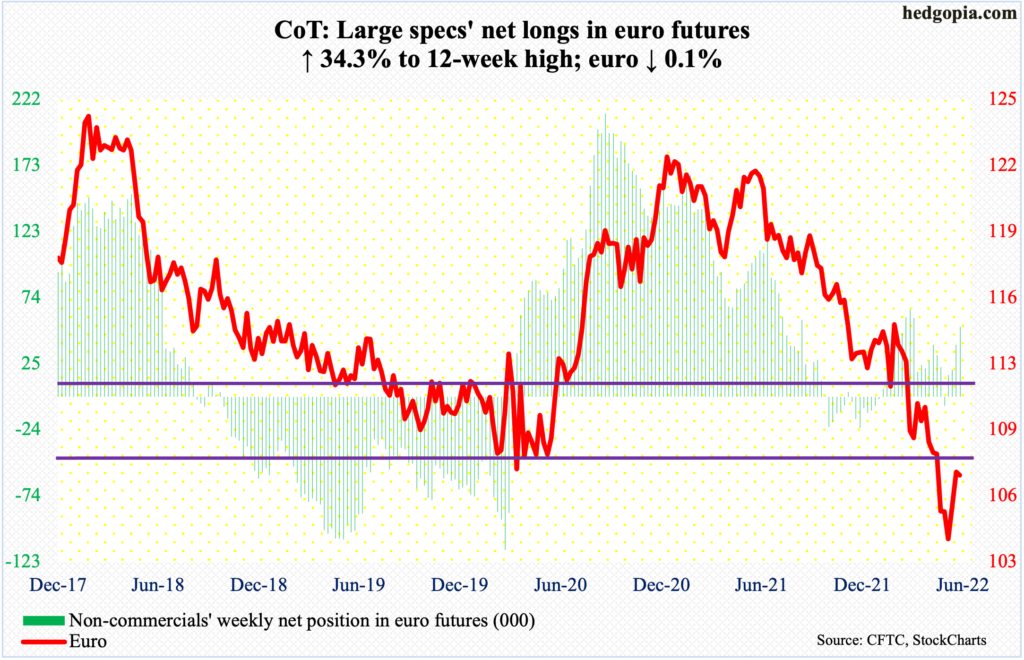
The euro stalled around horizontal resistance at $1.0750s, which also coincide with the 50-day at $1.0730. This preceded a bullish island reversal two weeks ago near the January 2017 low of $1.0341.
Earlier, the currency dropped from $1.2345 in January last year to the May 13 low of $1.0350. On the weekly and monthly, the euro is grossly oversold. On the daily, it is getting overbought. That said, a takeout of $1.0750s opens up the door toward $1.0840s.
Gold: Currently net long 172.6k, down 11.2k.
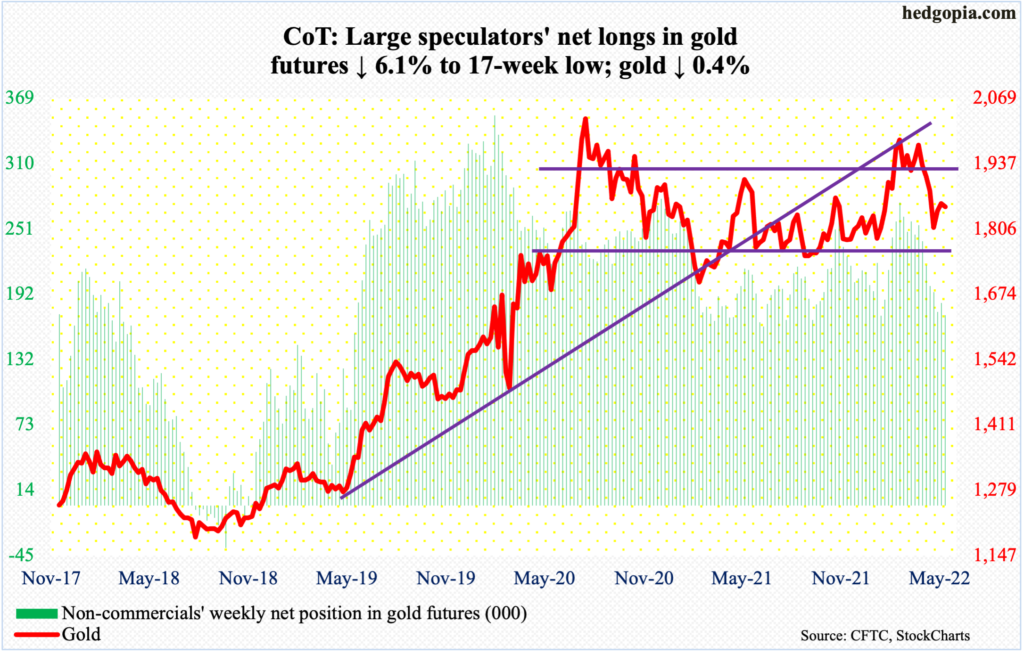
For the third week in a row, gold closed at/around a broken rising trend line from last August. The metal ended the week at $1,850/ounce and tagged as high as $1,879 intraday Friday; it would have reclaimed the trend line should the weekly high held but gold bugs were unable to pull that one off.
A decisive takeout of $1,850s-$1,860s can add to momentum, but the daily is getting overbought. The 200-day lies at $1,841.
Nasdaq 100 index (mini): Currently net long 5.6k, down 8.1k.
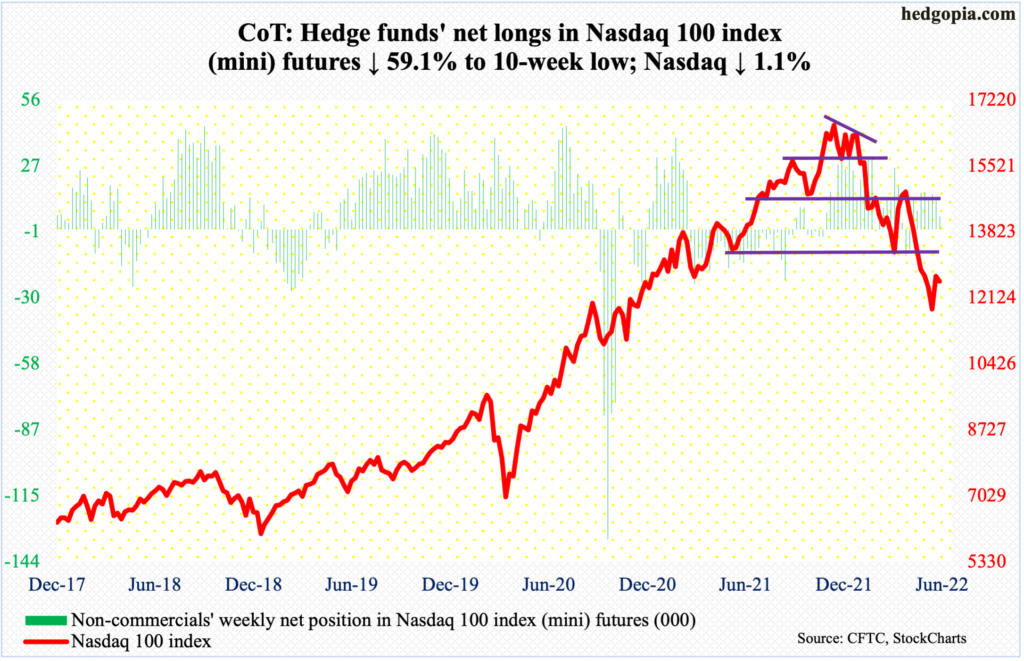
After seven consecutive weeks of decline, the Nasdaq 100 shot up 7.2 percent last week. It tried to build on that this week but tech bulls could not quite pull that off.
Interestingly, Thursday marked both the weekly high and low, with the tech-heavy index up 1.7 percent at the high and down 1.8 percent at the low. In the end, it fell 1.1 percent for the week.
The daily is overbought. The index (12548) just witnessed a bullish crossover between the 10- and 20-day (12317 and 12266 respectively). If last week’s reversal is genuine, these averages should attract bids.
Russell 2000 mini-index: Currently net short 78.6k, up 3.9k.
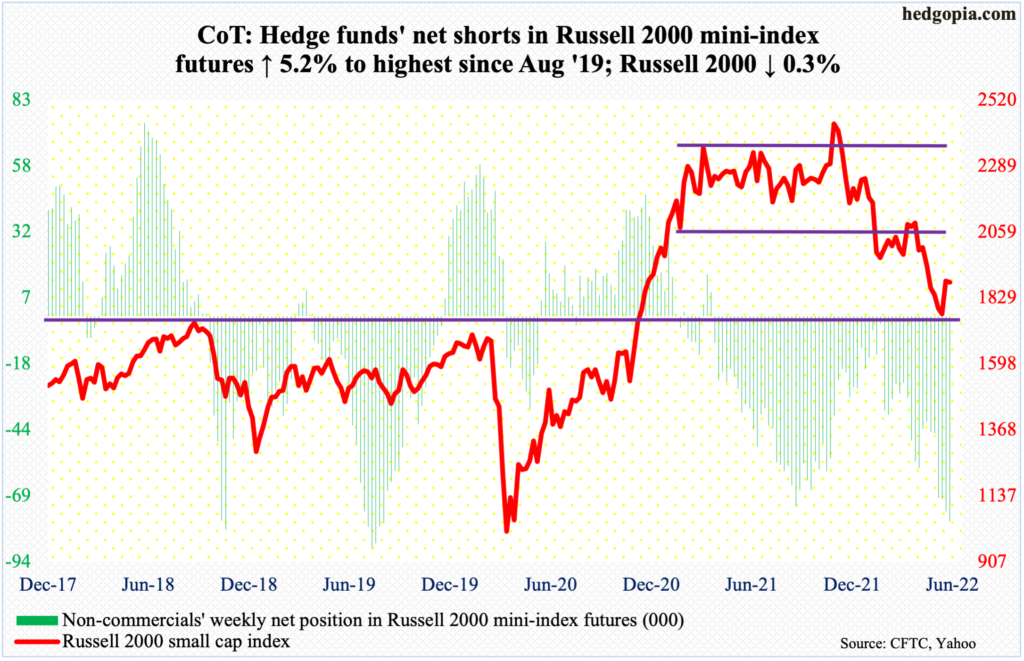
This week saw a test of 1900 for the first time since suffering a breach a month ago. And it was unsuccessful. The Russell 2000 played ping pong between 2080s and 1900 for three months before breaching the support in late April.
Before that in mid-January, a major range breakdown occurred, losing 2080s; for 10 months, the index went back and forth between 2080s and 2350s.
Friday’s rejection at 1900 preceded a major breakout retest on May 12 when the small cap index ticked 1701. This was a successful defense of a breakout from November 2000. This preceded a 30.8-percent drop between last November’s record high and that low.
So for the moment, the index (1883) seems trapped between 1700 and 1900.
US Dollar Index: Currently net long 37.5k, down 501.
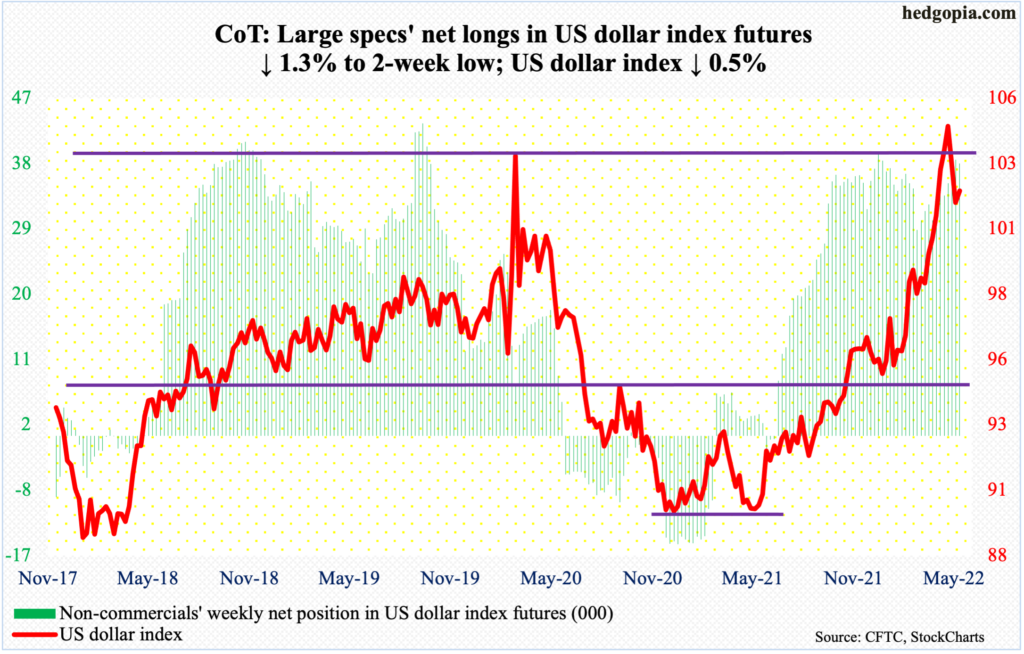
After four straight up months – and eight in 11 – the US dollar index had a down May. It rallied from 89.17 in January last year to 105.06 on May 13 (this year). On its way there, the index broke out of just south of 104, which acted as a ceiling going back to January 2017. Breakout retest failed on the 17th.
The subsequent pressure found support at the 50-day (101.59), including Friday. There is room for the dollar index (102.16) to unwind its oversold condition on the daily. Immediate resistance lies at 102.70s.
VIX: Currently net short 44.7k, up 1.1k.
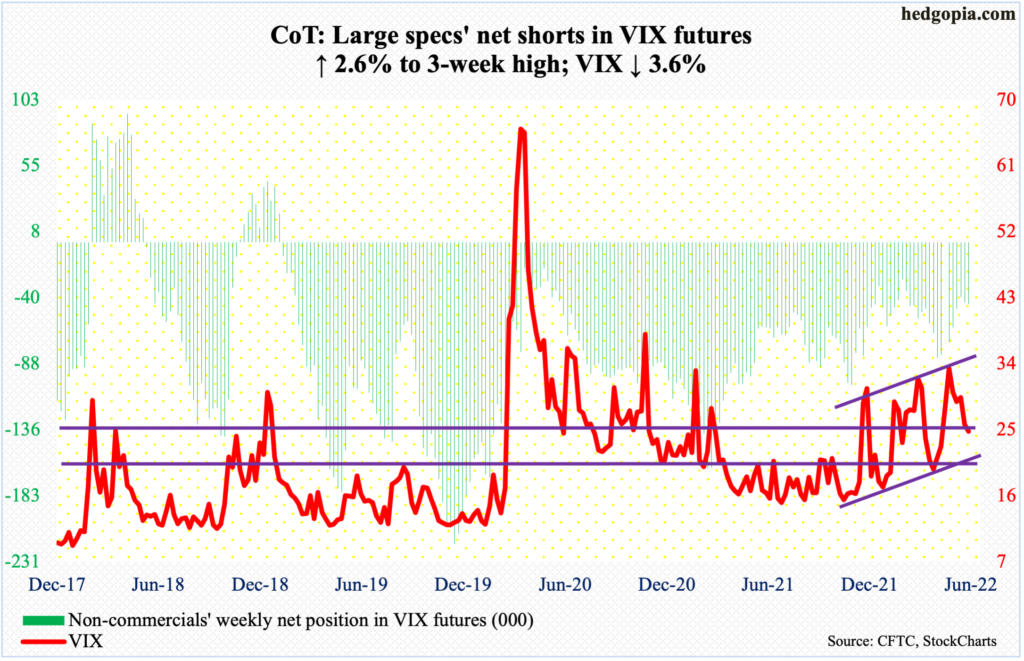
This week, both the S&P 500 and VIX fell, which is rare. Characteristically, they go the opposite ways.
On the weekly, last week’s high of 31.07 was yet another lower high after tagging 36.64 five weeks ago. This week’s high of 28.35 was posted on Tuesday. This pattern has held since January when VIX hit 38.94. This, however, does not apply on a closing basis, which shows a pattern of higher highs/higher lows. The lower end of the channel the volatility index is in approximates horizontal support at low-20s; right around there rests the 200-day at 22.82.
Thanks for reading!
