
Reversing weeks of downward pressure, major US stock indices had a big week last week. There is room to run, if nothing else just to unwind the oversold condition they are in. With one session to go, May is setting up for quite a reversal month.
At its worst on May 20 when the S&P 500 dropped to 3810, it was down 7.8 percent for the month. May has one session to go before it is over, and the large cap index has reversed to be up 0.6 percent.
Last week, it jumped 6.6 percent, which was the first up week in eight. This came after the index tumbled 20.9 percent intraday between the record high 4819 on January 4 and the May 20 low.
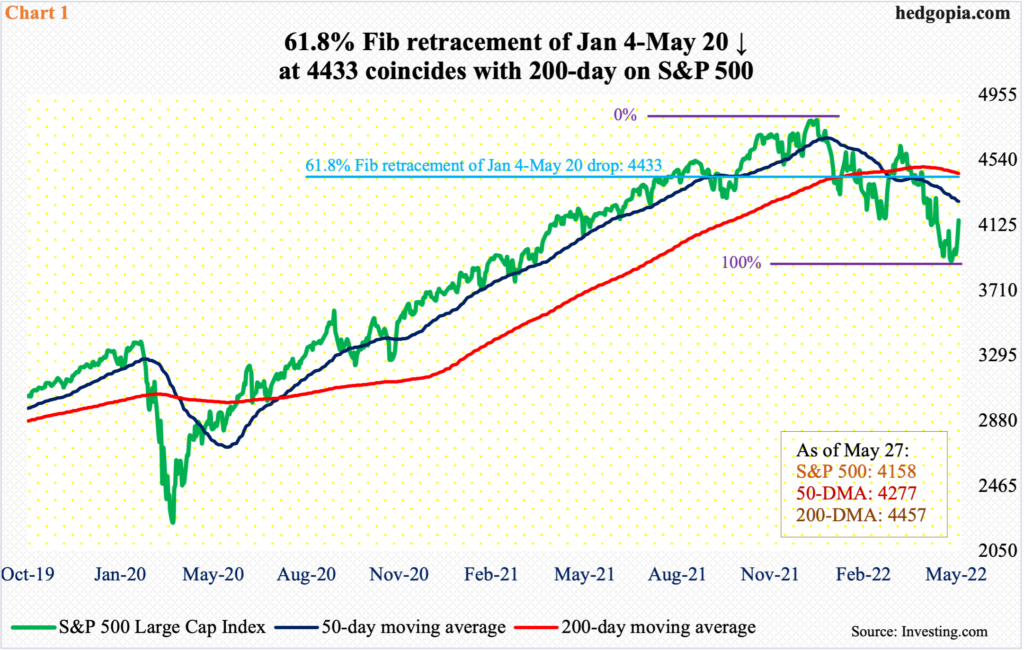
From early this year, the S&P 500 has been caught in a descending channel. At last week’s low of 3875, the lower end was tested, as was the case the week before. It has held. Shorter-term moving averages have curled up. The daily MACD developed a bullish crossover.
The upper end of the channel lies at 4450s, which is about where the 200-day (4457) rests. Plus, a 61.8-percent Fibonacci retracement of the January-May decline is at 4433 (Chart 1). Thus, this area may just act like a magnet in due course.
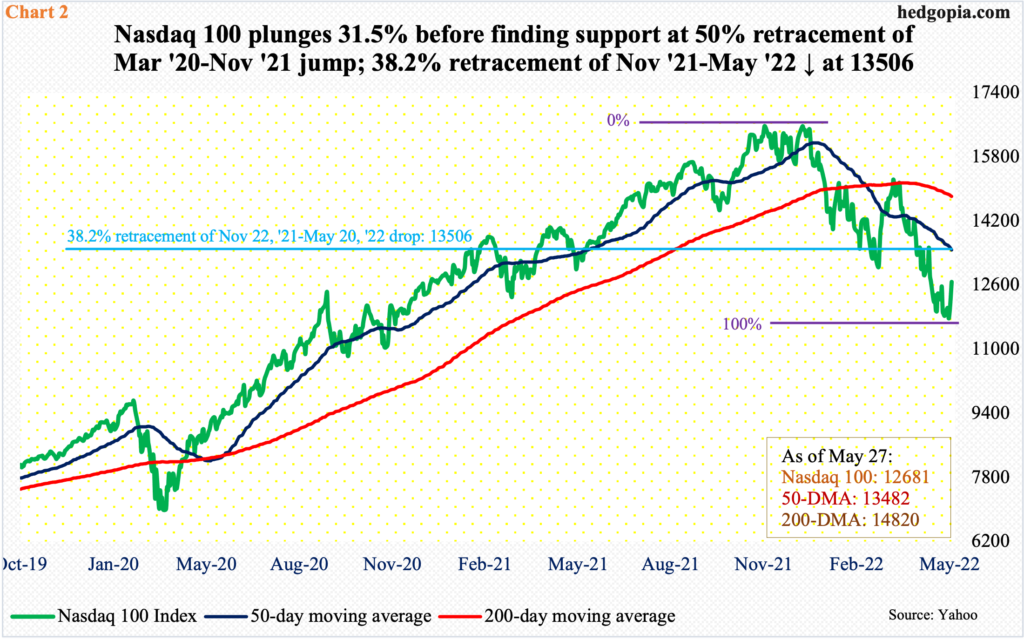
Similar dynamics are at play on the Nasdaq 100, which between the November 22 (last year) high of 16765 and the May 20 low of 11492, plunged 31.5 percent. As did the S&P 500, the tech-heavy index has been playing ping pong within a descending channel. It just bounced off the lower end. Last week, it rallied 7.2 percent – its first up week in eight.
The upper end of the channel lies at 14500.
Before that, the Nasdaq 100 (12681) needs to take out the 50-day at 13482. The average also approximates with a 38.2-percent retracement of the November 2021-May 2022 decline lying at 13506 (Chart 2).
Importantly, as the index made new lows, several indicators such as new highs versus new lows, the advance-decline line and the percent of stocks above the 50-day were going the other way (more on this here).
The index closed out last week at 12681. Nearest resistance rests at 13000.
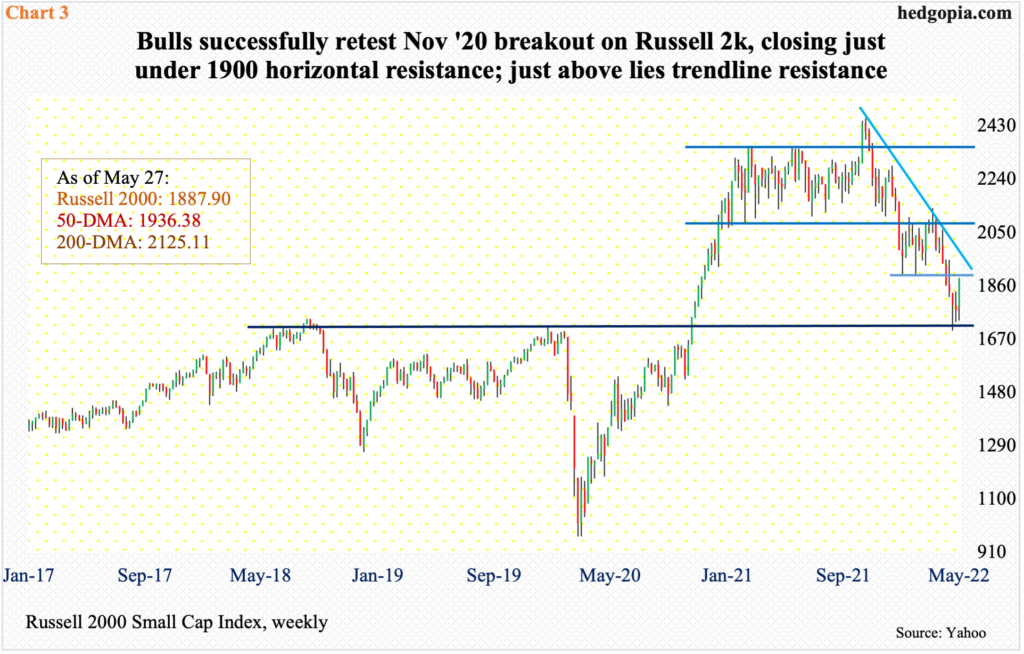
In the small-cap arena, bulls may just have defended crucial support. In November 2020, the Russell 2000 broke out of 1700, which since June 2018 had proven to be a roadblock (Chart 3). On May 12 (this year), the small cap index ticked 1701 before bids showed up. Thus far, it has been a successful breakout retest.
Before that, the Russell 2000 tumbled 30.8 percent from last November’s record high 2459.
The index ended last week at 1888, just under 1900. For three months, the Russell 2000 remained rangebound between 2080s and 1900 before breaching the support in late April. Earlier in mid-January, a major breakdown occurred, losing 2080s, which was the lower end of a 10-month range; the upper end lied at 2350s.
As things stand, 1900 is the make-or-break. This is also about where trend-line resistance from last November’s high lies. After that, a 38.2-percent Fibonacci retracement of the November 2021-May 2022 decline lies at 1991.
The advantage equity bulls have at this stage is that sentiment has taken a real hit.
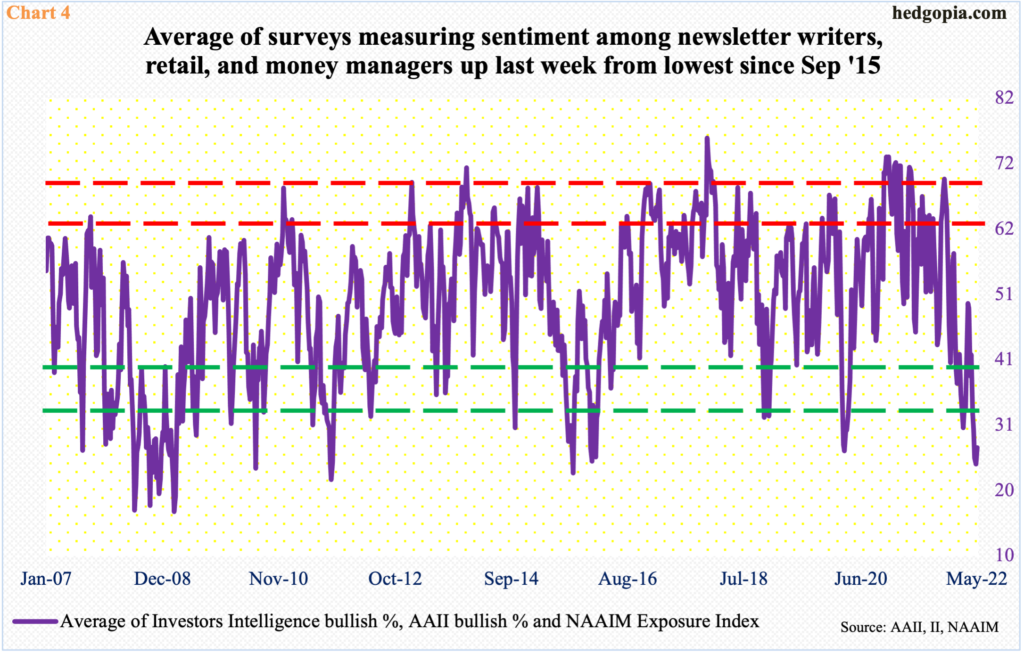
Chart 4 combines three different surveys measuring three different groups. Investors Intelligence is a survey of newsletter writers, who cater to paying subscribers. The American Association of Individual Investors surveys its members, so it is a good reflection on individual mood. And the NAAIM Exposure Index surveys how money managers are positioned, with the index measuring National Association of Active Investment Managers members’ average exposure to US stock markets.
In the week to the May 10, Investors Intelligence bulls hit 27.6 percent, which was the lowest reading since February 2016. Similarly, AAII bulls’ 15.8 percent reading in the week to April 14 was the lowest since September 1992. Last but not the least, the NAAIM reading reached 19.5 in the week to May 18, which is the lowest since March 2020.
Last week, the average of the three rose to 27.1 from the prior week’s 24.4, which was the lowest since September 2015. Sentiment is suppressed. Should a genuine unwinding unfold, there is plenty of room for sentiment to improve.
The major equity indices remain grossly oversold particularly on the weekly, where several indicators have begun to move up. At this point, bulls need positive catalysts. Inflation and the tightening cycle (in interest rates) are front and center.
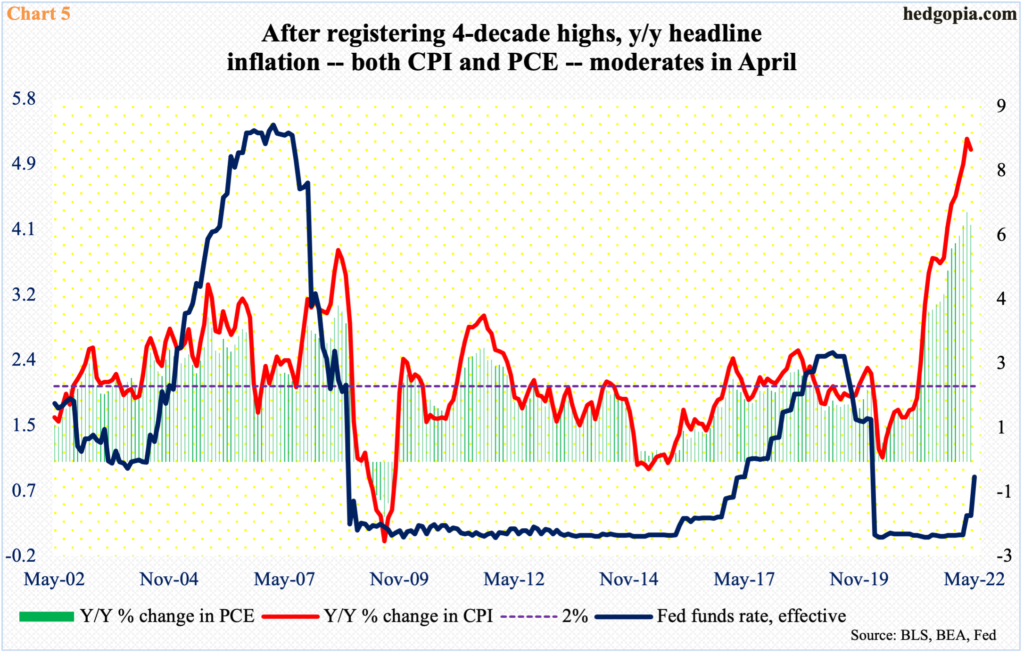
Responding to four-decade highs in consumer inflation, the message coming from the Fed is that it will do whatever it takes to control the rampant price rise. The fed funds rate has been raised twice this year for a total 75 basis points, to a range of 75 basis points to 100 basis points. In the futures market, traders expect the benchmark rates to hit 275 basis points to 300 basis points by the year-end. Any scenario in which it becomes apparent the Fed may not need to tighten with that aggression is likely to draw positive reaction from investors.
In April, inflation moderated year-over-year, albeit from a very elevated level. The consumer price index rose 8.3 percent and the personal consumption expenditures 6.3 percent; March’s 8.5 percent and 6.6 percent were the highest since December 1981 and January 1982, in that order.
One month does not make a trend, so it is early to declare inflation has peaked. But April’s numbers are encouraging. If the trend sustains, an improving interest-rate outlook can turn into a potential tailwind for stocks.
Thanks for reading!
