
Following futures positions of non-commercials are as of July 5, 2022.
10-year note: Currently net short 170.5k, down 11.2k.
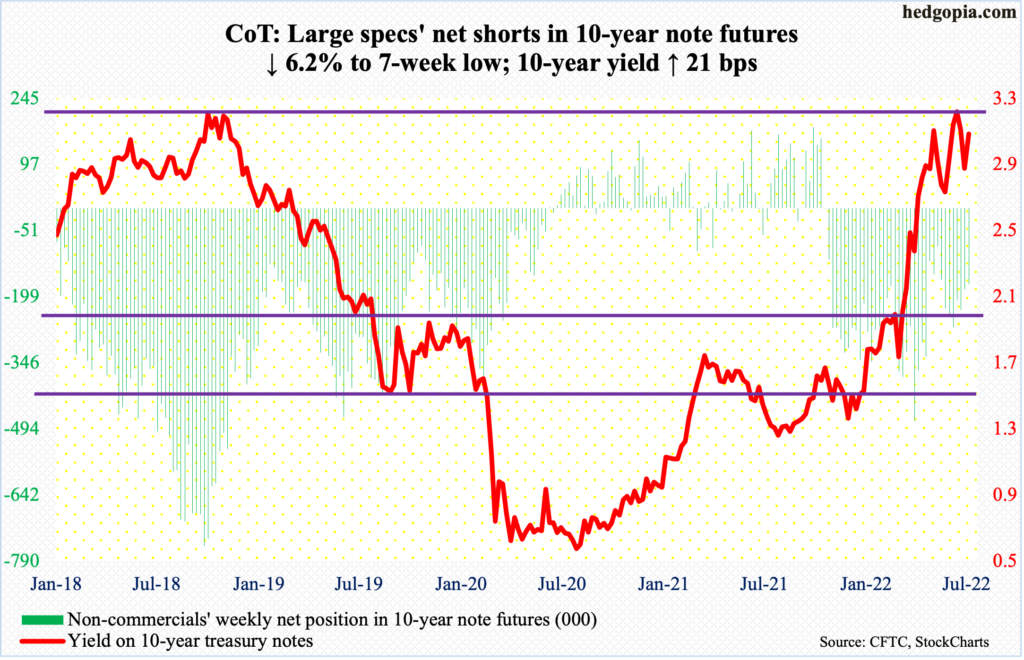
FOMC minutes for the June 14-15 meeting – released this week – showed members’ sole focus at present remains on inflation. The message: more restrictive policy is likely if inflation stays high. June’s CPI is due out next Wednesday (more on this below).
Similarly, headline and core PCE (personal consumption expenditures) in May rose 6.4 percent and 4.7 percent year-over-year respectively. May’s pace was slower than the 6.6 percent and 5.3 percent witnessed in March and February respectively.
Inflation has moderated from recent highs but high enough to warrant a tighter policy. So far this year, the Federal Reserve has tightened three times – by 75 basis points in June, 50 basis points in May and 25 basis points in March.
As things stand, another 75-basis-point move is baked in for the meeting later this month. In the futures market, traders expect another 50 each in September and November and maybe a 25 in December, ending the year between 350 basis points and 375 basis points, up from the current range of 150 basis points and 175 basis points.
By the end of the year, the tightening trajectory may look entirely different. As inflation softens – albeit from an elevated level – in the months ahead, the expected aggression in rate hikes itself could begin to ease. This is not in the market currently.
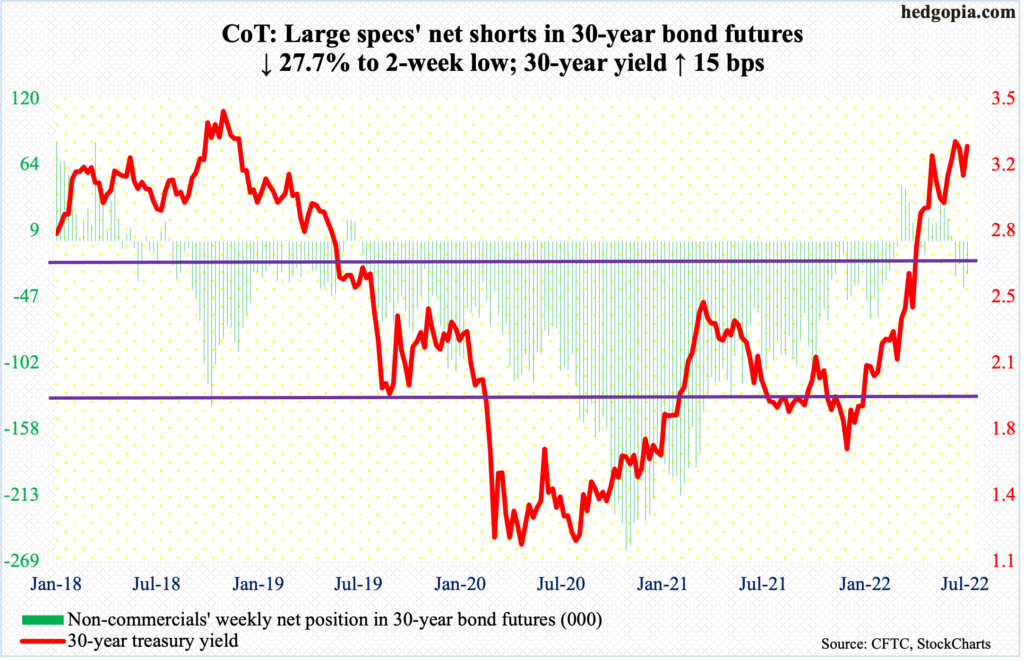
30-year bond: Currently net short 27.7k, down 10.6k.
Major economic releases for next week are as follows.
The NFIB optimism index (June) is due out Tuesday. Small-business job openings in May increased four points month-over-month to 51, matching the prior high from last September.
The consumer price index (June) is scheduled for Wednesday. In the 12 months to May, headline and core CPI jumped 8.6 percent and six percent, with the former highest since December 1981 and the latter having peaked at 6.5 percent in March, which was the steepest pace since August 1982.
Thursday brings the producer price index (June). Headline and core wholesale prices in May surged 10.8 percent and 6.8 percent year-over-year, in that order.
Retail sales (June), industrial production (June) and the University of Michigan’s consumer sentiment index (July, preliminary) are on dock for Friday.
May retail sales edged down 0.3 percent m/m from April’s record $674.7 billion (seasonally adjusted annual rate).
Capacity utilization inched up 0.2 percent m/m in May to 79 percent, which is the highest since December 2018.
In June, consumer sentiment tumbled 8.4 points m/m to 50 – a new low (data goes back to January 1978).
WTI crude oil: Currently net long 262.4k, down 28.1k.
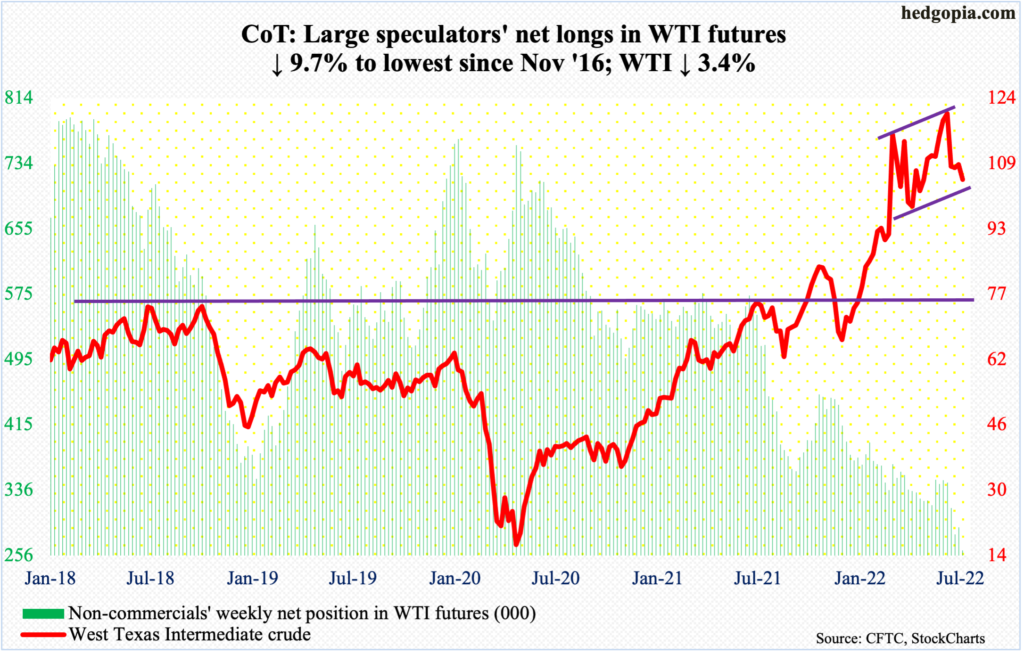
On Wednesday, WTI ($104.79/barrel) ticked $95.10 intraday, coming very close to testing horizontal support at $93-$94, and it held. Earlier on June 14, it tagged $123.68 intraday, which represents a lower high versus $130.50 posted on March 7. The crude has traded within an ascending channel since April, which has been breached (on an intraday basis), albeit not by much.
The daily is oversold. After having defended $93-$94, the path of least resistance is up – toward the 50-day at $110.18. WTI is currently trapped between the average and the 200-day ($92.78). As – if – the black gold rallies in the sessions ahead, it is worth watching how the daily RSI (44.5) behaves around the median. Early last week, the momentum indicator retreated from that level.
In the meantime, per the EIA, US crude production in the week to July 1 remained unchanged at 12.1 million barrels per day. Crude imports increased 841,000 b/d to 6.8 mb/d. As did crude inventory which rose 8.2 million barrels to 423.8 million barrels. Stocks of gasoline and distillates, however, fell – respectively down 2.5 million barrels and 1.3 million barrels to 219.1 million barrels and 111.1 million barrels. Refinery utilization decreased one-half of a percentage point to 94.5 percent.
E-mini S&P 500: Currently net short 183.7k, up 44.5k.
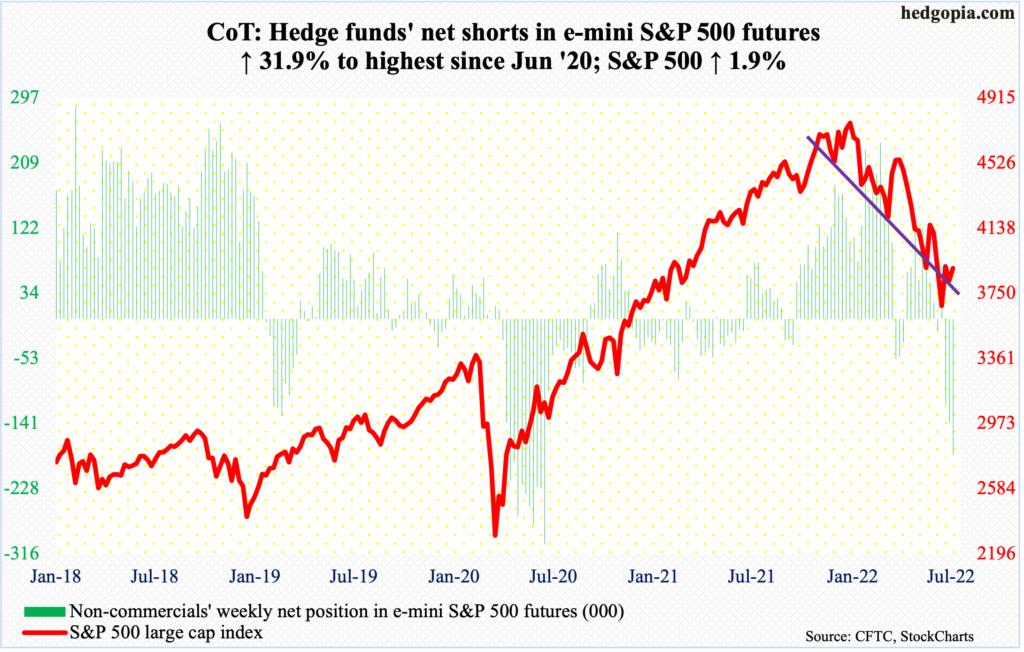
At least through the week to Wednesday, flows continued to disappoint. US-based equity funds lost $7.9 billion, having lost $29.6 billion in the prior three (courtesy of Lipper). SPY (SPDR S&P 500 ETF), VOO (Vanguard S&P 500 ETF) and IVV (iShares Core S&P 500 ETF) in the week to Wednesday saw withdrawals of $3.5 billion (courtesy of ETF.com).
It is probable flows begin to improve in the sessions/weeks ahead. Dips in the S&P 500 were consistently bought later last week and early this week. The June 16-17 lows of 3630s remain intact. Encouragingly for equity bulls, a 10/20 bullish crossover developed on Thursday.
The weekly seems ready to unwind its oversold condition. There is gap-down resistance just north of 4000 and after that lies horizontal resistance at 4160s. The large cap index closed out the week at 3899, up 1.9 percent.
Longer-term, buybacks have consistently provided a tailwind for stocks, with S&P 500 companies having spent a record $984.6 billion in the four quarters to 1Q22. This is taking place even as corporate bond issuance has trended lower after posting a new record in 2020. This could begin to adversely impact buybacks in the coming quarters (more on this here).
Euro: Currently net short 16.9k, up 6.3k.
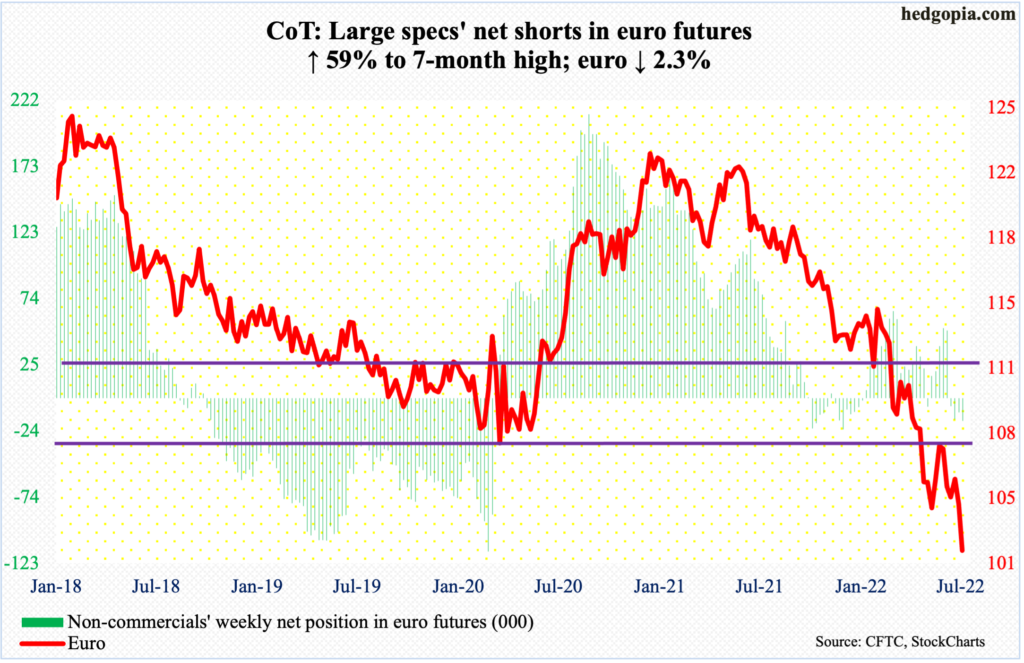
Last Friday, the euro ticked $1.0367 intraday before closing at $1.0429 for a potentially bullish hammer; this was a successful test of the May 13 low of $1.0350, which was a successful retest of the January 2017 low of $1.0341. This support gave way as soon as the holiday-shortened week began.
On Tuesday, the currency gapped down, followed by another gap lower on Wednesday; by Friday, the euro ticked $1.0116, which was the lowest print since December 2002. Back then, the euro fell below parity.
The dollar is acting as a haven and this is coming at the expense of several currencies, including the euro. As the latter nears parity, the monthly RSI just went sub-30; the last time things were this oversold was the early months of 2015.
Gold: Currently net long 145.7k, down 12k.
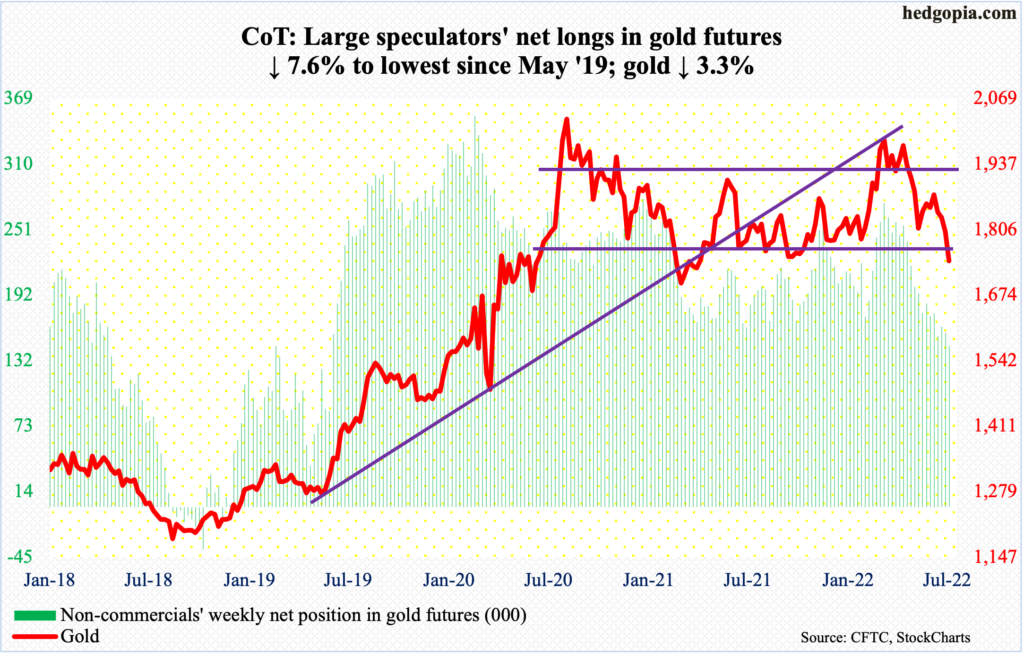
Gold ($1,742/ounce) broke down on Tuesday, slicing through lateral support at $1,800. Going back more than a decade, $1,760s-$1,770s has acted as an important price point for both bulls and bears; the last time this was genuinely tested was last December, after which the yellow metal went on to rally to a fresh high $2,079 in March (this year).
Tuesday’s breakdown was followed by a breach of $1,760s-$1,770s on Wednesday. This has pushed the daily into oversold condition. Plus, Friday’s spinning top session tested – successfully – horizontal support at $1,720s, a breach of which can open the door to a test of $1,670s, which was successfully tested last August.
Nasdaq 100 index (mini): Currently net long 30.9k, up 6.7k.
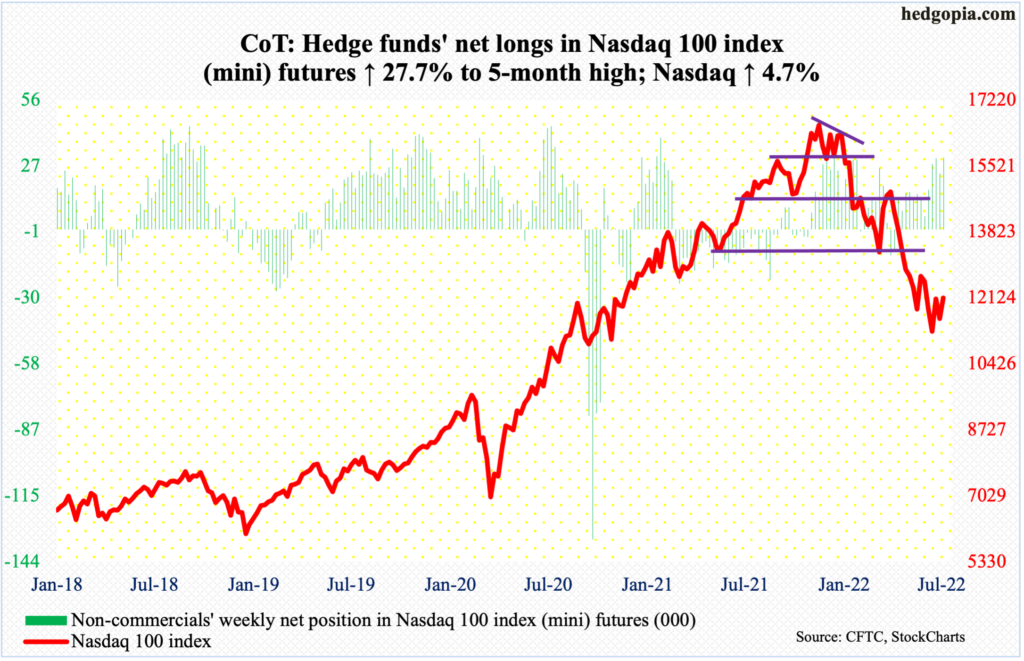
Ahead of 2Q earnings, which begins in earnest next week, tech is beginning to garner interest. It remains to be seen if company managements use this as an opportunity to meaningfully lower guidance (more on this here), but the fact remains that stocks got shellacked in the first half.
Between last November’s high 16765 and last month’s low 11037, the Nasdaq 100 plunged 34.2 percent. A lot of the ongoing deceleration in economic activity is probably in the price. The sell-side, however, is yet to lower their numbers, hence an opportunity for managements to handhold these analysts lower.
This week, for the first time in three months, the daily RSI crossed over the median. Tech bulls can build on this once they reclaim the 50-day (12179), which could be on the verge of at least going sideways, followed by gap-down resistance at 12260s.
There is room for the weekly to continue higher. The Nasdaq 100 closed the week at 12126.
Russell 2000 mini-index: Currently net short 118.6k, up 14k.
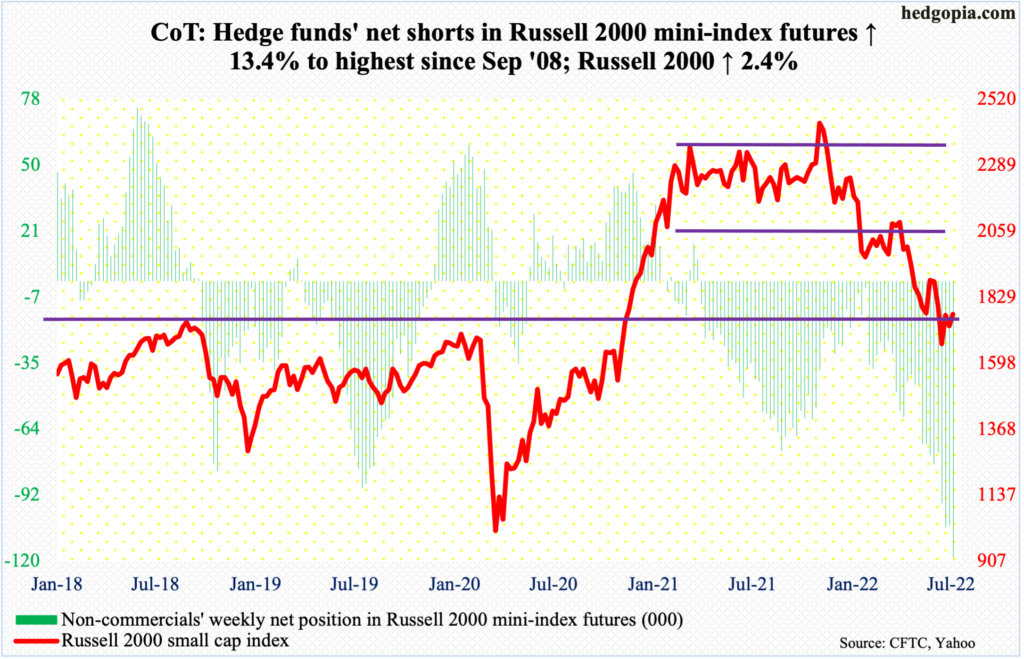
After closing the Russell 2000 above crucial 1700 last week, small-cap bulls had to fend off bears who reclaimed the level intraday Tuesday but were unable to close the deal. By Friday, the small cap index ticked 1780, ending the week at 1769.
The importance of 1700 is because this is where the Russell 2000 broke out of in November 2000. Bulls have defended this after suffering a 33.2-percent decline between last November’s peak and last month’s trough at 1641.
Earlier, a major breakdown occurred mid-January, losing 2080s; for 10 months, the Russell 2000 went back and forth between 2080s and 2350s. After that, it seesawed between 2080s and 1900, followed by a ping pong match between 1900 and 1700. Odds now favor a move toward 1900.
US Dollar Index: Currently net long 39.3k, down 4k.
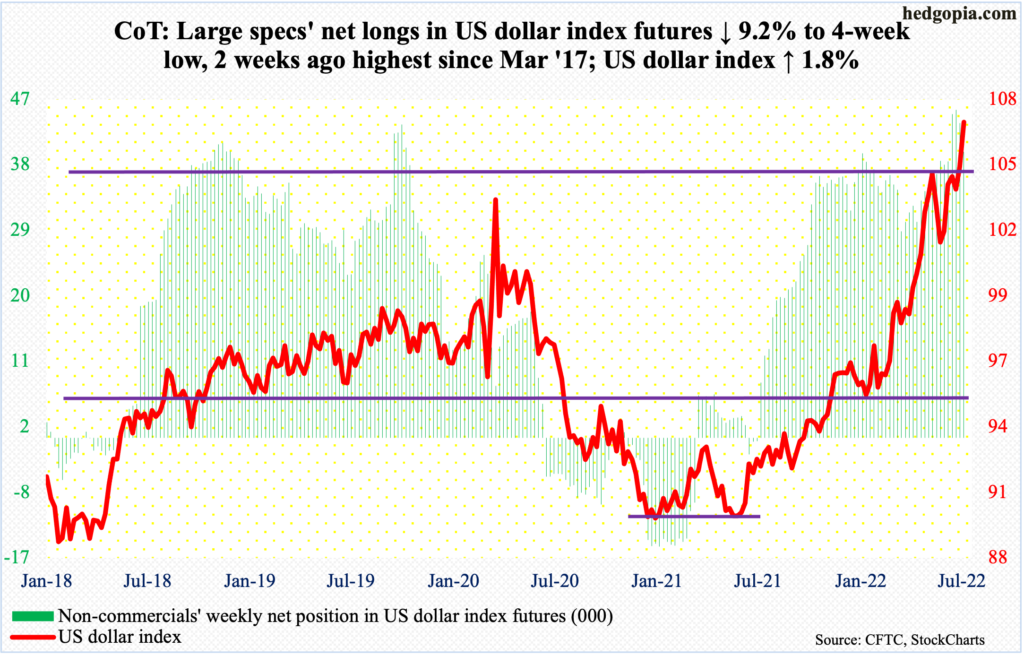
There is no stopping the king dollar. At least it seems that way. The US dollar index broke out of 105 on Monday, closing the week at 106.82. This preceded a breakout last month at 104, which acted as a ceiling going back to January 2017. Before that, it bottomed at 89.17 in January last year, so has come a long way.
Friday’s intraday high of 107.61 is the highest since October 2002. Back then, the index rolled over after touching 120.24 in January 2002 – and 121.21 in July 2001 – before going sideways around 106-107 for six months and then continue lower. The index then fell all the way to 71.33 by April 2008.
The lesson in this is that the index – as do other assets – tends to overshoot both ways. It is futile to even guess where it might peak in the current cycle but suffice to say that the next sustained move is lower.
VIX: Currently net short 45.5k, down 4.1k.
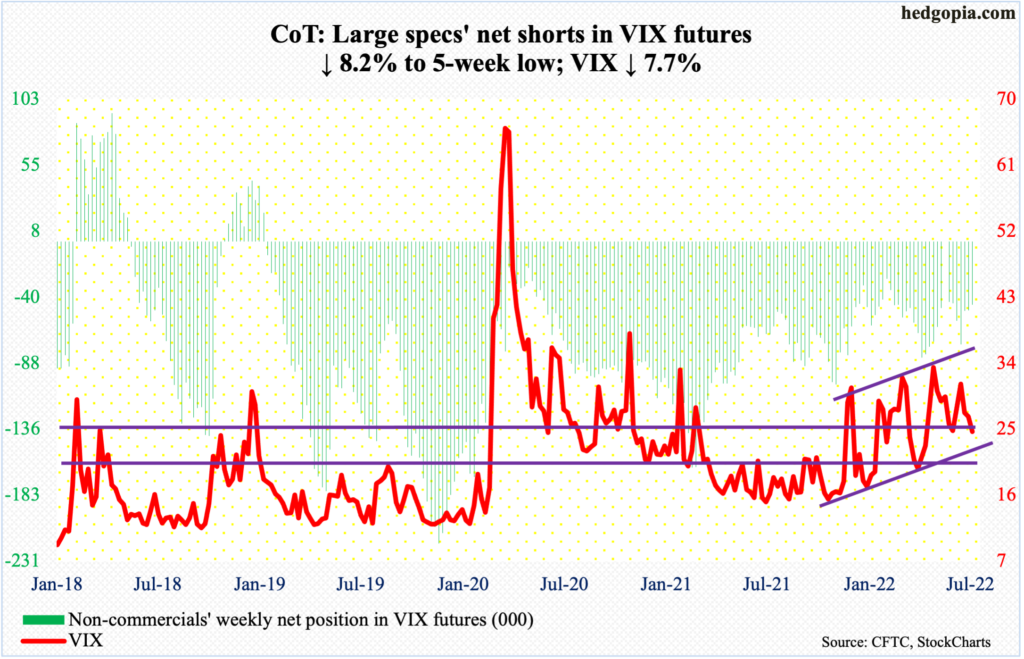
Volatility bulls’ attempt to recapture the 50-day failed miserably on Tuesday as they were unable to hang on to the intraday gains, ending the session lower with a gravestone doji. By Thursday, VIX tagged 25.66 intraday, but the mid-20s support did not yield right away. This occurred on Friday, as the volatility index closed at 24.64. The next layer of support lies at low-20s and the 200-day at 23.90.
Thanks for reading!
