
Following futures positions of non-commercials are as of July 12, 2022.
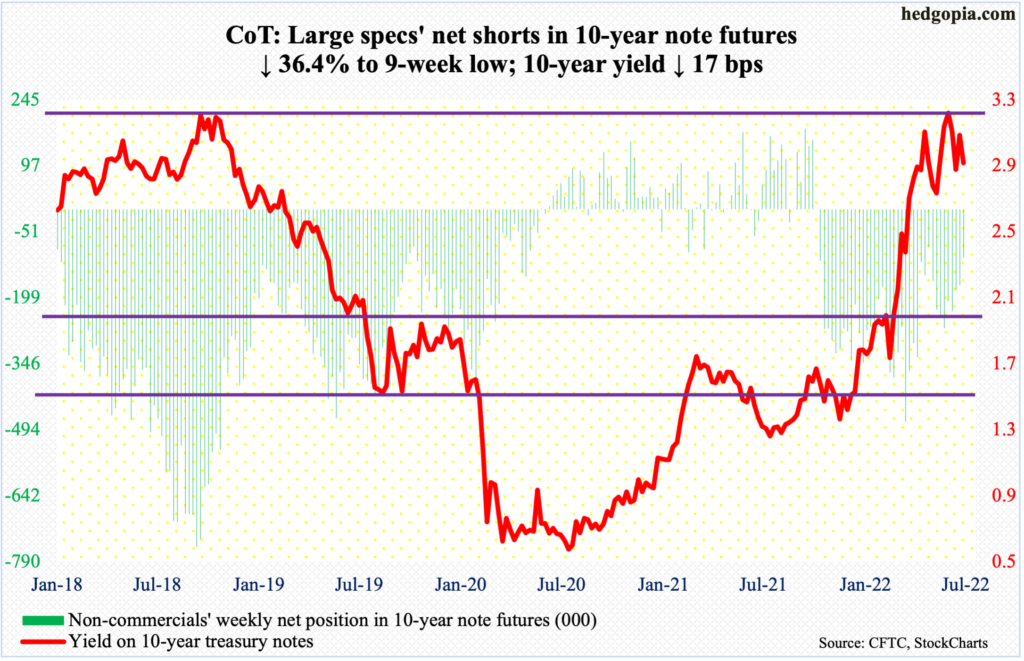
10-year note: Currently net short 108.4k, down 62.1k.
There was some jawboning this week.
On Wednesday, inflation measured by the consumer price index showed consumer prices in June surged 9.1 percent year-over-year, which was the fastest pace since November 1981 (chart here). Markets were quick to price in a 100-basis-point move in the meeting later this month; until Wednesday’s CPI report, 75 was the consensus. The next day, wholesale prices jumped 11.3 percent from a year ago, just shy of March’s record 11.6 percent. This pretty much seemed to seal a 100-basis-point hike on July 26-27.
Then came the jawboning. On Thursday, Christopher Waller, governor, said he supports a 75-basis-point move, saying the markets may have gotten ahead of themselves a little bit on Wednesday.
Futures traders quickly adjusted, giving a 71-percent probability for a 75-basis-point move in the upcoming meeting. By the end of the year, they continue to expect the fed funds rate between 350 basis points and 375 basis point, up from the current 150 basis points to 175 basis points. At this juncture, it probably makes sense to expect a softening in this tightening trajectory as the year-end approaches than for it to steepen (more on this here).
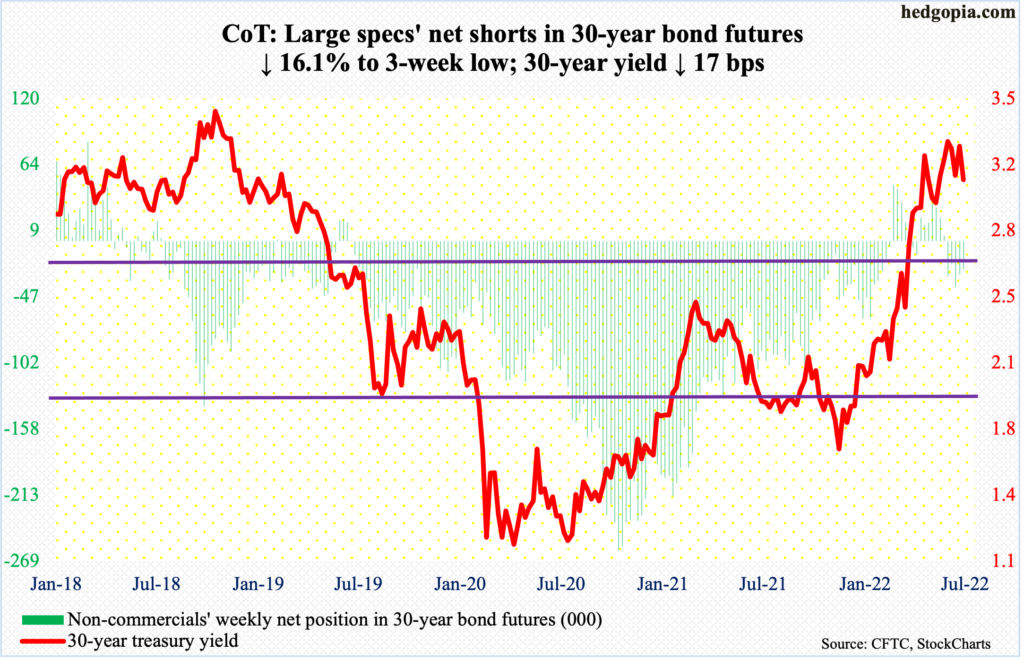
30-year bond: Currently net short 23.2k, down 4.5k.
Major economic releases for next week are as follows.
The NAHB housing market index (July) and Treasury International Capital data (May) are due out on Monday.
Homebuilder confidence slid a couple of points month-over-month in June to 67 – a two-year low. In November 2020, the index peaked at 90.
In the 12 months to April, foreigners sold $174.4 billion in US stocks, which was the fourth straight month of selling over that timeframe. In March last year, they bought a record $404.7 billion worth.
Housing starts (June) are scheduled for Tuesday. Starts tumbled 14.4 percent m/m in May to a seasonally adjusted annual rate of 1.55 million units – a 13-month low.
Wednesday brings existing home sales, which decreased 3.4 percent m/m in May to 5.41 million units (SAAR). This was the lowest since June 2020.
WTI crude oil: Currently net long 266.2k, up 3.8k.
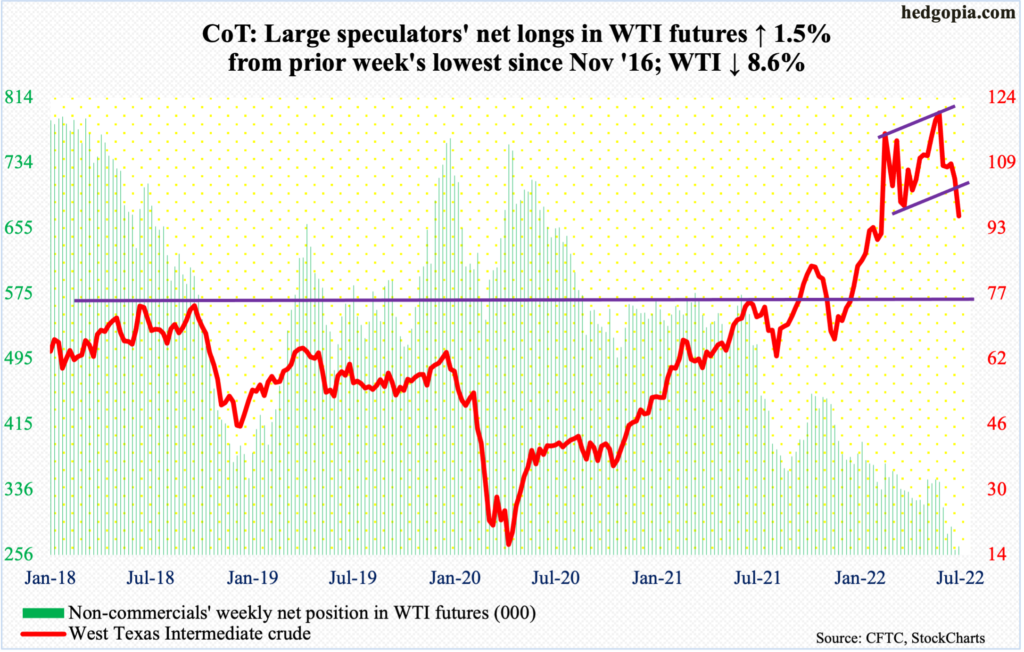
Horizontal support at $93-$94 was breached intraday Thursday but only to be reclaimed by close, for a hammer session. This was preceded by Wednesday’s spinning top, followed by another on Friday. These candles have appeared around the 200-day moving average ($93.37).
WTI ($97.59/barrel) rolled over after tagging $123.68 on June 14, which represents a lower high versus $130.50 posted on March 7. A loss of $93-$94 will be a major negative. Until that happens, in the event of a rally, the lower range of a breached ascending triangle gets tested around $110. The 50-day rests at $109.57.
In the meantime, per the EIA, US crude production in the week to July 8 declined 100,000 barrels per day to 12 million b/d. As did crude imports which decreased 164,000 b/d to 6.7 mb/d. Stocks of crude, gasoline and distillates all increased – respectively by 3.3 million barrels, 5.8 million barrels and 2.7 million barrels to 427.1 million barrels, 224.9 million barrels and 113.8 million barrels. Refinery utilization rose four-tenths of a percentage point to 94.9 percent.
E-mini S&P 500: Currently net short 215.5k, up 31.8k.
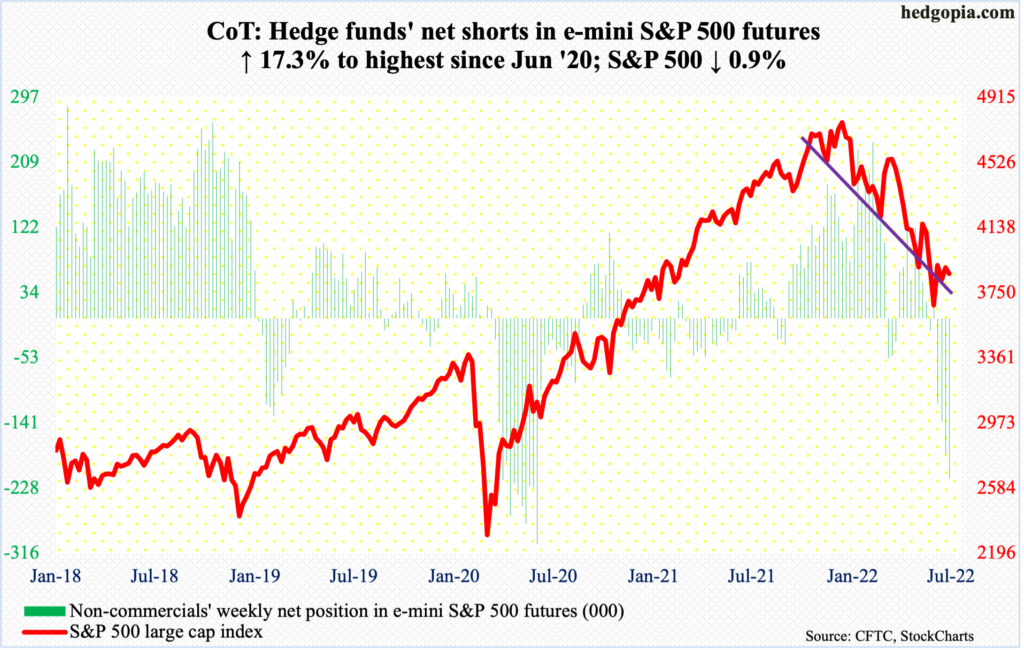
The S&P 500 (3863) continues to consolidate between the June 17th low of 3637 and the June 28th high of 3946. Last week, a lower high of 3918 was posted. This week, the pattern continued as the large can index retreated right from the beginning with Monday’s session high 3881.
The consolation for equity bulls is that the session lows were bought on both Wednesday and Thursday; selling in those sessions was primarily triggered by June’s CPI report and JP Morgan’s (JPM) disappointing 2Q earnings report. This was then followed by Friday’s gap-up marubozu.
In the end, the large cap index reversed from down 4.6 percent at Thursday’s low to down 0.9 percent, for a weekly bullish hammer. The earnings season has just begun, and investors’ willingness to take advantage of selling perhaps bodes well for the weeks ahead.
In this respect, non-commercials, who are now sitting on the highest net shorts since June 2020, can become a catalyst for a rally as they cover.
Incidentally, JPM is suspending its buyback program. This is coming at a time when corporate bond issuance is in decline and S&P 500 buybacks are setting records. Arguably, the current pace is not sustainable (more on this here).
Euro: Currently net short 25.2k, up 8.4k.
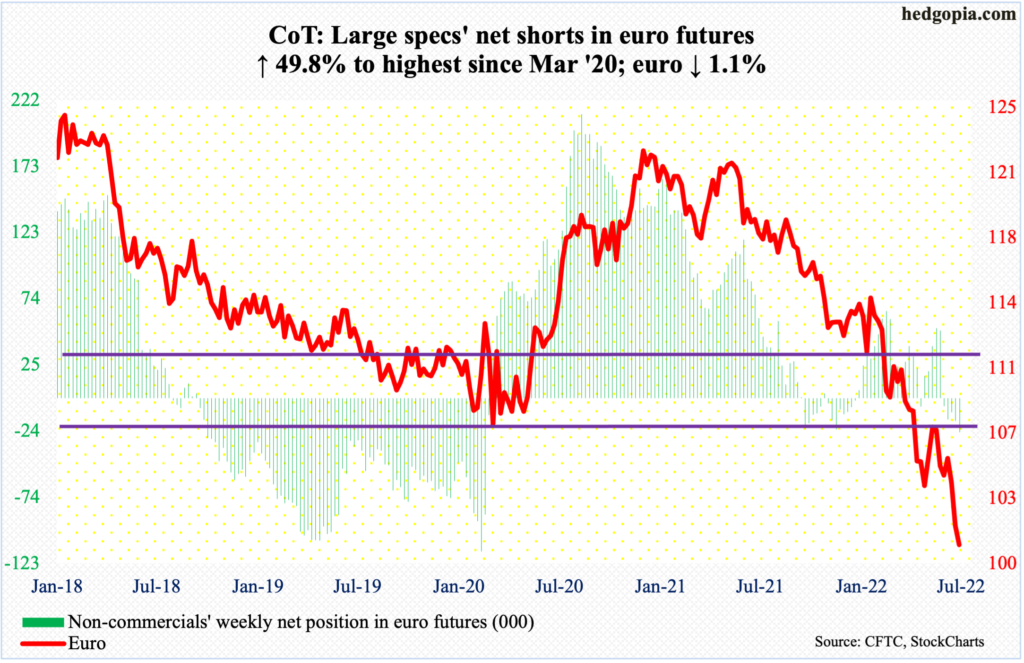
No sooner did the euro lose $104 early this month than selling intensified. On both Wednesday and Thursday, the currency breached parity, touching $0.9998 and $0.9952 intraday respectively. This was the lowest since December 2002.
Back then, after printing a low of a $0.82 in October 2000, the euro was just getting ready for a liftoff. By April 2008, it reached an all-time high of $1.6020. Since that high, it has persistently made lower highs, with the latest taking place in January last year at $1.2345.
Needless to say, the euro ($1.0082) remains oversold on nearly all timeframes. But the fact remains that until the downward momentum ends, it remains bears’ ball to lose. Immediately ahead, there is resistance at $1.0110s.
Gold: Currently net long 118.1k, down 27.5k.
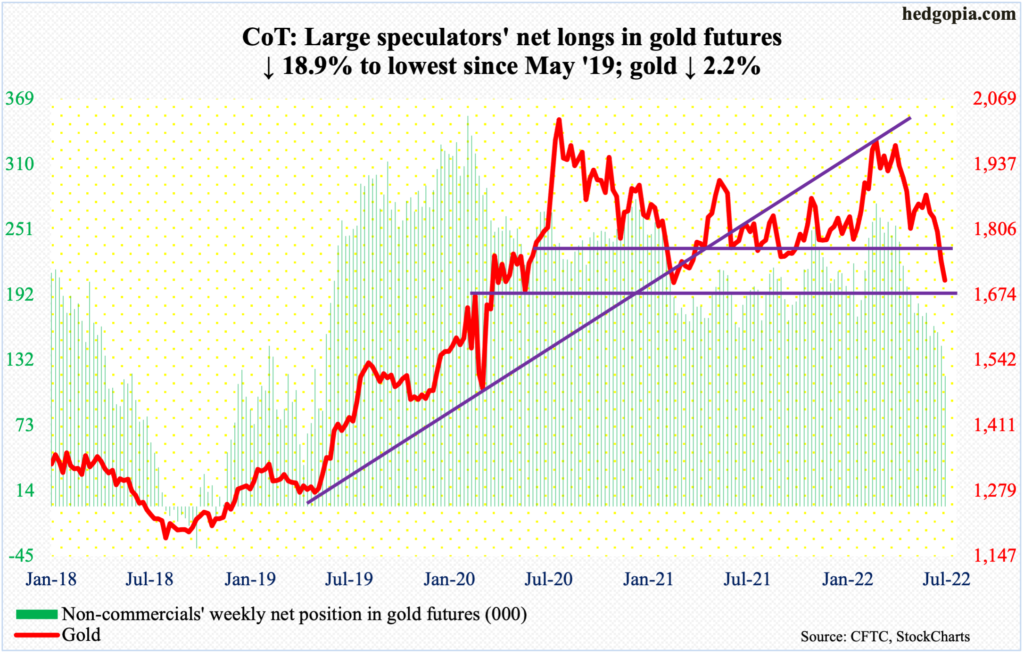
Gold came close to testing lateral support at $1,670s as it dropped as low as $1,695 on Thursday. This week’s action preceded last week’s breach of $1,760s-$1,770s, which acted as an important price point for both bulls and bears going back more than a decade.
Earlier in March (this year), the metal touched $2,079 – just shy of the record high $2,089 set in August 2020. Most recently, gold has been under pressure since June 13 when it was rejected at $1,882 just under the 50-day.
The prevailing downward momentum will get a new lease of life should $1,670s give way. Until that happens, this is a good spot for gold ($1,704/ounce) to try to stabilize.
Nasdaq 100 index (mini): Currently net long 19.4k, down 11.5k.
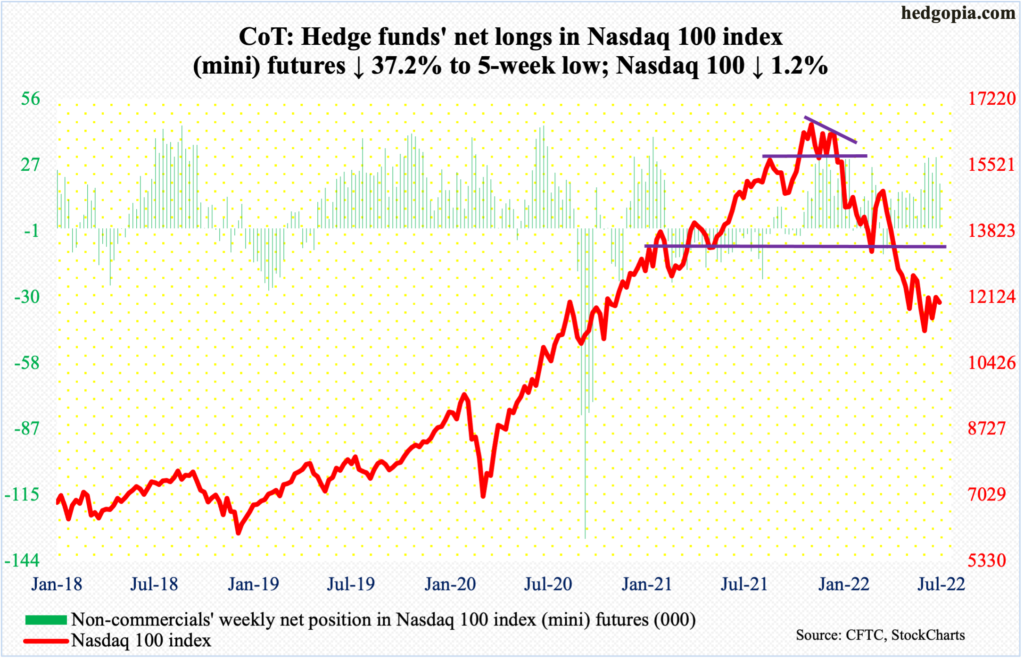
Tech behemoths will begin to report their June quarter in the week after next. Ahead of this, the Nasdaq 100 (11984) remains under pressure, with some encouraging signs in the latter three sessions. On both Wednesday and Thursday, intraday selling was used as an opportunity to go long, although the week ended down 1.2 percent; but at its worst on Thursday, the index was down 5.3 percent.
On June 16, the tech-heavy index tagged 11037, down 34.2 percent from last November’s high 16765. A rising trend line from that low was at risk of breach on Wednesday and Thursday but was saved by close. Amidst this, the daily Bollinger bands have narrowed, which often happens when a sharp move – either up or down – is about to occur. As things stand, this likely resolves to the upside.
Russell 2000 mini-index: Currently net short 117.8k, down 815.
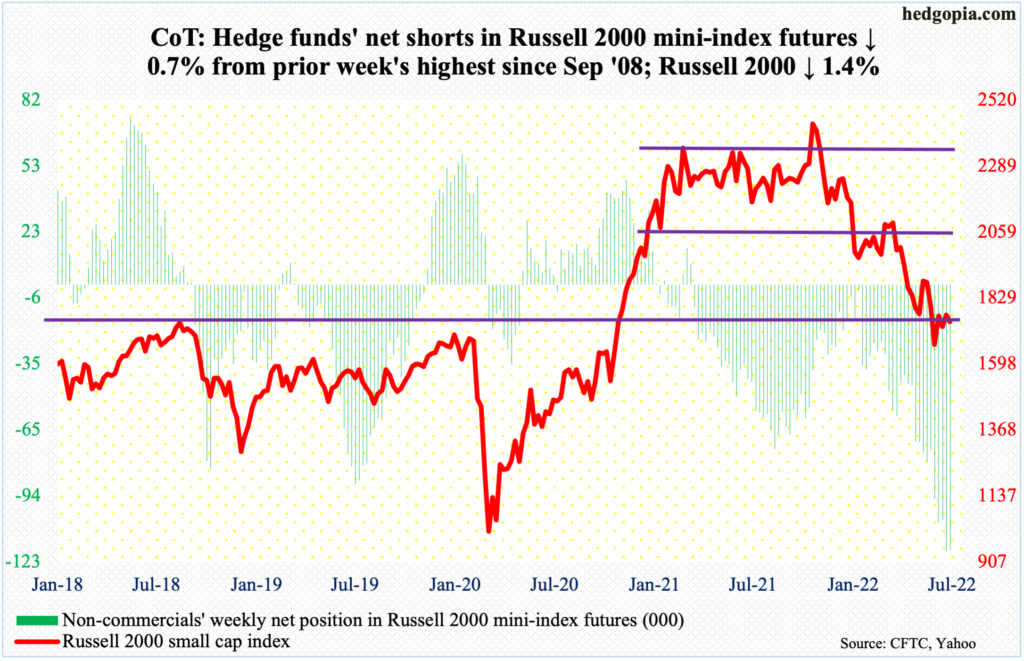
Yet again, 1700 was tested – successfully. On Thursday, the Russell 2000 tagged 1685 intraday before closing the session at 1708. Small-cap bears have tried to reclaim the level for three weeks now – unsuccessfully.
The importance of 1700 owes to the fact that this is where the Russell 2000 broke out of in November 2000. Bulls have been able to defend this after suffering a 33.2-percent plunge between last November’s peak and last month’s trough at 1641.
Defense of 1700 should eventually open the door toward 1900. Earlier, a major breakdown occurred mid-January, losing 2080s; for 10 months, the small cap index (1744) went back and forth between 2080s and 2350s. It then seesawed between 2080s and 1900, followed by a ping pong match between 1900 and 1700.
US Dollar Index: Currently net long 38.4k, down 897.
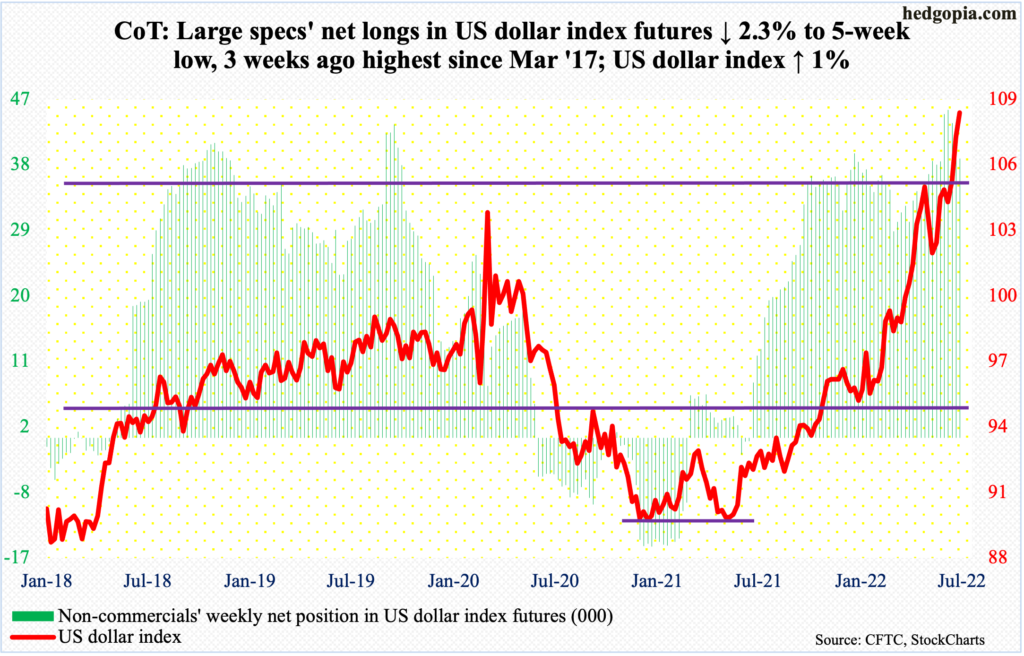
Amidst all the overbought readings, the US dollar index (107.91) continued higher this week, up a percent – its third up week in a row and sixth in seven.
Last week, the index broke out of 105, and out of 104 before that last month; the latter acted as a ceiling going back to January 2017. Before that, it bottomed at 89.17 in January last year, so has come a long way.
Thursday’s intraday high of 109.14 was the highest since June 2002 and came in a shooting star session. Before that on Tuesday and Wednesday, a spinning top formed back-to-back. These are signs that subtle distribution is taking place.
That said, dollar bulls remain in the driver’s seat so long as 104-105 is intact.
VIX: Currently net short 66.4k, up 20.9k.
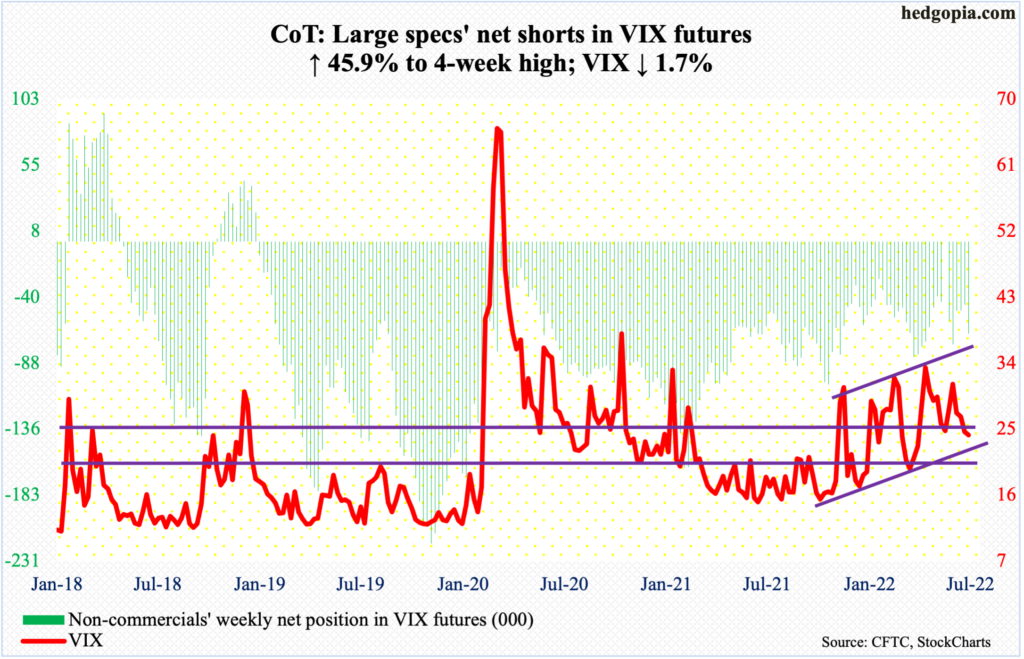
Once again, VIX posted a lower high. Wednesday’s intraday high of 29.06 was a fourth straight lower weekly high. In fact, the volatility index has made lower highs since January (this year) when it ticked 38.94.
This week, VIX struggled at the 50-day on both Wednesday and Thursday, closing the week at 24.23, just above the 200-day at 24.05. A likely breach of the average makes the index vulnerable to a test of low-20s in the sessions ahead.
Perhaps tellingly, VIX was unable to rally this week even though the S&P 500 ended in the red.
Thanks for reading!
