
Following futures positions of non-commercials are as of August 16, 2022.
10-year note: Currently net short 363.1k, up 76.7k.
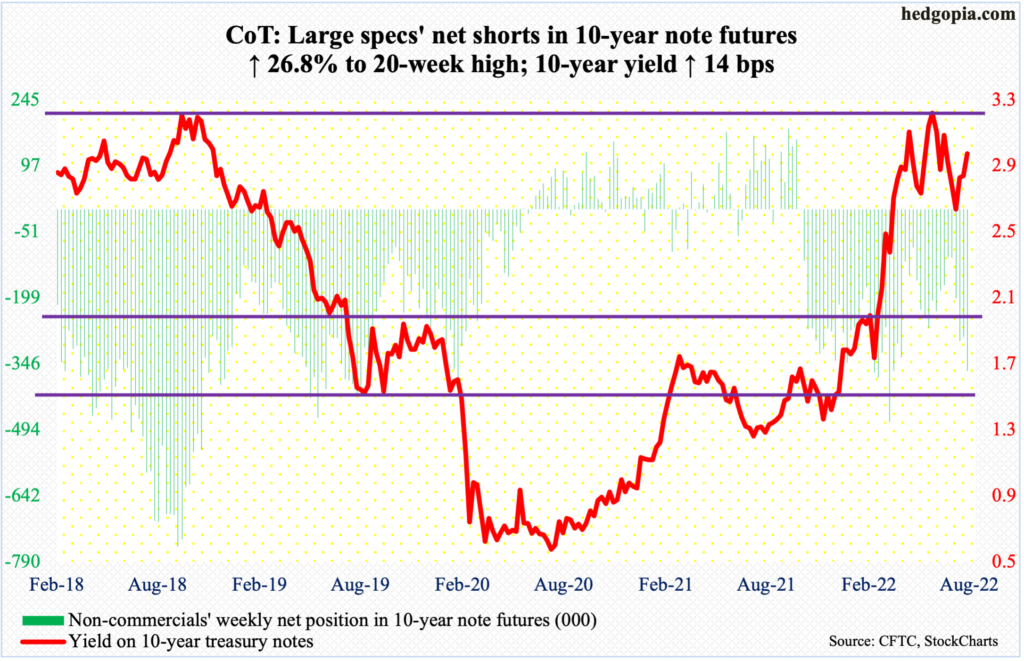
Non-commercials continued to add to net shorts in 10-year note futures. As of last Tuesday, they held 363,128 contracts, up from 108,704 four weeks prior.
The 10-year yield, after having peaked at 3.48 percent on June 14, dipped as low as 2.53 percent on August 2, before rallying. Last week, rates jumped 14 basis points week-over-week to 2.99 percent – past the 50-day moving average at 2.96 percent.
If the weekly prevails, the 10-year can continue higher. In this scenario, 3.2 percent bears watching, as this constitutes the right shoulder of a potentially bearish head-and-shoulder pattern, the neckline of which lies around low-2.70s.
Lower rates mean higher treasury prices and a potential headache for non-commercials.
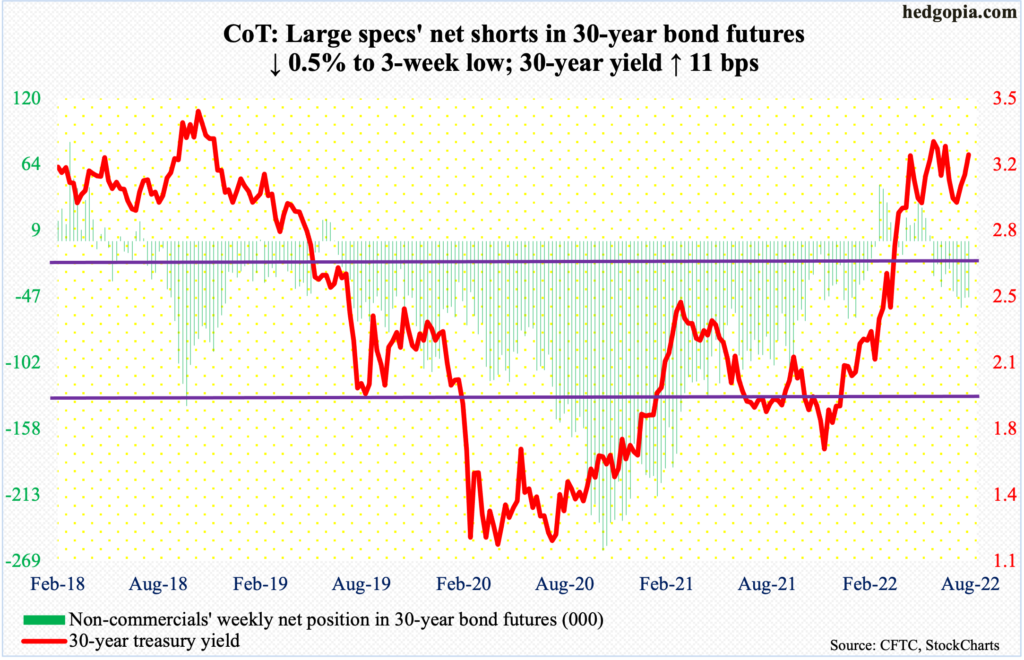
30-year bond: Currently net short 47.3k, down 261.
Major economic releases for this week are as follows.
New home sales (July) are due out on Tuesday. June sales were down eight percent month-over-month to a seasonally adjusted annual rate of 590,000 units, which was a 26-month low.
Durable goods orders (July) are scheduled for Wednesday. Orders for non-defense capital goods ex-aircraft – proxy for business capex plans – rose 0.7 percent m/m in June to $74 billion (SAAR) – a new high.
Thursday brings GDP (2Q22, second estimate). The first estimate showed real GDP contracted 0.9 percent last quarter. This comes on the heels of a 1.6-percent decline in 1Q. This was the first back-to-back decline in economic activity since 1Q-2Q of 2020.
Personal income/spending (July) and the University of Michigan’s consumer sentiment index (August, final) come out on Friday.
In June, headline and core PCE (personal consumption expenditures) increased 6.8 percent and 4.8 percent respectively, with the former the steepest since June 1982 and the latter having peaked at 5.3 percent in February, which was the highest since April 1983.
Preliminarily, consumer sentiment this month increased 3.6 points m/m to 55.1. June’s 50 was the lowest ever (data goes back to January 1978).
WTI crude oil: Currently net long 223.8k, down 7.5k.
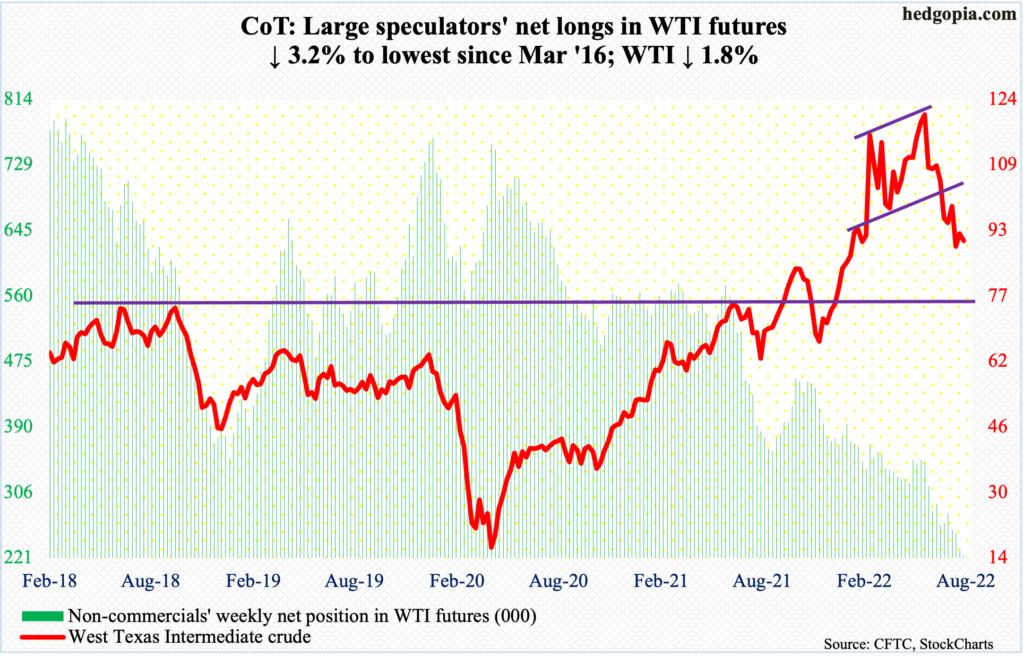
Last week, lateral support at $85, or just underneath, was tested both Tuesday and Wednesday – successfully. This follows a breach in the prior week of horizontal support at $93-$94. Earlier, WTI ($90.44/barrel) peaked at $123.68 on June 14 and before that at $130.50 on March 7. The $93-$94 breach could prove to be important.
From oil bulls’ perspective, the daily is getting oversold. It is only probable they will get another chance to reclaim the level in the sessions ahead. If they fail, $85 becomes relevant again.
In the meantime, per the EIA, US crude production in the week to August 12 fell 100,000 barrels per day to 12.1 million b/p/d. As did crude imports, which decreased 39,000 b/d to 6.1 mb/d. Stocks of crude and gasoline decreased as well, respectively down 7.1 million barrels and 4.6 million barrels to 425 million barrels and 215.7 million barrels. Distillates inventory, however, grew 766,000 barrels to 112.3 million barrels. Refinery utilization dropped eight-tenths of a percentage point to 93.5 percent.
E-mini S&P 500: Currently net short 288k, up 43.7k.
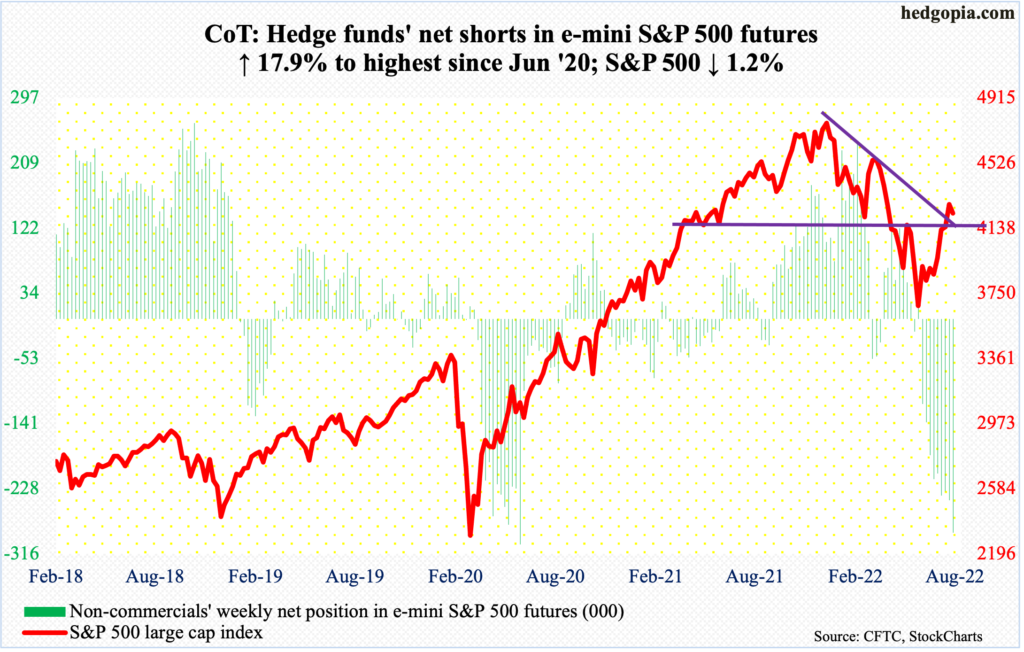
Flows continued to behave. In the week to Wednesday, US-based equity funds took in $7.3 billion (courtesy of Lipper), even as SPY (SPDR S&P 500 ETF), VOO (Vanguard S&P 500 ETF) and IVV (iShares Core S&P 500 ETF) attracted $3.7 billion (courtesy of ETF.com).
In fact, at Tuesday’s intraday high of 4325, the S&P 500 was up 1.1 percent for the week. If this held, this would have been a fifth up week in a row. By the time the week was over, the large cap index gave back 1.2 percent, to 4228.
Sellers showed up at the 200-day (now 4321). Also, at 4367 lies a 61.8-percent Fibonacci retracement of the tumble between the January record high of 4819 and the June low of 3637.
The index likely comes under pressure in the sessions ahead to unwind the overbought daily condition it is in. Nearest support lies at 4150s.
Euro: Currently net short 42.8k, up 8.2k.
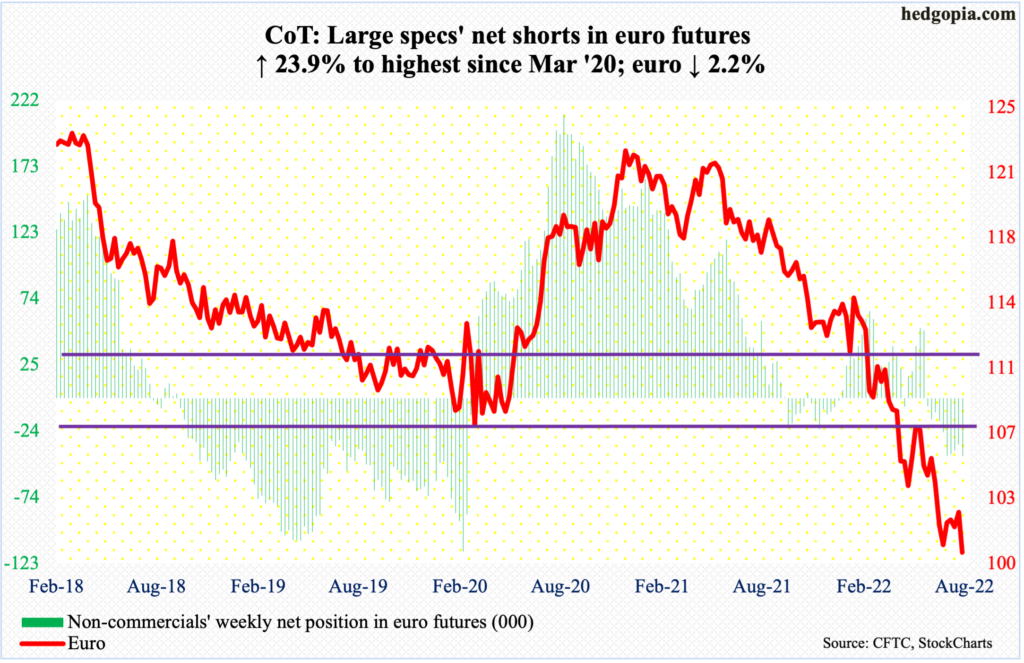
Euro bears last week built on the mini-reversal of the prior week.
On August 10-11, bulls unsuccessfully went after straight-line resistance $1.0350s, which was lost early July. Last week, as soon as the week got underway, the currency breached a rising trend line from July 14 when it bottomed at $0.9952. Earlier, it peaked at $1.2345 in January last year.
Last week, the euro ($1.0042) dropped 2.2 percent. Leading up to this, the daily Bollinger bands had tightened; looks like it is resolving to the downside. Bears are probably eyeing the July low, which by the way was posted in a gravestone doji week.
Gold: Currently net long 141.2k, down 1.7k.
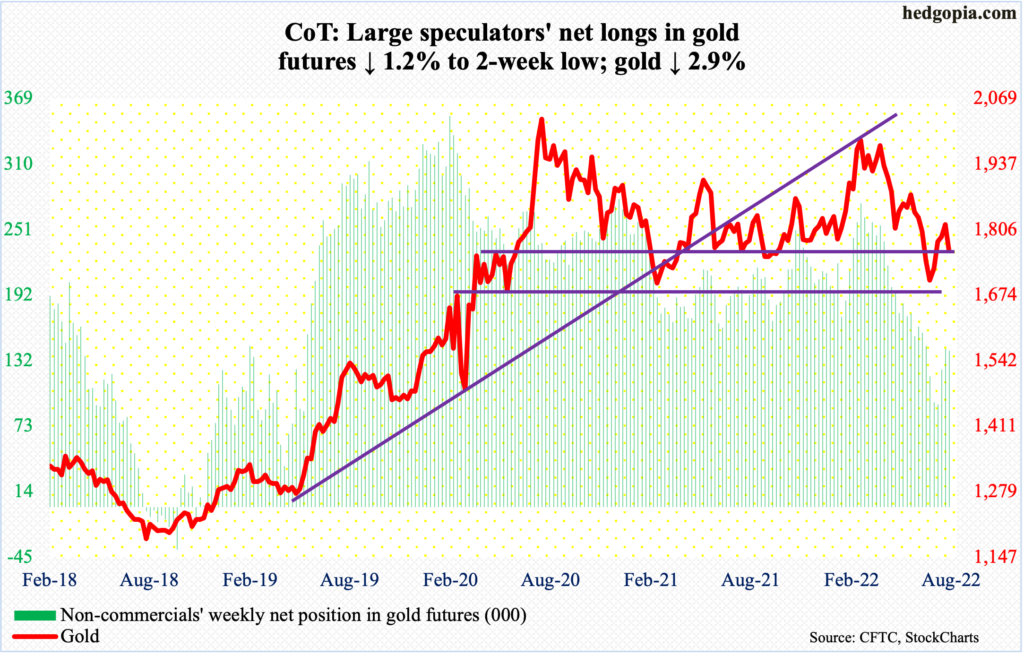
After four consecutive up weeks, gold shed 2.9 percent last week. This preceded a rally between the July 21 bottom at $1,678 and the high of $1,825 on the 10th this month. On the way up, the metal reclaimed $1,760s-$1,770s early this month, but was unable to meaningfully build on it.
Last week, the yellow metal ($1,763) sold off in all five sessions, breaching the 50-day and closing right on $1,760s-$1,770s. Several indicators on the weekly such as the RSI turned down from the median. There is room for gold to continue lower.
Nasdaq 100 index (mini): Currently net long 6.8k, down 14.2k.
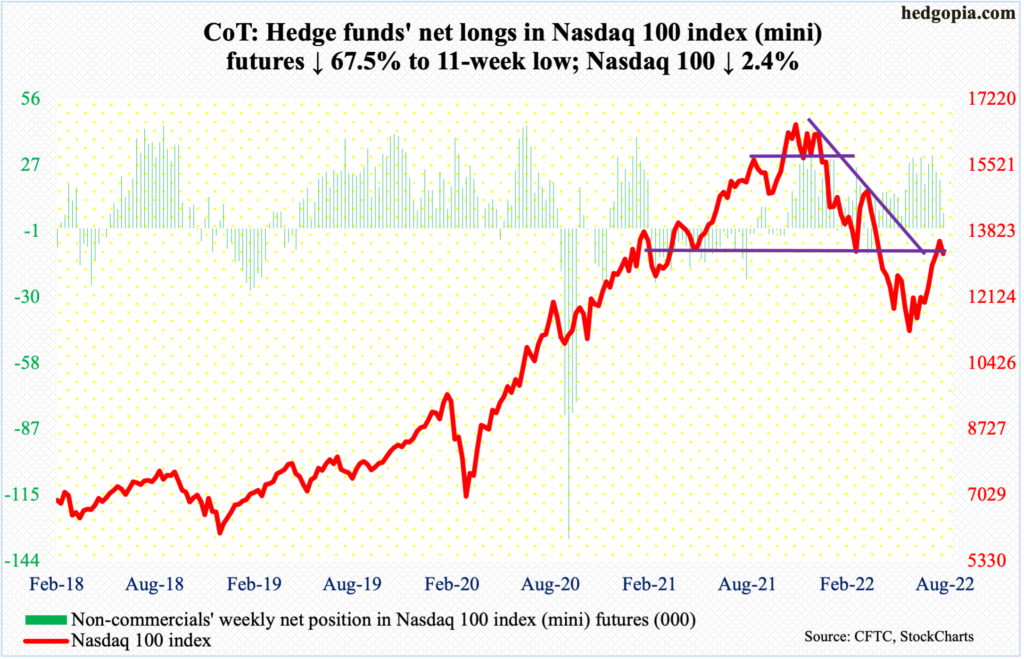
In three of the five sessions last week, there was one long-legged doji and two spinning tops. This followed four up weeks in succession.
Last Tuesday, the Nasdaq 100 rallied as high as 13721. Just above lied the 200-day (now 13998). Then, at 13901 lied a 50-percent retracement of the November 2021 record high of 16765 and the June low of 11037. Bears used this as an opportunity to get active. For the week, the tech-heavy index (13243) fell 2.4 percent. More weakness probably lies ahead.
It is possible non-commercials are anticipating this, as they have been gradually reducing their net longs in Nasdaq 100 index (mini) futures taking advantage of the prior four-week rally.
Nearest support lies at 13000.
Russell 2000 mini-index: Currently net short 116.5k, up 3.6k.
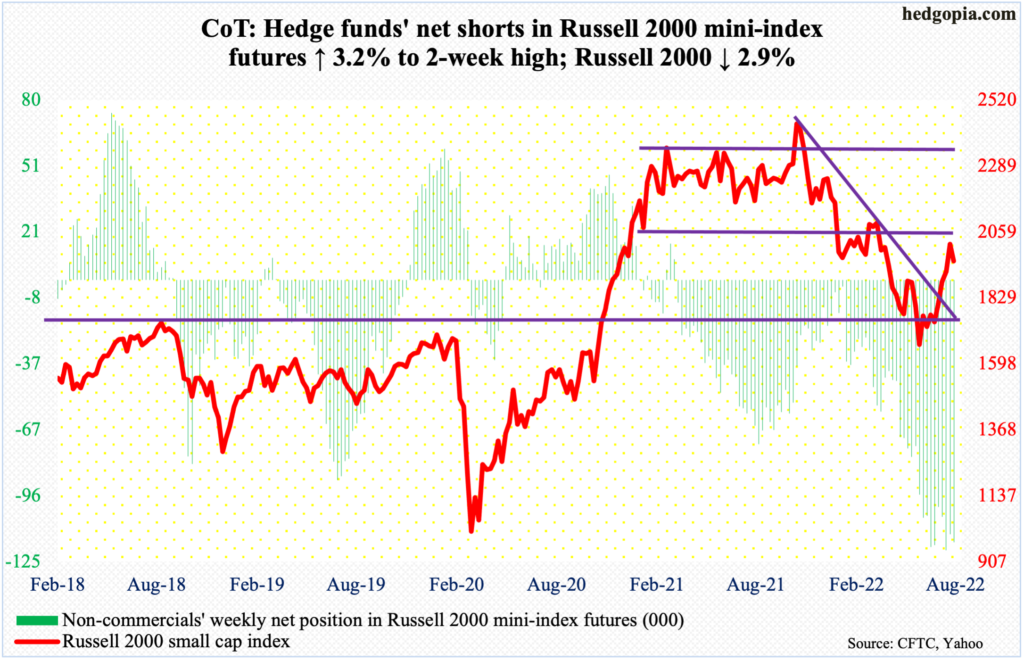
The Russell 2000 on Tuesday tagged 2030 intraday before reversing lower. That is as far as the small cap index went to test 2080s. Friday’s 2.2-percent drop ensured a first weekly decline in five weeks. For the week, it dropped 2.9 percent, to 1957.
A major breakdown occurred mid-January, losing 2080s; for 10 months, the Russell 2000 went back and forth between 2080s and 2350s. It then seesawed between 2080s and 1900, followed by a ping pong match between 1900 and 1700; 1700 is where it broke out of in November 2020. The breakout retest was successful.
Now that a just-about-test of 2080s has been unsuccessful, the risk for small-cap bulls is a trip lower toward 1900.
US Dollar Index: Currently net long 38k, down 676.
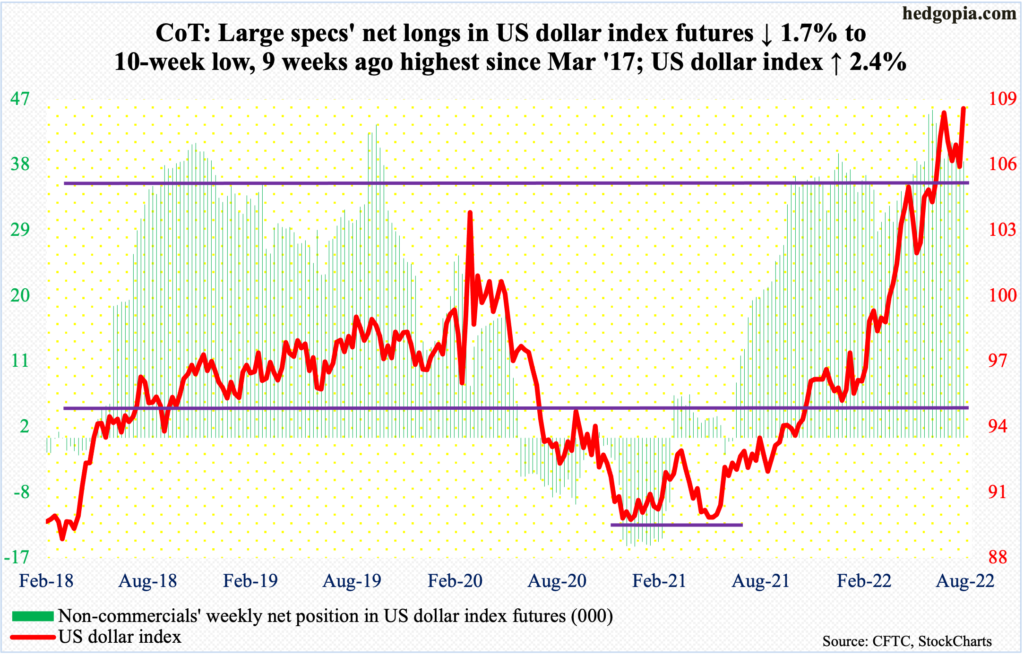
The US dollar index closed up 2.4 percent last week to 108.10. This was a new closing high since October 2002. On an intraday basis, it hit a high of 109.14 in July, which formed a massive shooting star on the monthly.
The drop from that high bottomed at 104.50s on August 10-11; there is major support at 104, which was bought. The rally since has been fierce. A takeout of July’s high will be a major development, and repercussions will be felt across assets should it occur.
VIX: Currently net short 102.2k, up 4k.
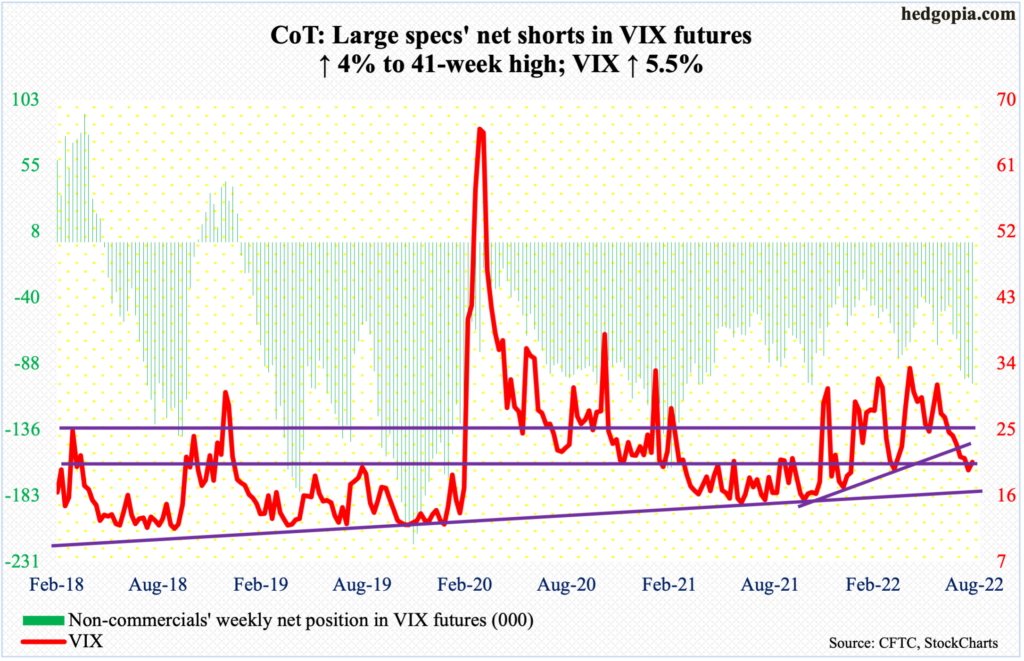
Volatility is perking up. Last week, for the first time in nine weeks, VIX had a positive week. The volatility index looks set to rally.
Last Friday, VIX added 1.04 points to 20.60. In six of the seven prior sessions, it closed sub-20. A rising trend line from November 2017 when VIX made an all-time low of 8.56 would have been tested sub-17 but it never happened.
A potentially bullish crossover just developed on the daily MACD. Once volatility bulls – or equity bears – are able to reclaim low-20s, the path becomes easier toward mid-20s, which is where the 50- and 200-day are merging (25.06 and 24.53 respectively).
Thanks for reading!
