
Following futures positions of non-commercials are as of September 6, 2022.
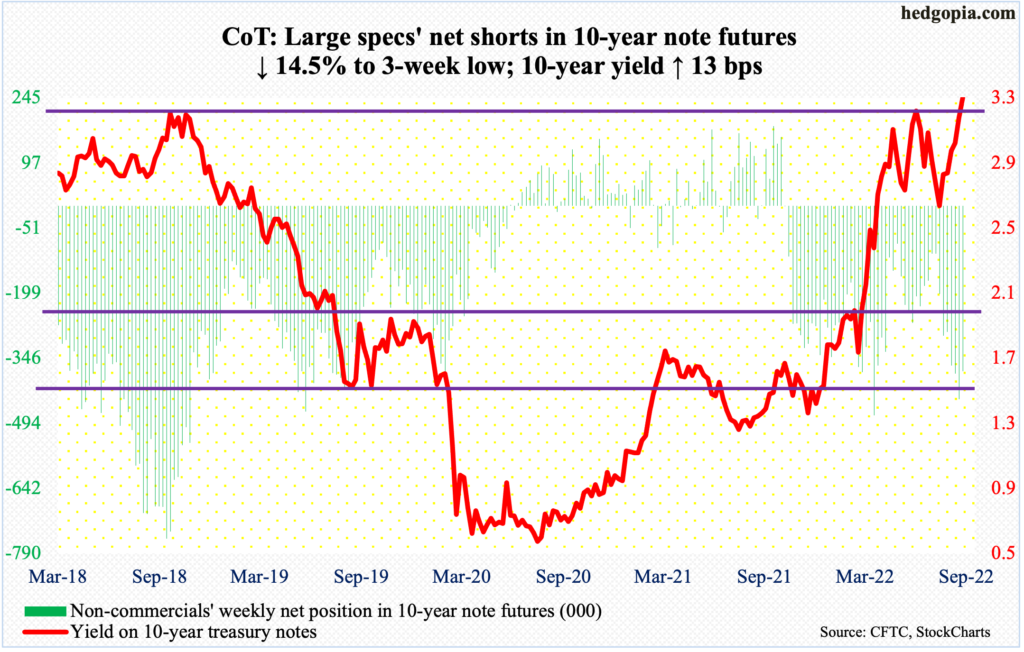
10-year note: Currently net short 376.3k, down 63.8k.
Federal Reserve Chair Jerome Powell had yet another opportunity this week to convince the markets that he and his team are dead serious about the elevated inflation and that they would not let it get out of hand, no matter what the cost to jobs and the economy.
Speaking at the Cato Institute, he said “we need to act now, forthrightly, strongly, as we have been doing and we need to keep at it until the job is done.”
In this month’s FOMC meeting (21-22), futures traders favor a 75-basis-point move with 91-percent probability, followed by another 50 in November (1-2) and a 25 in December (13-14), ending 2022 at a range of 375 basis points and 400 basis points. Markets have taken this in stride.
After four hikes this year, the fed funds rate currently stands at between 225 basis points and 250 basis points.
Once the benchmark rates hit four percent, or thereabouts, the Fed likely pauses, if nothing else just to pacify voices within the FOMC who are cautioning not to overtighten the policy. Lael Brainard, vice-chair, was one such voice on Wednesday.
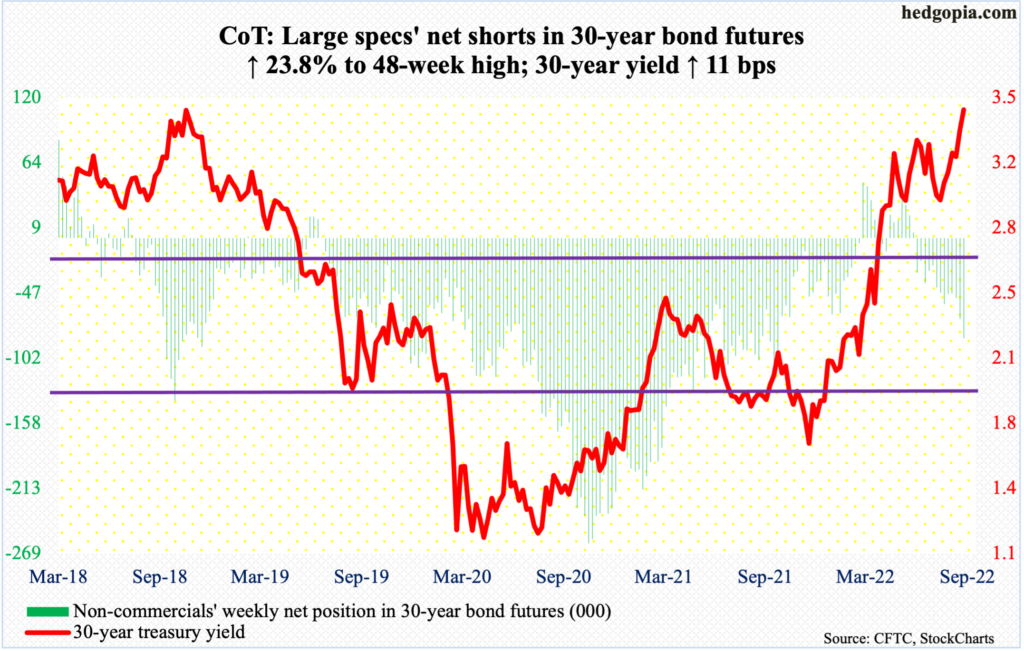
30-year bond: Currently net short 85.2k, up 16.4k.
Major economic releases for next week are as follows.
The NFIB optimism index (August) and the consumer price index (August) are due out on Tuesday.
Small-business optimism increased 0.4 points month-over-month in July to 89.9 – a two-month high.
Headline CPI jumped 8.5 percent year-over-year in July. June’s 9.1 percent was the steepest since November 2981.
The producer price index (August) is scheduled for Wednesday. Wholesale prices rose 9.8 percent y/y in July, slower than March’s record 11.7 percent.
Retail sales (August) and industrial production (August) are on dock for Thursday.
July retail sales were just about flat m/m to a seasonally adjusted annual rate of $682.8 billion – a new record.
Capacity utilization rose 0.4 percent m/m in July to 80.3 percent, which was a 47-month high.
Friday brings the University of Michigan’s consumer sentiment index (September, preliminary) and Treasury International Capital data (July).
Consumer sentiment increased 6.7 points m/m in August to 58.2 – a three-month high.
In the 12 months to June, foreigners sold $231.5 billion in US stocks – quite a reversal from March last year when they were buying a record $404.7 billion worth.
WTI crude oil: Currently net long 231.1k, down 7.9k.

Oil bears kept hammering on lateral support at $85, or just underneath. They have done so for six weeks now. On Wednesday this week, WTI sliced through the support, but not a whole lot of damage was done after that. The crude ticked as low as $81.20 on Thursday and ended the week at $86.79/barrel for a weekly long-legged doji. There is room for it to rally in the sessions ahead.
In the meantime, per the EIA, US crude production in the week to September 2 was unchanged at 12.1 million barrels per day. Crude imports increased 823,000 b/d to 6.8 mb/d. As did stocks of crude, gasoline, and distillates, which respectively rose 8.8 million barrels, 333,000 barrels and 95,000 barrels to 427.2 million barrels, 214.8 million barrels and 111.8 million barrels. Refinery utilization dropped 1.8 percentage points to 90.9 percent.
E-mini S&P 500: Currently net short 238.7k, down 912.

Down for three weeks in a row, the holiday-shortened week began with a down Tuesday, but only to rally fiercely in the next three sessions. Tuesday’s session low 3887 essentially defended a rising trendline from June’s low.
By Friday, the S&P 500 recaptured the 50-day, with the index (4067) remaining under the average for seven sessions. Up 3.6 percent for the week, its nearest resistance lies at 4150s and after that the 200-day at 4275.
Non-commercials’ elevated net shorts are a wild card. At the latest reporting, as of Tuesday, their holdings were only down 0.4 percent from last week’s, but it is possible they covered in the next three sessions. Upward momentum can take on a life of its own should short-covering picks up.
Euro: Currently net short 36.3k, down 11.3k.

After three consecutive down weeks, the euro rallied 0.9 percent this week. The European Central Bank’s 75-basis-point hikes in its key benchmark rates probably helped trader sentiment; this was Thursday. Before that, the currency breached $0.99 intraday Tuesday, tagging $0.9864.
The euro has been in a downtrend since January last year and there is a lot of technical damage done in the process. As things stand, recapturing of $1.01, or just underneath, will be the first step toward damage repair. On Friday, sellers showed up at $1.0094 to close the session at $1.0043.
Gold: Currently net long 103.9k, down 13.9k.

Gold ($1,729/ounce) put together an up-0.3-percent, spinning top week. This follows three down weeks.
It has room to rally on the daily, with the metal trending up this month. Even if that happens, resistance at $1,760s-$1,770s likely draws sellers, as gold has not closed above this horizontal resistance for four weeks now.
Nasdaq 100 index (mini): Currently net long 22k, down 4.8k.
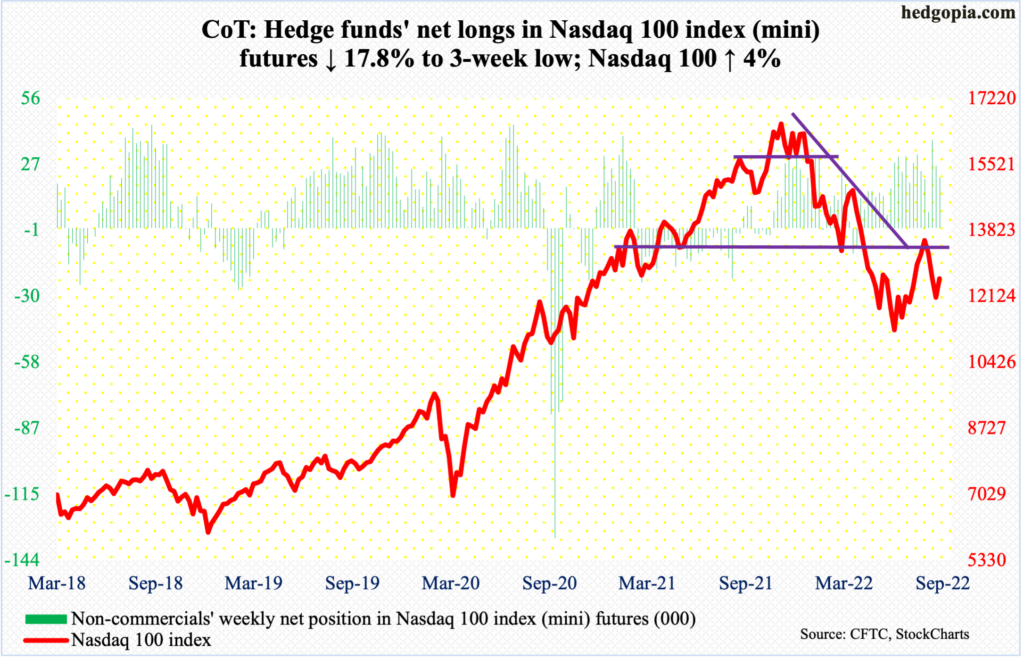
Ending three weeks of declines, the Nasdaq 100 (12588) rallied four percent this week. Odds favor momentum continues up. Nearest decent resistance lies at 13000.
Russell 2000 mini-index: Currently net short 95.6k, up 4.5k.
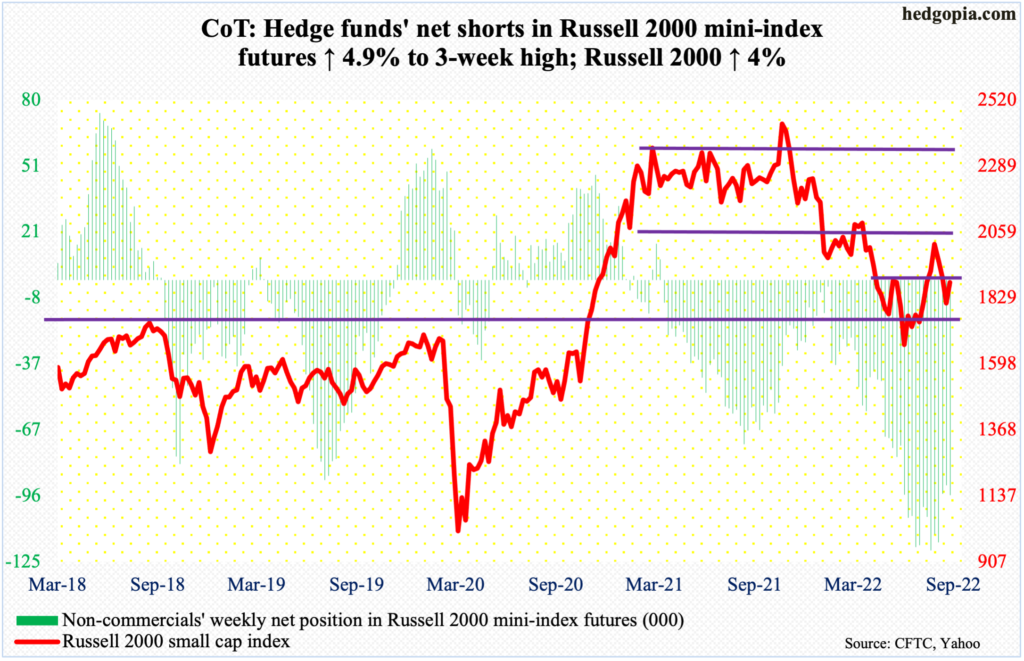
Once again, the Russell 2000 is back at testing 1900 resistance. Last week, it ended just above 1800, which has acted as support/resistance for a few months now. Three sessions of powerful rallies this week brought the small cap index to a level that has proven to be important for a while now.
To recall, a major breakdown occurred mid-January, losing 2080s; for 10 months, the Russell 2000 went back and forth between 2080s and 2350s, followed by a seesaw action between 2080s and 1900 and between 1900 and 1700 after that; 1700 is where it broke out of in November 2020.
Should 1900 get reclaimed in the sessions ahead – likely – the door opens toward 2080s, particularly if the recapturing happens in a decisive manner.
US Dollar Index: Currently net long 36.1k, up 592.

One day before the ECB’s interest rate move, the US dollar index hit 110.78 intraday Wednesday but only to reverse hard; this was the highest print since June 2002. By the end of the week, it shed 0.5 percent, its first down week in four, leaving behind a long upper wick on the weekly. This is also the case on the monthly; September has three more weeks to go, but has so far formed a potentially bearish shooting star.
VIX: Currently net short 88.7k, down 9.2k.
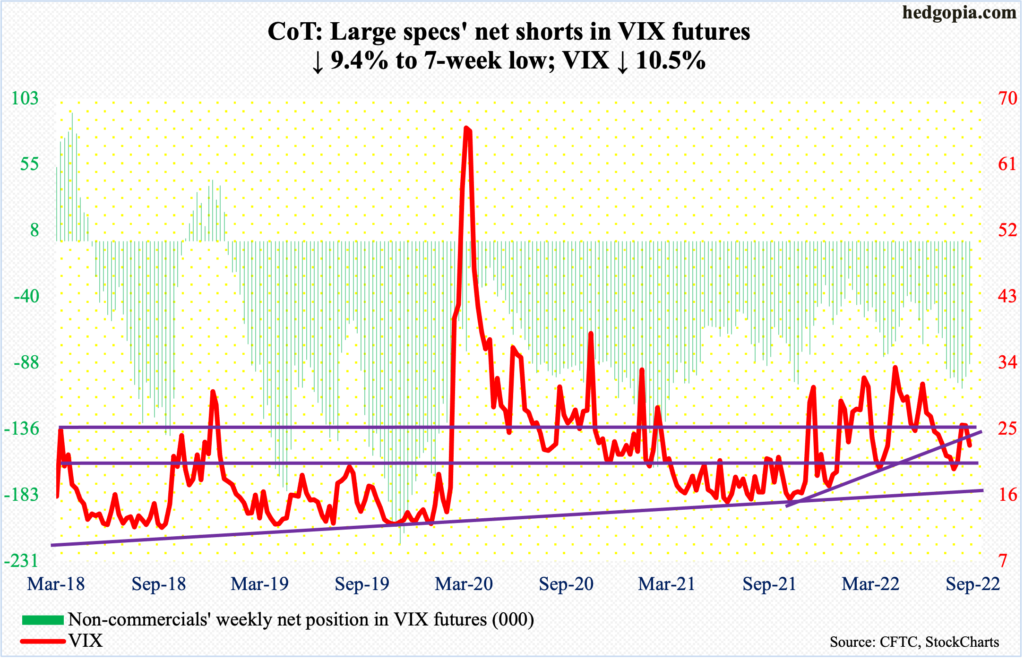
VIX was showing signs of fatigue (more on this here). Despite repeated attempts, the volatility index was unable to take out 27.60s for several sessions through Tuesday. Come Wednesday, volatility began to crater.
When it was all said and done, VIX dropped 2.68 points this week to 22.79. Around 22 lies rising trendline support from last November and after that lies horizontal support at mid-20s. For several sessions last month, VIX breached 20 before stabilizing.
Thanks for reading!
