
Following futures positions of non-commercials are as of October 11, 2022.
10-year note: Currently net short 340.2k, down 26.7k.
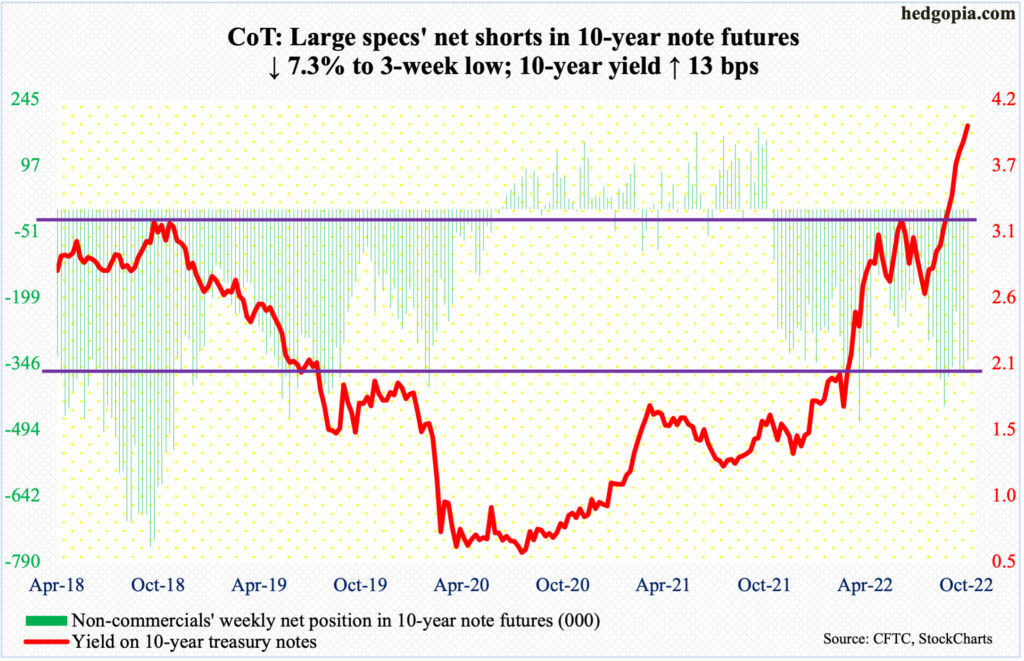
September’s consumer price index, out Thursday, added to upward pressure on the interest-rate trajectory. Last month, headline and core CPI respectively jumped 8.2 percent and 6.6 percent year-over-year (chart here) – higher than expected. Consumer inflation on a headline basis peaked at 9.1 percent in June, with progressively lower prints in the next three months; on a core basis, however, September’s was at a four-decade high.
In the futures market, traders are now nearly 100 percent certain the fed funds rate will be pushed up next month (1-2) by 75 basis points, to a range of 375 basis points to 400 basis points. That said, even before the CPI print, the majority did expect the Fed to move by 75 next month. What was not expected was how December (13-14) evolved. Post-CPI, traders are now betting with a 70-percent probability that the benchmark rates will be raised by another 75, ending the year between 450 basis points and 475 basis points. To boot, they are getting ready for one more hike in February (31-1) – by 25 basis points – before rates go sideways.
In keeping with the outlook for short rates, the long end of the treasury yield curve rallied as well on Thursday, with the 10-year yield rising five basis points to 3.95 percent, although rates reached as high as 4.08 percent intraday, which was a 14-year high. It is too soon to say if Thursday’s intraday reversal is a major development. Time will tell. Yields did end the week at 4.01 percent. But this much we know. With the Fed continuing to tighten and most of the hikes yet to filter through to the economy, as each month passes, a peak in inflation, which will happen eventually, gets nearer. It is probable rates will peak before that eventuality.
30-year bond: Currently net short 83.8k, down 19.7k.

Major economic releases for next week are as follows.
On Tuesday, industrial production (September), the NAHB housing market index (October) and Treasury International Capital data (August) are on tap.
Capacity utilization dropped 0.3 percent month-over-month in August to 80 percent. Four of the five readings since April, when utilization hit a 43-month high 80.2 percent, have been 80 percent or higher.
Homebuilder optimism in September fell three points m/m to 46 – a 28-month low.
In the 12 months to July, foreigners sold $257.5 billion in US stocks, which is quite a reversal from March last year when they bought a record $404.7 billion worth.
Housing starts (September) will be published on Wednesday. Starts jumped 12.2 percent m/m to a seasonally adjusted annual rate of 1.6 million units although July’s 1.4 million was a 23-month low. As recently as April, starts were 1.8 million.
Thursday brings existing home sales (September). August sales came in at 4.8 million (SAAR), down 0.4 percent m/m and down 19.9 percent y/y. In January, sales hit 6.5 million.
WTI crude oil: Currently net long 276k, up 22.3k.

After last week’s 16.5-percent jump, WTI this week was in digestion mode, dropping 7.6 percent to $85.61/barrel. Horizontal resistance at $93-$94 held, with Monday ticking $93.64 intraday.
From oil bulls’ perspective, the good thing is that lateral support at $85 drew bids intraday Thursday when the crude tagged $85.56.
For now, WTI could very well be rangebound between $93-$94 and $85, until a break occurs, either up or down.
In the meantime, per the EIA, US crude production in the week to October 7 fell 100,000 barrels per day to 11.9 million b/d. Crude imports, on the other hand, increased 116,000 b/d to 6.1 mb/d. As did stocks of crude and gasoline, which respectively grew 9.9 million barrels and two million barrels to 439.1 million barrels and 209.5 million barrels. Distillate stocks decreased 4.9 million barrels to 106.1 million barrels. Refinery utilization dropped 1.4 percentage points to 89.9 percent.
E-mini S&P 500: Currently net short 164.1k, down 45.2k.

Thursday’s intraday reversal was one of a kind; down 2.4 percent at one time, the S&P 500 closed up 2.6 percent. For the week, the large cap index vacillated between up two percent to down 4.1 percent to close down 1.5 percent.
Flows continued not to cooperate. In the week to Wednesday, another $2.7 billion left US equity funds (courtesy of Lipper). This was the eighth consecutive weekly outflows, during which $58.7 billion was redeemed.
Thursday’s reversal came at an important spot. The session low of 3492 approximates a 50-percent retracement of the March 2020 low (2192) and the January 2022 high (4819). But bulls were unable to build on it, as Friday’s early rally attempt was rejected at 3710s, ending the week at 3583.
The 3Q earnings season has just begun and September’s PCE report is not due out until the 28th. In this environment, a takeout of Friday’s high should help the bullish cause, while a loss of 3500 can open the door toward 3390s, which was the high back in February 2020 before plunging.
Euro: Currently net long 37.5k, down 6.2k.
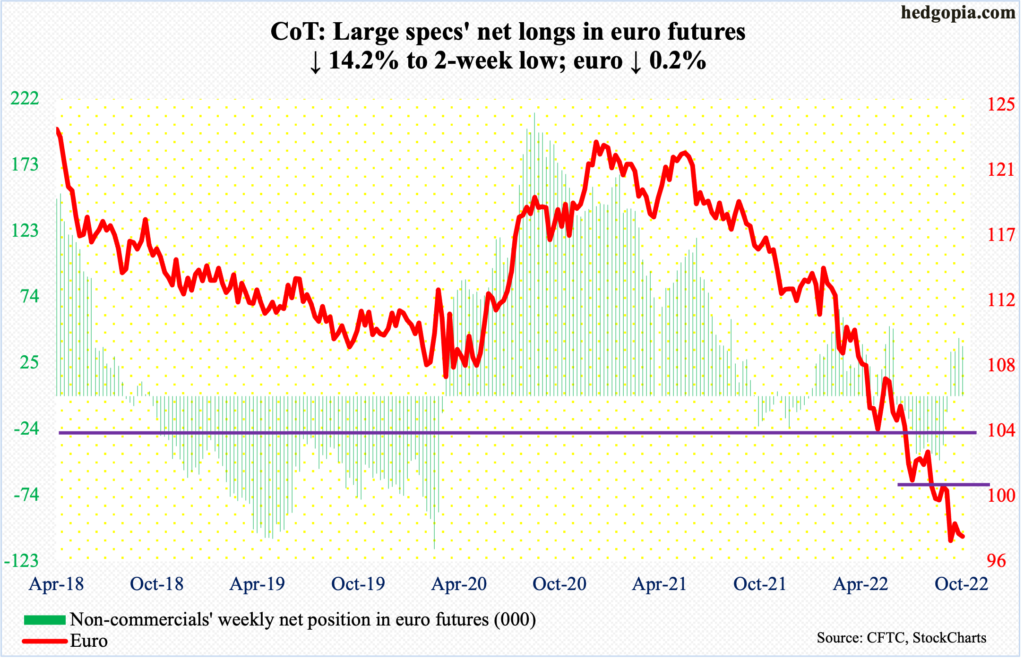
The euro fell 0.2 percent this week to $0.9721. This week’s spinning top followed last week’s shooting star. Before that, the currency reversed higher after touching $0.9559 intra-week, which was the lowest since June 2002. That low has the potential to be an important low.
Immediately ahead, there is gap-down resistance at $0.9810s, followed by $0.9910s. Then comes the all-important $1.04, which was lost in July.
Gold: Currently net long 94.4k, up 6k.
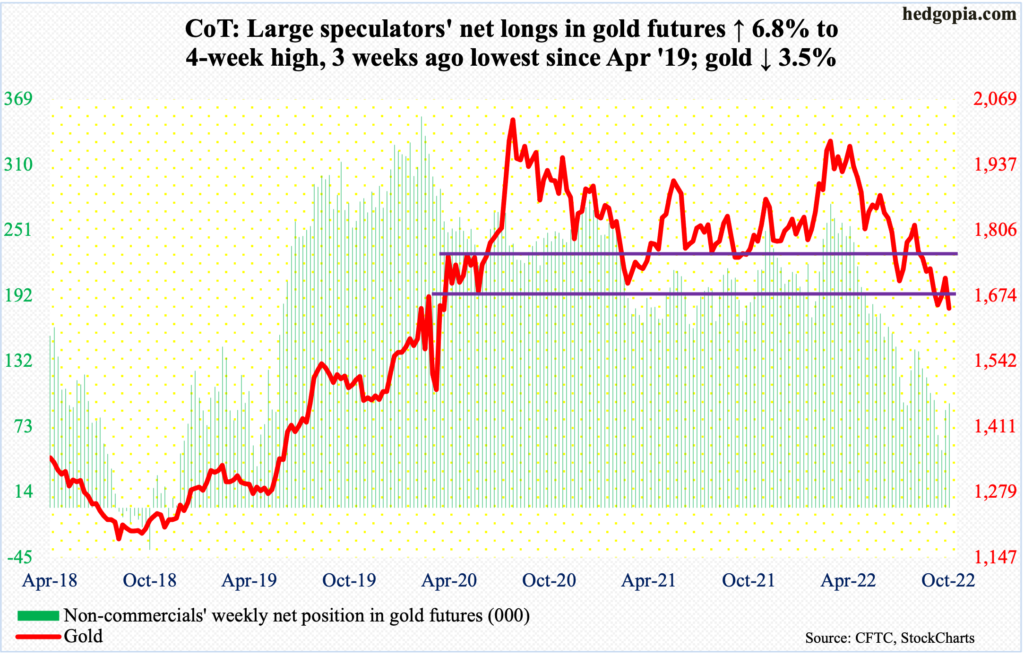
Once again, gold ($1,649/ounce) is back at testing a crucial support. In fact, $1,660s-$1,670s has been slightly breached, but not decisively yet. This level, going back to the early months of 2020, was tested several times, including this July.
On September 28, the metal fell as low as $1,622 before rallying. Last Tuesday, gold tagged $1,739, just falling short of crucial resistance at $1,760s-$1,770s.
A decisive loss of $1,660s-$1,670s may eventually open the door toward $1,560s. Worse, longer-term, there is dual support at $1,360s – horizontal going back to the latter months of 2010 and a rising trendline from December 2015 when gold bottomed at $1,045.
Nasdaq 100 index (mini): Currently net long 8.5k, up 12.3k.

In March 2020, the Nasdaq 100 bottomed at 6772. The tech-heavy index then proceeded to rally to 16765, which was reached last November. A 61.8-percent Fibonacci retracement of the surge lies at 10589.
On Thursday, the index tagged 10441, before a floodgate of buy orders appeared, closing the session at 11034. It was a volatile week. When it was all said and done, the Nasdaq 100 was down 3.1 percent, to 10692.
Thus far, the June low of 11037 is attracting offers, and that is worrisome for tech bulls, especially ahead of the upcoming earnings reports from the major US tech companies.
Russell 2000 mini-index: Currently net short 85.6k, down 13.6k.
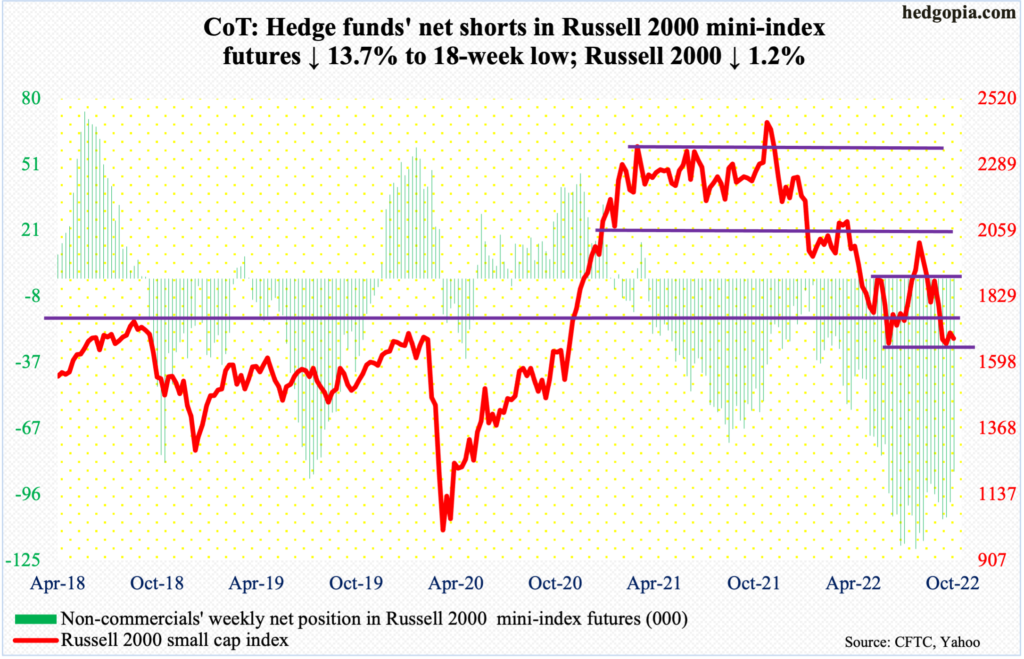
Intraday Thursday, the Russell 2000 ticked 1641.94, a touch above the June 16 low of 1641.47, meaning the June low is not yet breached. In contrast, both the S&P 500 and Nasdaq 100 have already breached their respective June lows.
That said, the small cap index has been unable to lift off of crucial 1700, which goes back to 2018 and this is where a breakout occurred in November 2020. The area was tested as far back as May this year, and it still continues. Last week, the index closed out the week at 1682.
A decisive recapturing of 1700 opens the door toward 1800, and then 1900. Bulls cannot afford to lose 1640s.
US Dollar Index: Currently net long 32.8k, up 1.1k.
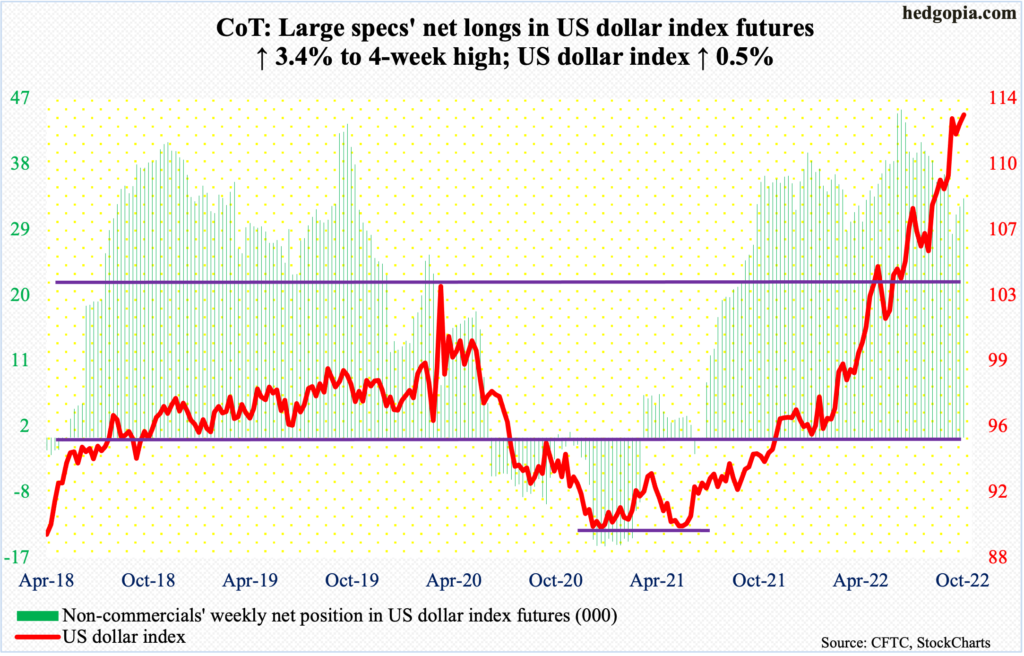
Amidst all the intra-week volatility, the US dollar index this week managed to rally 0.5 percent anyway.
On Thursday, the index ticked 113.85 before reversing hard, closing the week at 113.20. With this, a reversal-looking weekly candle two weeks ago when the US dollar index touched 114.75 – the highest since May 2002 – remains intact.
In the event of downward pressure, nearest support lies at 109.10s, followed by the all-important 104.
VIX: Currently net short 74.1k, up 4.5k.
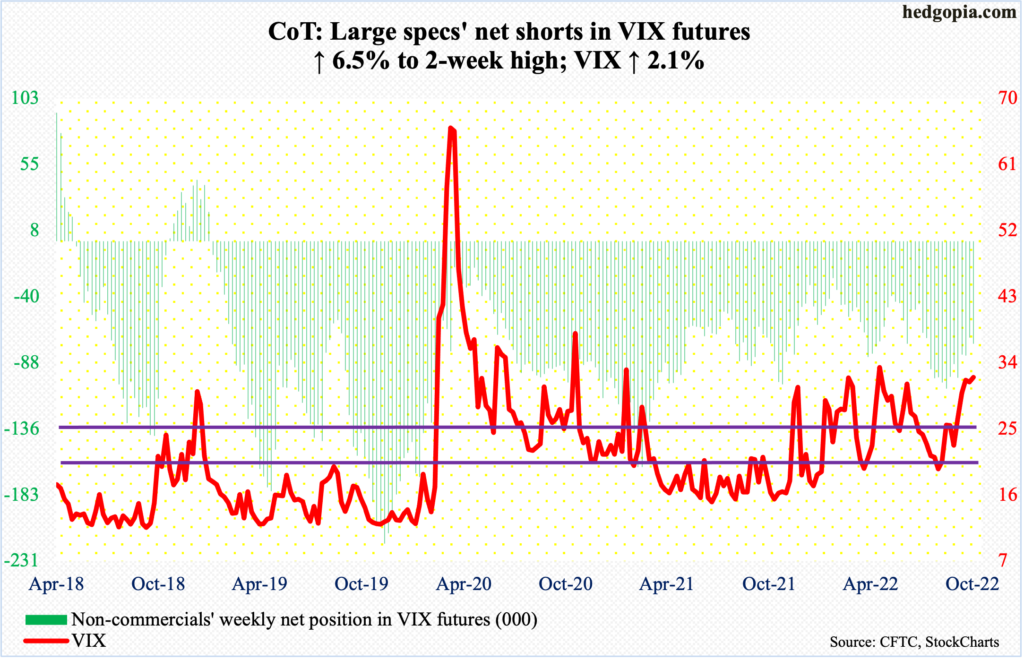
Two of the five daily candles this week were spinning tops, one left behind a long upper wick, one was a long-legged doji and one a large red candle. VIX acts like it is fatigued. These candles are showing up after a decent rally. For several sessions mid-August, the volatility index languished sub-20. On September 28, VIX tagged 34.88. This week’s high of 34.53, set on Wednesday, just about tested that high – unsuccessfully. It closed the week at 32.02.
Volatility bulls need to take out 35 and the bears will take notice. Historically, volatility does not peak until non-commercials either go net long or get close. As of Tuesday, these traders were still net short 74,063 contracts.
Thanks for reading!
