
Following futures positions of non-commercials are as of October 25, 2022.
10-year note: Currently net short 247.7k, down 65.7k.
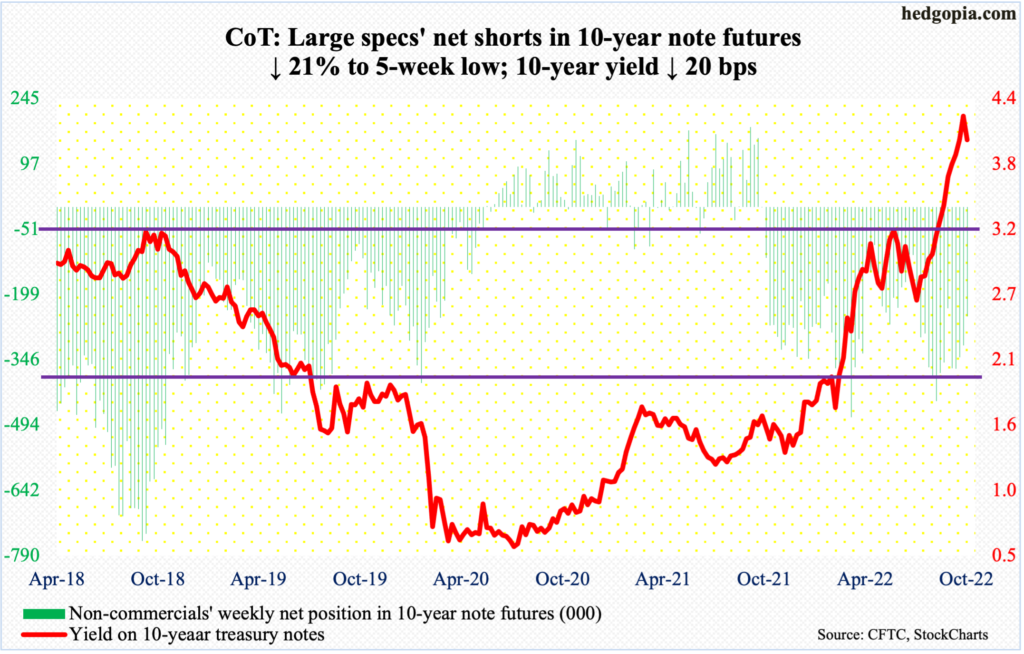
The FOMC meets this week. The November 1-2 meeting is the year’s seventh scheduled meeting. One more remains after this – slated for December 13-14.
A 75-basis-point hike is pretty much a done deal, pushing the fed funds rate to a range of 375 basis points to 400 basis points. Markets will be more interested in what the post-meeting statement/Chair Jerome Powell will say about the interest-rate outlook. Until recently, another 75 was expected in December; now, futures are split between a 75 and a 50.
Consumer inflation is yet to take a decidedly lower turn, but several of the Fed’s overseas peers are softening their stance. Last week, the Bank of Canada raised its benchmark rates by 50 basis points, not the 75 as was expected.
Before this, early this month, the Reserve Bank of Australia hiked by a smaller-than-expected 25 basis points. Even before that, the Bank of England had to step in to calm a nervous market by purchasing long-term government bonds.
This nothing but creates hopes of dovish central bank pivots. US stocks are once again beginning to bet that the Fed will be slowing down the pace of hikes sooner than later – if not an outright pivot. They will be dealt a surprise if the Fed maintains its hawkish stance come Wednesday.
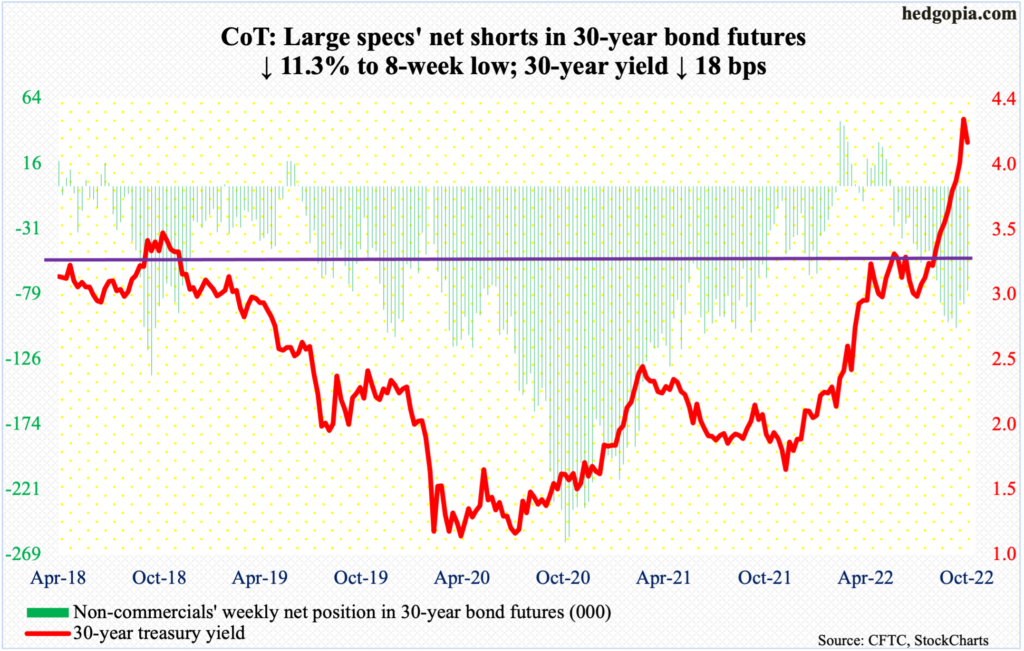
30-year bond: Currently net short 76.6k, down 9.8k.
Major economic releases for this week are as follows.
The ISM manufacturing index (October) and job openings (JOLTs, September) are due out Tuesday.
Manufacturing activity dropped 1.9 percentage points month-over-month in September to 50.9 percent.
Non-farm openings declined 1.1 million m/m in August to 10.1 million. The series’ record high 11.9 million was established in March.
Thursday brings labor productivity (3Q22), durable goods orders (September, final) and the ISM non-manufacturing index (October).
Non-farm output per hour shrank 2.4 percent year-over-year in 2Q – the most quarterly contraction in productivity ever.
September’s preliminary numbers showed orders for non-defense capital goods ex-aircraft – proxy for business capex plans – fell 0.7 percent m/m to a seasonally adjusted annual rate of $74.8 billion. August’s $75.3 billion was a record.
Services activity in September dropped two-tenths of a percentage point m/m to 56.7 percent.
Payrolls (October) are scheduled for Friday. In the first nine months this year, 3.8 million non-farm jobs have been created, for a monthly average of 420,000, down from last year’s monthly average of 562,000.
WTI crude oil: Currently net long 261.7k, up 6.1k.

Last week, horizontal support at $85 was breached intraday Monday and Tuesday but saved by close. By Wednesday, the 50-day was recaptured.
WTI ($87.90/barrel) is in no-man’s land right now – could go either way. In the best of circumstances, oil bulls have a shot at $93-$94, where resistance goes back to at least January this year; sellers showed up there early this month.
In the meantime, per the EIA, US crude production in the week to October 21 was unchanged week-over-week at 12 million barrels per day. Crude imports, on the other hand, increased 272,000 b/d to 6.2 mb/d. As did stocks of crude and distillates, which respectively grew 2.6 million barrels and 170,000 barrels to 439.9 million barrels and 106.4 million barrels. Gasoline stocks dropped 1.5 million barrels to 207.9 million barrels. Refinery utilization dropped six-tenths of a percentage point to 88.9 percent.
E-mini S&P 500: Currently net short 219.1k, down 4.1k.
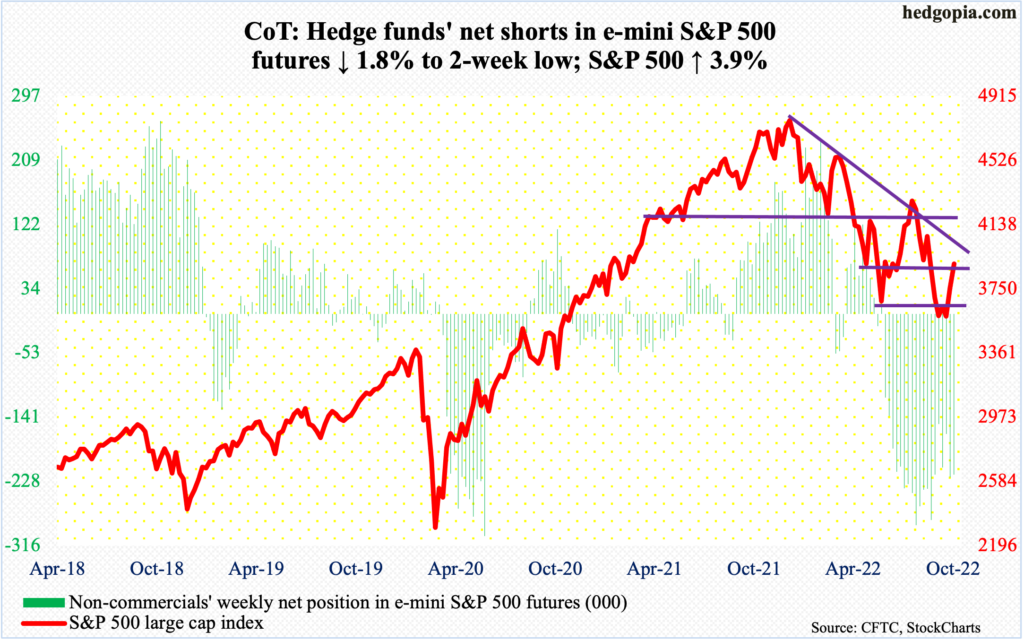
Flows continued to cooperate. In the week to last Wednesday, $7.8 billion moved into US-based equity funds; in the prior week, inflows were $4.1 billion. This followed withdrawals of $58.7 billion in eight straight weeks (courtesy of Lipper). Likewise, in the week to last Wednesday, SPY (SPDR S&P 500 ETF), VOO (Vanguard S&P 500 ETF) and IVV (iShares Core S&P 500 ETF) combined took in $5.9 billion; these ETFs have seen inflows for six weeks now, for a total $28.3 billion (courtesy of ETF.com).
The S&P 500 jumped 3.9 percent last week to 3901, past the 50-day at 3842. The daily is extended, but should the weekly take over, bulls have a shot just north of 4100, which is where a falling trend line from January’s record high lies; this is also where the 200-day (4113) rests. Wednesday is key.
Euro: Currently net long 74.9k, up 26.8k.
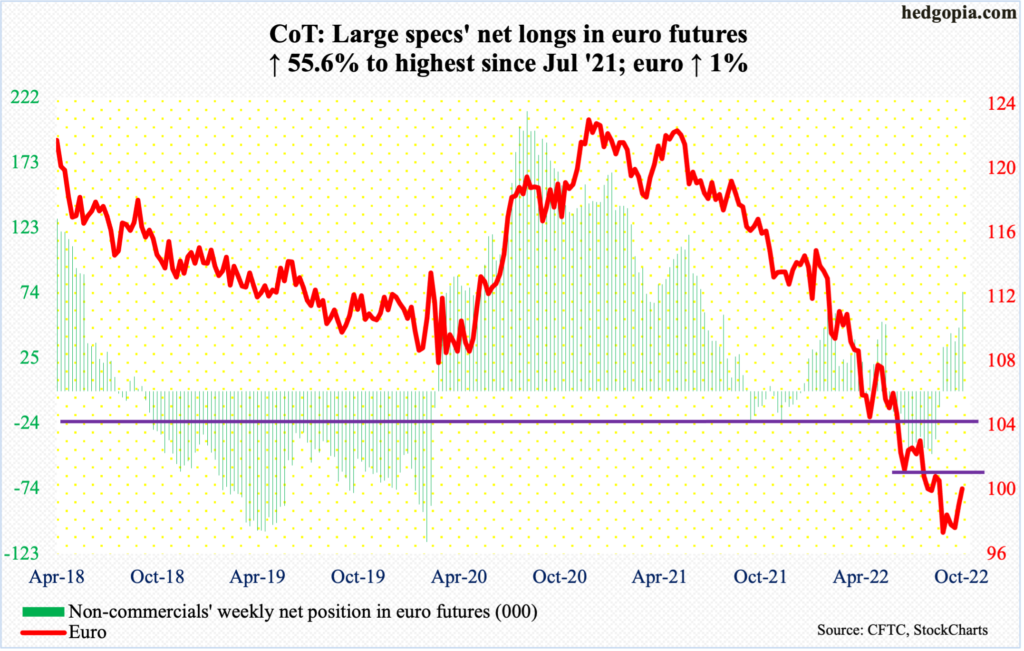
For the first time since May, the euro ($0.9965) rallied back-to-back, up one percent last week and 1.4 percent before that.
The constructive action in recent weeks preceded a 21-month collapse, peaking at $1.2345 in January last year and bottoming last month at $0.9559, which was the lowest since June 2002. That low has the potential to be an important low.
Euro bulls, however, were unable to cling on to all of last week’s gains, with the currency having tagged $1.0089 on Wednesday. This is an area where euro bears have been active at least the past couple of months. Once this gives way, then comes the all-important $1.04.
Gold: Currently net long 68k, down 8.9k.
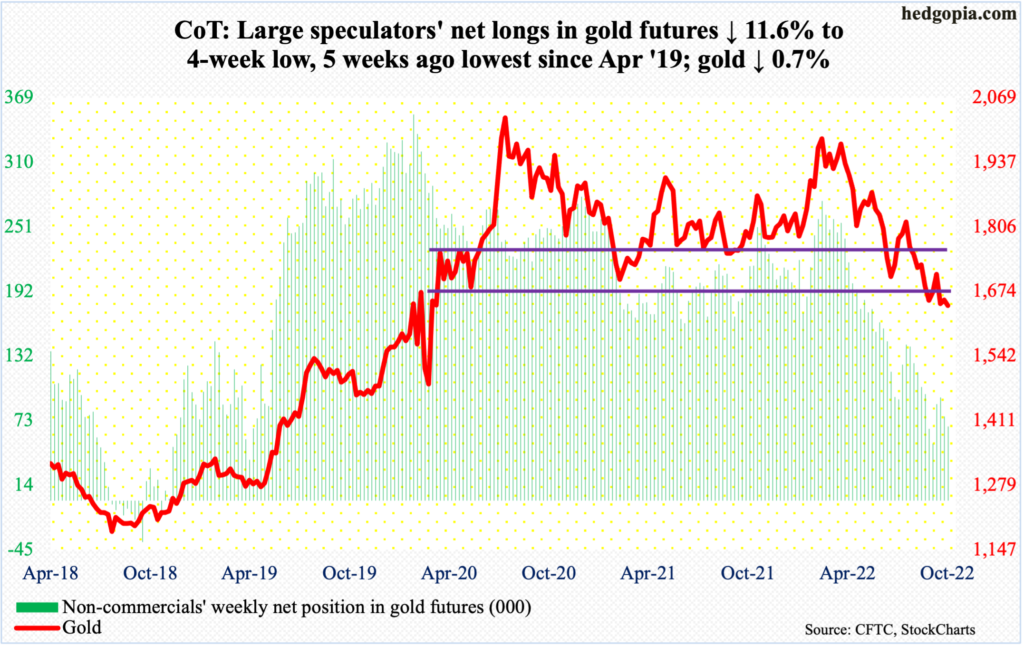
Gold just cannot get going. For several sessions last week, the metal ($1,645/ounce) attracted sellers at $1,660s-$1,670s. At this stage, the low of $1,620s posted in both September and October has gained in significance. A decisive breach exposes gold to a test of $1,560s.
Worse, longer-term, there is dual support at $1,360s – horizontal going back to the latter months of 2010 and a rising trendline from December 2015 when gold bottomed at $1,045.
Nasdaq 100 index (mini): Currently net long 5.7k, up 4.2k.
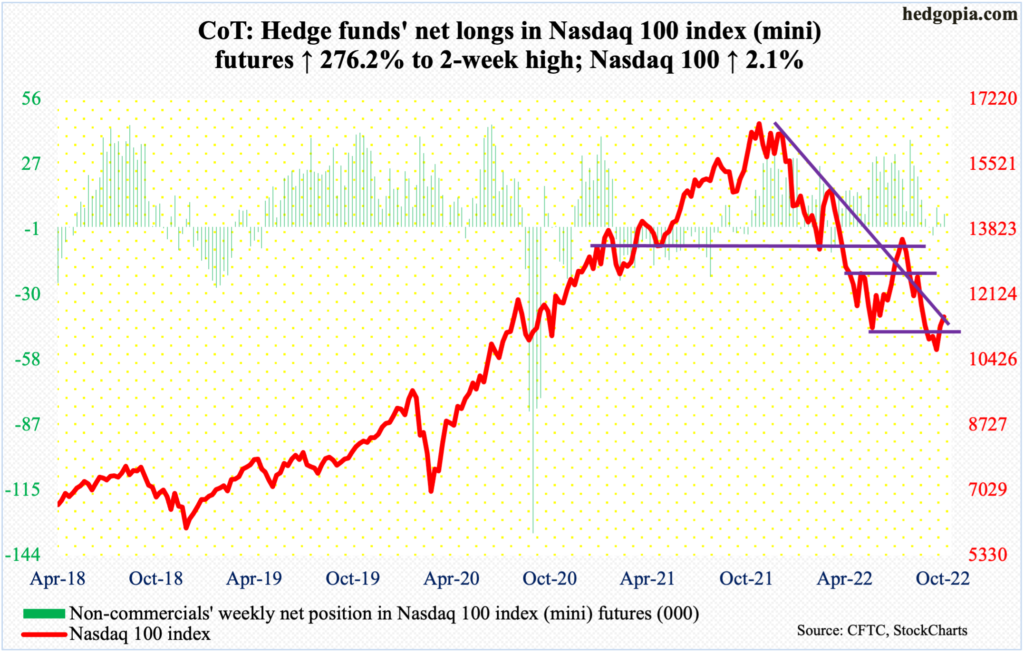
The Nasdaq 100 was an underperformer last week – up only 2.1 percent. Several of the leading US tech outfits delivered weaker-than-expected results, the chief among them being Amazon.com (AMZN).
The tech-heavy index (11546) remains below the 50-day (11750).
The daily is overbought.
Russell 2000 mini-index: Currently net short 80.5k, up 703.
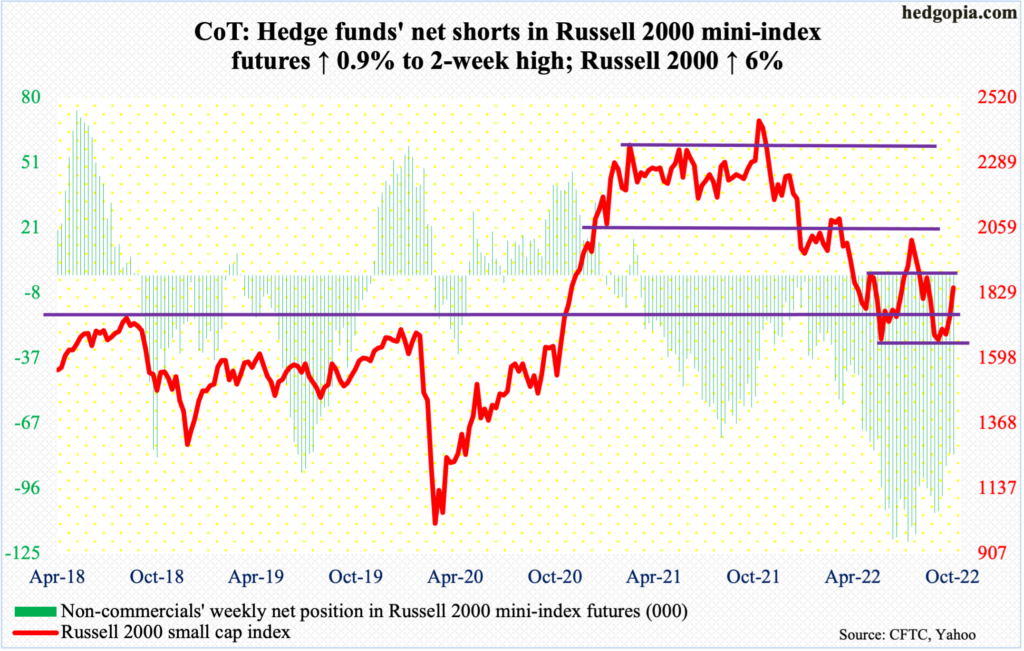
Small-caps stole the show last week – to say the least. The Russell 2000 (1847) surged six percent to decisively reclaim 1800. Bulls are probably eyeing 1900, which is the top end of a months-long range and which they have struggled to stay above since late April.
US Dollar Index: Currently net long 30.1k, down 2.6k.
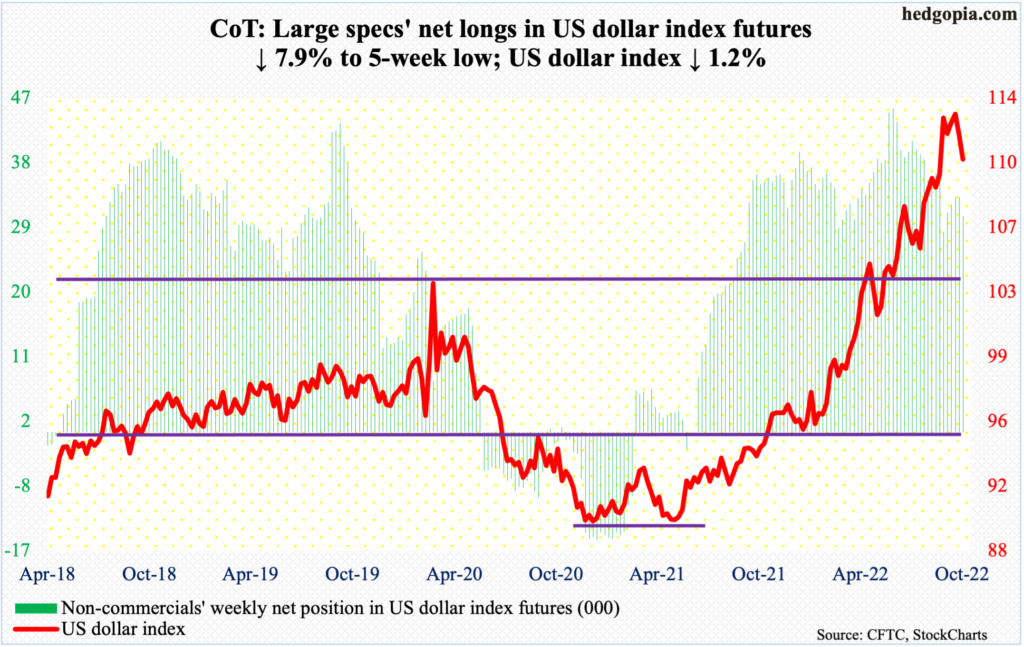
Lateral support at 109.10s was just about tested last week, as the US dollar index touched 109.47 on Wednesday and 109.36 on Thursday, ending the week at 110.61, closing just under the 50-day at 110.78.
The daily is oversold, so it can always rally some. But it increasingly feels like the index reached a major high on September 28 when it touched 114.75 – the highest print since May 2002.
In the event of continued downward pressure, after 109.10s, there is the all-important 104.
VIX: Currently net short 52.8k, down 8k.
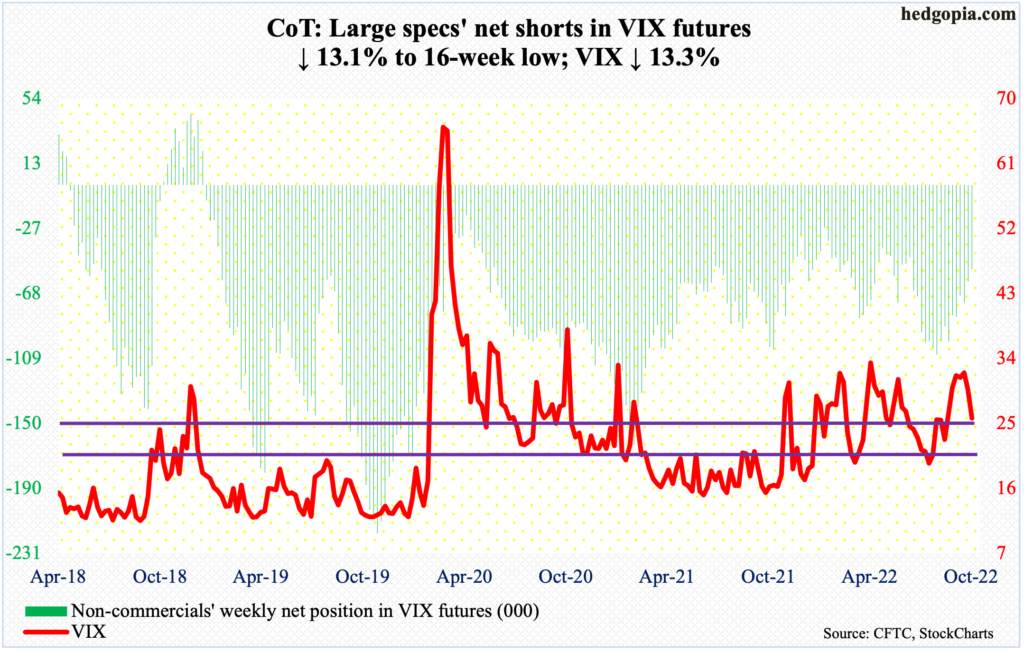
VIX tumbled 3.94 points last week to close out at 25.75, breaching both the 50- and 200-day. Mid-20s carry important support. If volatility bulls fail to put their foot down here, then risk rises the bears will try to push it toward the next support at low-20s.
Thanks for reading!
