Following futures positions of non-commercials are as of November 1, 2022.
10-year note: Currently net short 298.3k, up 50.6k.
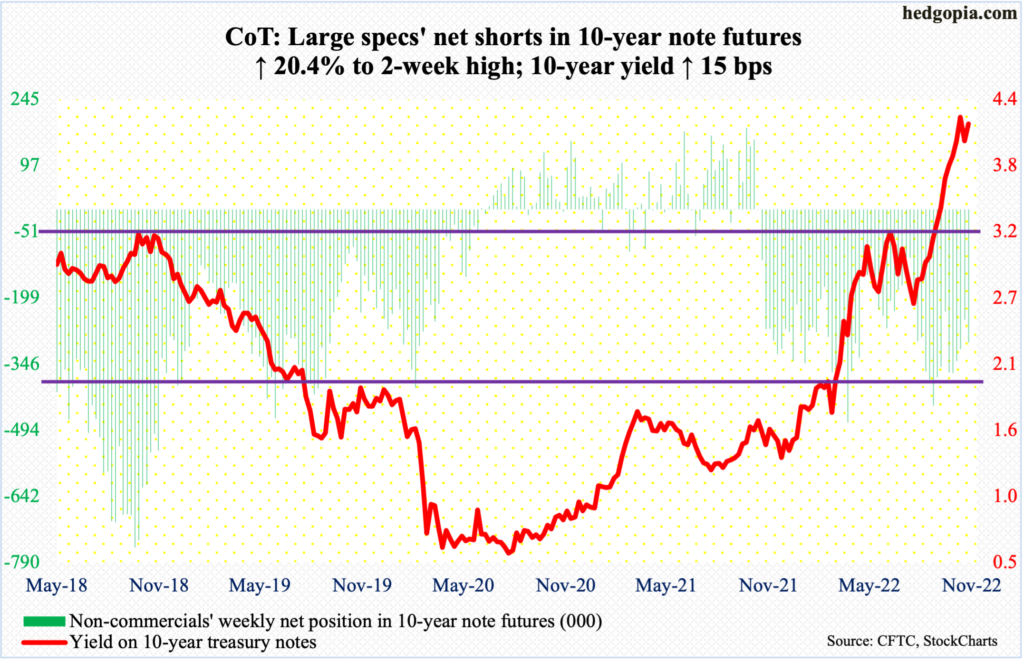
It is beginning to look like FOMC members are no longer on the same page as they probably were until just a couple of months ago. As the policy-setting body concluded its meeting on Wednesday, raising the fed funds rate by 75 basis points to a range of 375 basis points to 400 basis points, the post-meeting statement had a touch of dovishness, including the use of the phrase “cumulative tightening”.
Stocks liked the prospect of that, with the S&P 500 rallying up to a percent through 1:30pm Wednesday; the gains quickly evaporated as soon as Chair Jerome Powell began to speak to the press. He made it clear the central bank had no plans to pause its tightening campaign, as inflation remained stubbornly high.
When it was all said and done, the large cap index was down 2.5 percent in that session. The dovish-leaning members such as Vice-Chair Lael Brainard probably feel Powell deviated from the statement’s main message. Powell, on the other hand, is probably worried more about his legacy – does not want to go down in the annals of central banking history as someone who lacked the courage to tame inflation.
The problem these bankers face is this. Rates have been rising a while, but this has yet to make a serious dent in inflation. Recession looks imminent next year, and the doves are beginning to grow restless. Anytime there is even a hint that the Fed is softening its stance, equity bulls run away with it, loosening financial conditions, which ends up exacerbaing the inflation outlook. A catch-22.
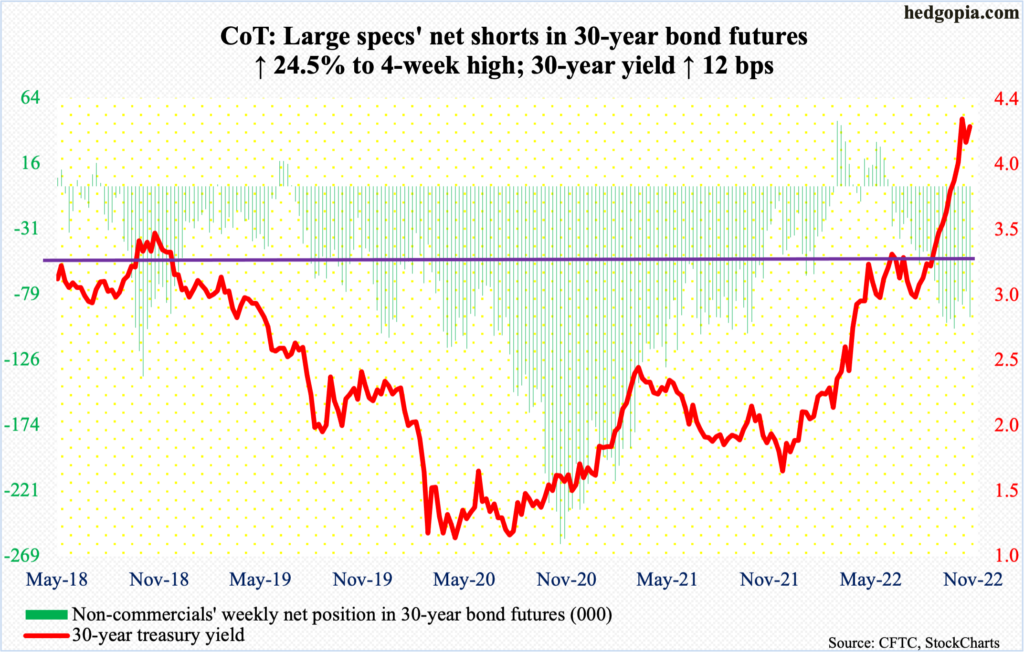
30-year bond: Currently net short 95.3k, up 18.7k.
Major economic releases for next week are as follows.
The NFIB optimism index (October) is scheduled for Tuesday. Small-business optimism inched up three-tenths of a point month-over-month in September to 92.1 – a four-month high.
Thursday brings the consumer price index (October). In the 12 months to September, headline and core CPI increased 8.2 percent and 6.6 percent respectively, with the latter steepest since August 1982. Headline CPI has trended lower since peaking at 9.1 percent in June, which was the highest since November 1981.
The University of Michigan’s consumer sentiment index (November, preliminary) comes out on Friday. Sentiment firmed up 1.3 points m/m in October to 59.9, which was a six-month high.
WTI crude oil: Currently net long 283.2k, up 21.5k.
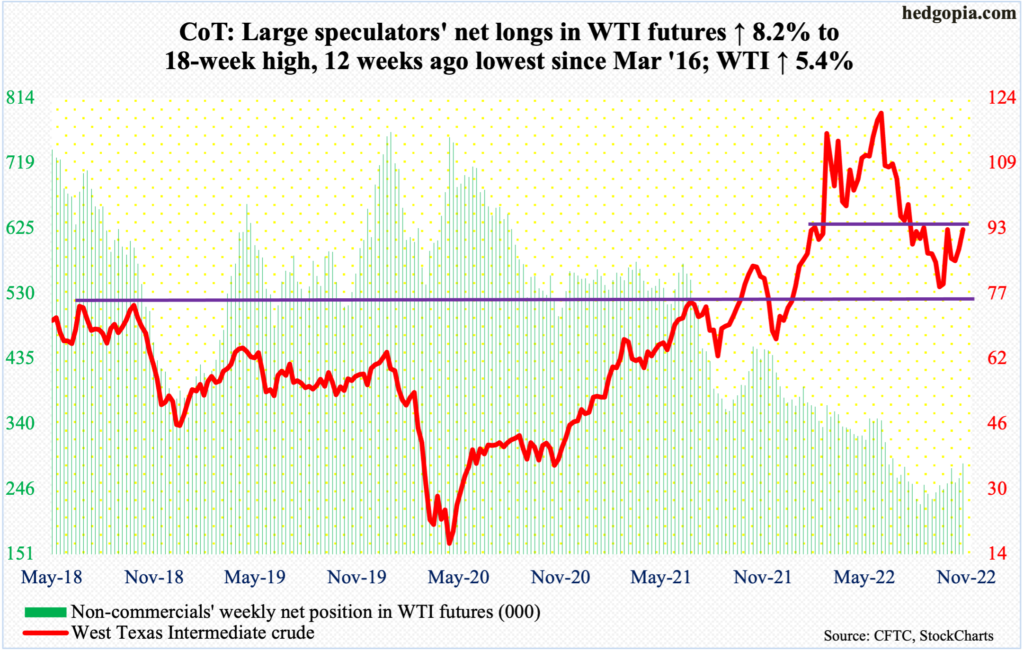
Oil bulls were in control, particularly Friday when WTI rallied five percent to $92.61/barrel. For the week, the crude jumped 5.4 percent.
Once again, $93-$94, where resistance goes back to at least January this year, is in play. A takeout of this opens the door toward the 200-day at $97.80. WTI has not closed above the average since late August.
In the meantime, per the EIA, US crude production in the week to October 28 dropped 100,000 barrels per day to 11.9 million b/d. Crude imports, on the other hand, increased 25,000 b/d to 6.2 mb/d. As did stocks of distillates, which grew 427,000 barrels to 106.8 million barrels. Crude and gasoline stocks dropped 3.1 million barrels and 1.3 million barrels to 436.8 million barrels and 206.6 million barrels, in that order. Refinery utilization rose 1.7 percentage points to 90.6 percent.
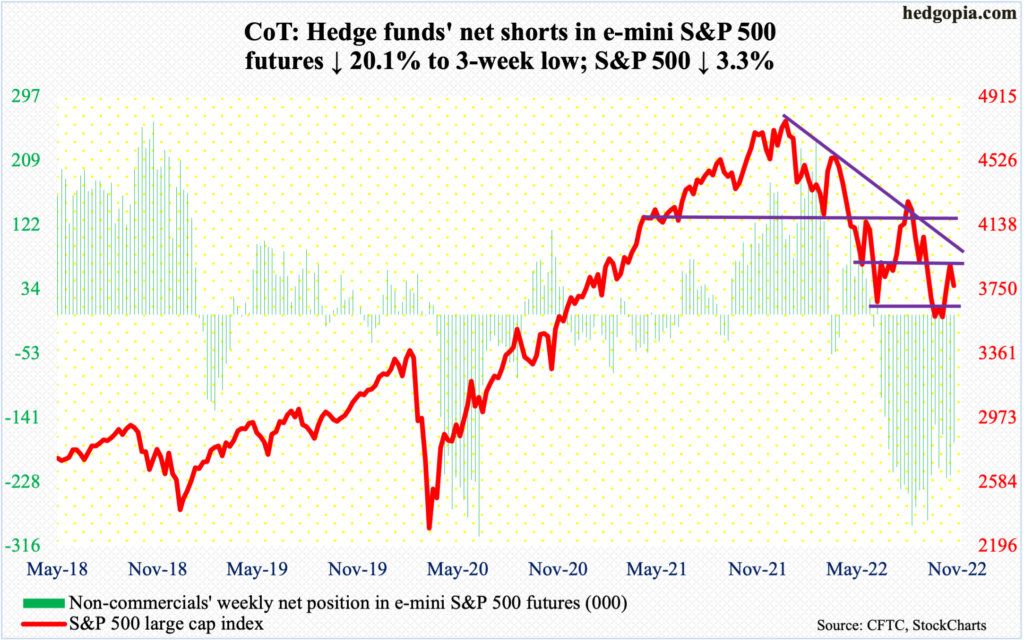
E-mini S&P 500: Currently net short 175.1k, up 44k.
Flows continued to cooperate, but equity bulls did not quite make good use of it. In the week to Wednesday, $9.6 billion moved into US-based equity funds; in the prior two, inflows were $11.9 billion. This followed withdrawals of $58.7 billion in eight straight weeks (courtesy of Lipper). Likewise, in the week to Wednesday, SPY (SPDR S&P 500 ETF), VOO (Vanguard S&P 500 ETF) and IVV (iShares Core S&P 500 ETF) combined took in $10.7 billion; these ETFs have seen inflows for seven weeks now, for a total $38.6 billion (courtesy of ETF.com).
The S&P 500 shed 3.3 percent for the week as it was unable to bust through 3900 early on. If there is any consolation for the bulls, it is that bids showed up at 3700 both Thursday and Friday well before the June lows (3630s) were tested.
As things stand, bulls would have significantly improved their odds should 3900 give way.
Euro: Currently net long 105.8k, up 30.9k.
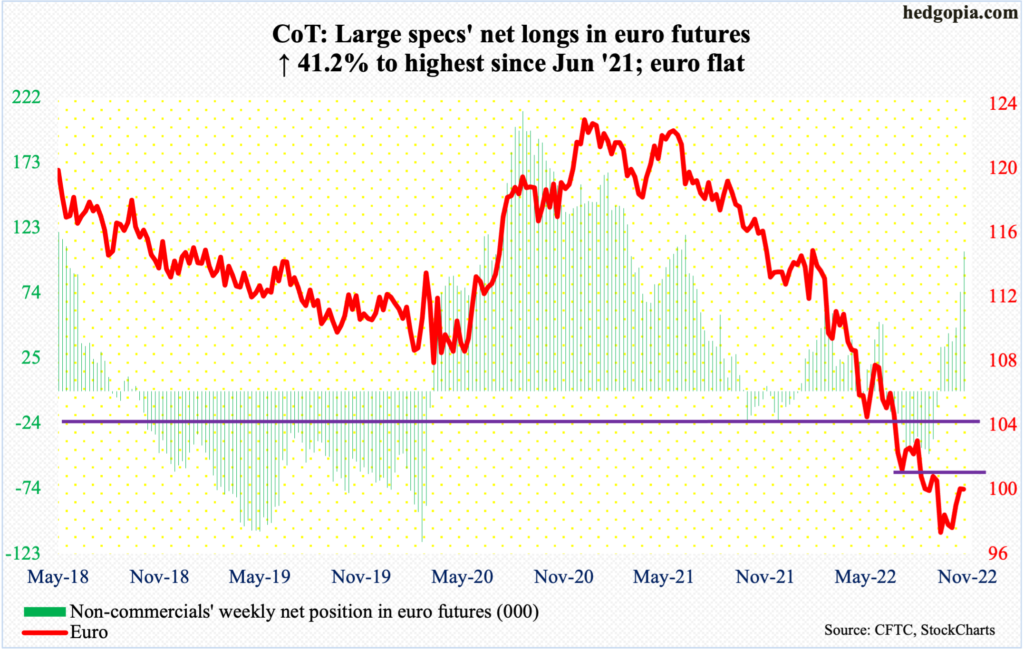
On September 28, the euro bottomed at $0.9559. This preceded a 21-month collapse, peaking at $1.2345 in January last year. A rising trend line from that low was defended Thursday when the currency tagged $0.9733; come Friday, it shot up 2.2 percent to $0.9962. This was just enough to erase the losses of earlier sessions, as the euro ended flat for the week.
Right here and now, momentum remains with the bulls. The October 26 high of $1.0089 is the nearest hurdle. After that comes the all-important $1.04.
Gold: Currently net long 64.6k, down 3.4k.
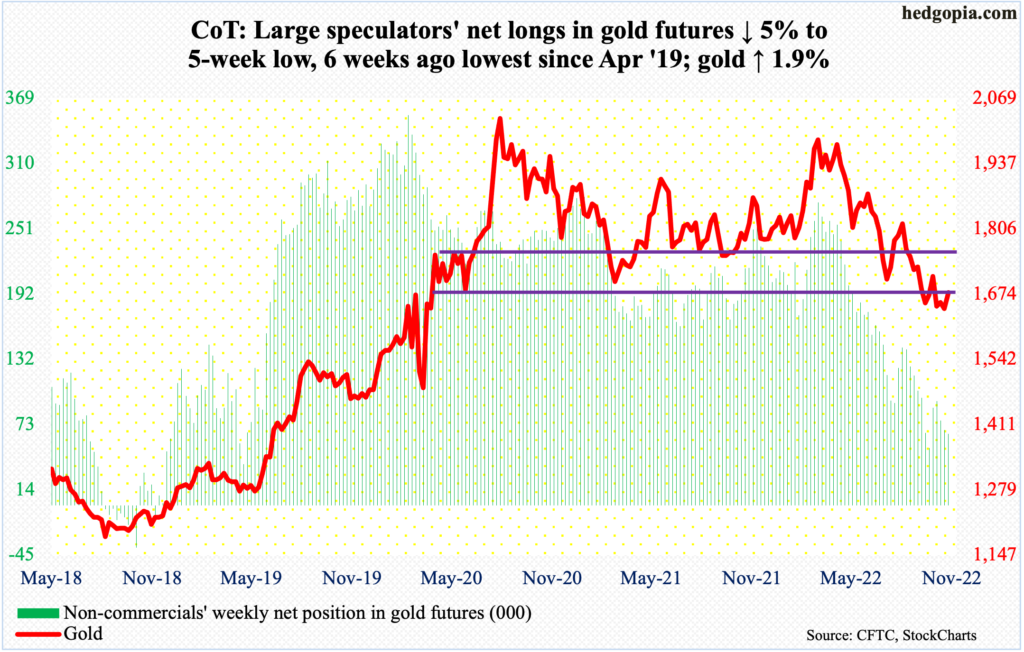
Gold ($1,677/ounce) rallied 2.8 percent Friday to end right at $1,660s-$1,670s. Earlier on Thursday, gold bugs defended $1,620s, which was hit both September and October.
This is as good an opportunity as any to recapture $1,660s-$1,670s. Odds favor the metal rallies toward the next level of resistance at $1,760s-$1,770s.
Nasdaq 100 index (mini): Currently net short 15.2k, up 20.9k.
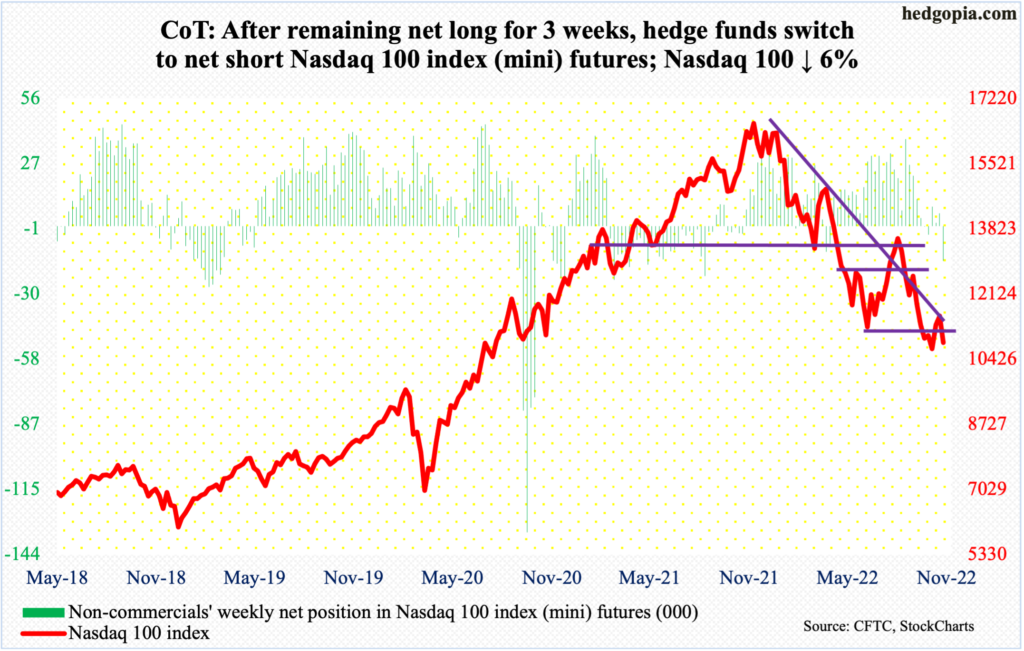
Tech lagged big time this week, as the Nasdaq 100 tumbled six percent to 10857. It began to weaken on Tuesday just under its 50-day. Intraday Friday, the index was within less than 200 points of the October 13 low of 10441, before bids showed up to end the session with a hammer reversal. Tech bulls need to follow this up with a similarly bullish looking candle next week.
Russell 2000 mini-index: Currently net short 49.7k, down 30.9k.
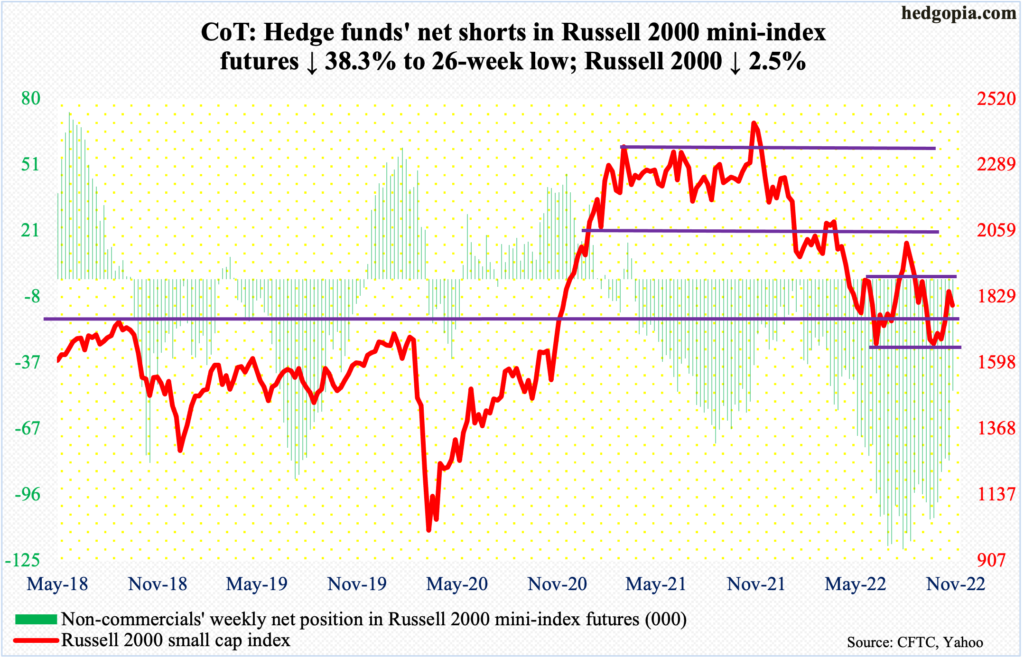
The Russell 2000 touched 1869 intraday Tuesday, just short of the top end of a months-long 1700-1900 range and which small-cap bulls have struggled to stay above since late April. The index closed out the week at 1800, which too has proven to be an important price point since May.
US Dollar Index: Currently net long 29.8k, down 310.
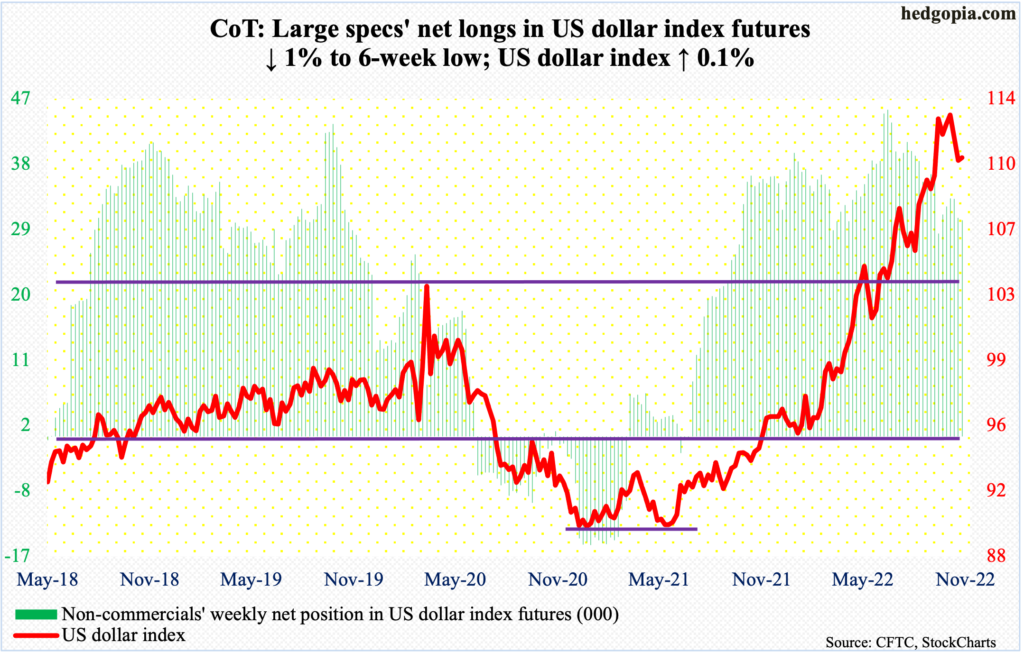
It increasingly feels like the US dollar index reached a major high on September 28 when it touched 114.75 – the highest print since May 2002. Since that high, there have been several lower highs, including Thursday’s intraday high of 113.05.
Nearest support lies at 109.10s, followed by the all-important 104. The index ended the week at 110.77.
VIX: Currently net short 64k, up 11.1k.
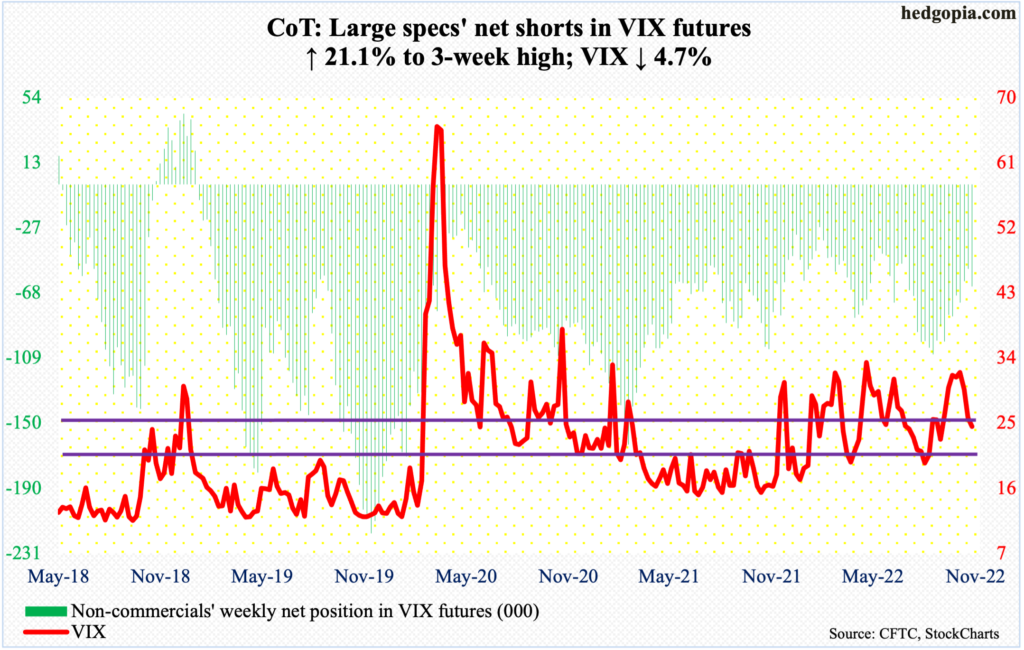
Last Friday, VIX sliced through the 200-day. This week, volatility bulls tried to reclaim the average as early as Monday, but to no avail. The average stood in their way the next three sessions before Friday’s three-percent drop, closing at 24.55.
Despite this, the daily does look like it wants higher. Fingers crossed!
Thanks for reading!

