
Following futures positions of non-commercials are as of November 8, 2022.
10-year note: Currently net short 283.1k, down 15.3k.
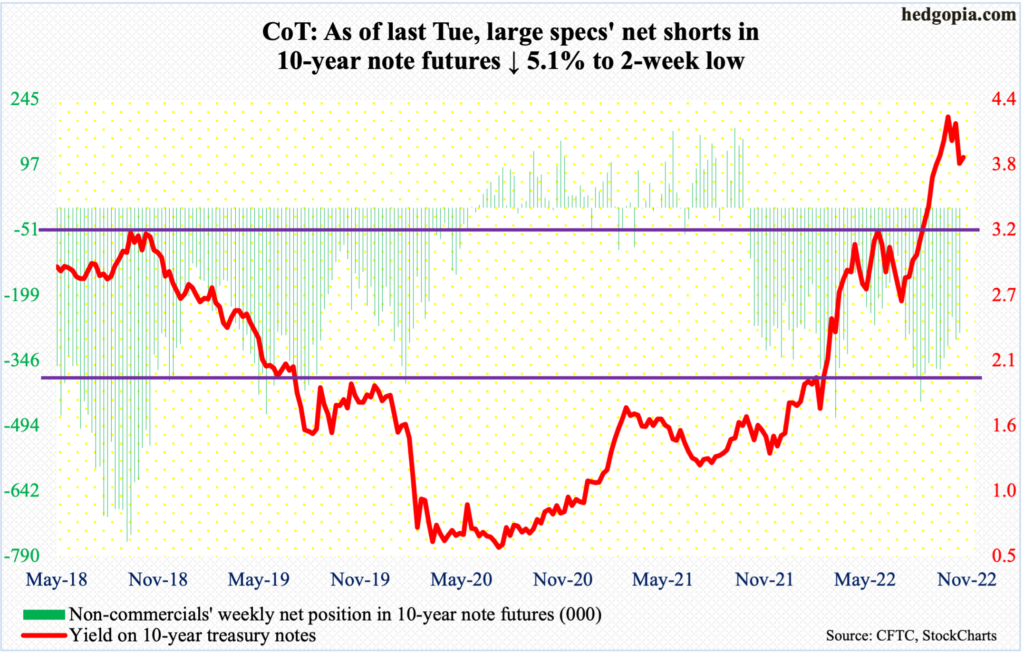
FOMC hawks and doves are getting ready for a duel.
Last Thursday, October’s CPI report showed headline and core consumer prices decelerating to a year-over-year growth of 7.7 percent and 6.3 percent respectively. This is uncomfortably high, but the pace was softer than expected. Investor reaction was swift.
The 10-year treasury yield in that session tumbled 32 basis points to 3.83 percent, the US dollar index dropped 2.1 percent to lose 109, and the S&P 500 jumped 5.5 percent past 3900. It was as if the collective wisdom of markets had decided that inflation has peaked and that the tightening cycle was nearing an end.
Not so fast!
Over the weekend, speaking at a conference in Sydney, Governor Christopher Waller warned “we’ve got a ways to go,” adding “the market seems to have gotten way out in front on this, over this one CPI report.”
The hawks loath a loosening of financial conditions, which is what happens when both equities and bonds rally, and the dollar weakens, among others.
The doves, on the other hand, are beginning to emphasize that the Fed has done a lot and that it is time to show some restraint. Vice-Chair Lael Brainard on Monday said “it will probably be appropriate soon to move to a slower pace of rate increases,” which, by the way, futures traders expect already.
As things stand, the fed funds rate is expected to crest just under five percent by March next year, and then so sideways. At this point in time, the hawk-dove fight within the FOMC is not going to be about a pivot – one is not forthcoming – rather how long the benchmark rates will be left elevated.
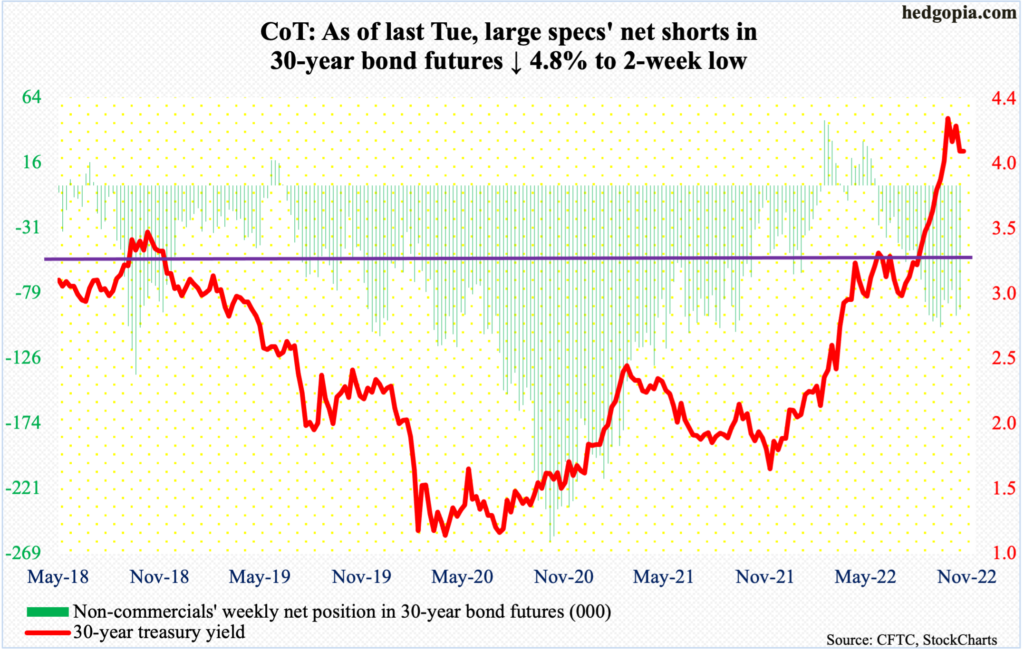
30-year bond: Currently net short 90.7k, down 4.6k.
Major economic releases for this week are as follows.
The producer price index (October) is due out later this morning. In the 12 months to September, headline and core wholesale prices jumped 8.5 percent and 5.6 percent.
On Wednesday, retail sales (October), industrial production (October), the NAHB housing market index (November) and Treasury International Capital data (September) are on tap.
Retail sales were essentially unchanged month-over-month in September at a seasonally adjusted annual rate of $684 billion, just a touch below June’s record $684.1 billion.
Capacity utilization rose 0.25 percent m/m in September to 80.3 percent, which is the highest since March 2008.
Homebuilder optimism tumbled eight points m/m in October to 38 – a 29-month low.
In the 12 months to August, foreigners sold $293 billion in US stocks – a record. In March last year, they set a new record of $404.7 billion in purchases.
Thursday brings housing starts (October). September starts dropped 8.1 percent m/m to 1.44 million units (SAAR) – a two-month low. July’s 1.38 million was a 23-month low.
Existing home sales (October) are scheduled for Friday. Sales were down 1.5 percent m/m in September to 4.71 million units, which is a 28-month low.
WTI crude oil: Currently net long 316.1k, up 32.9k.
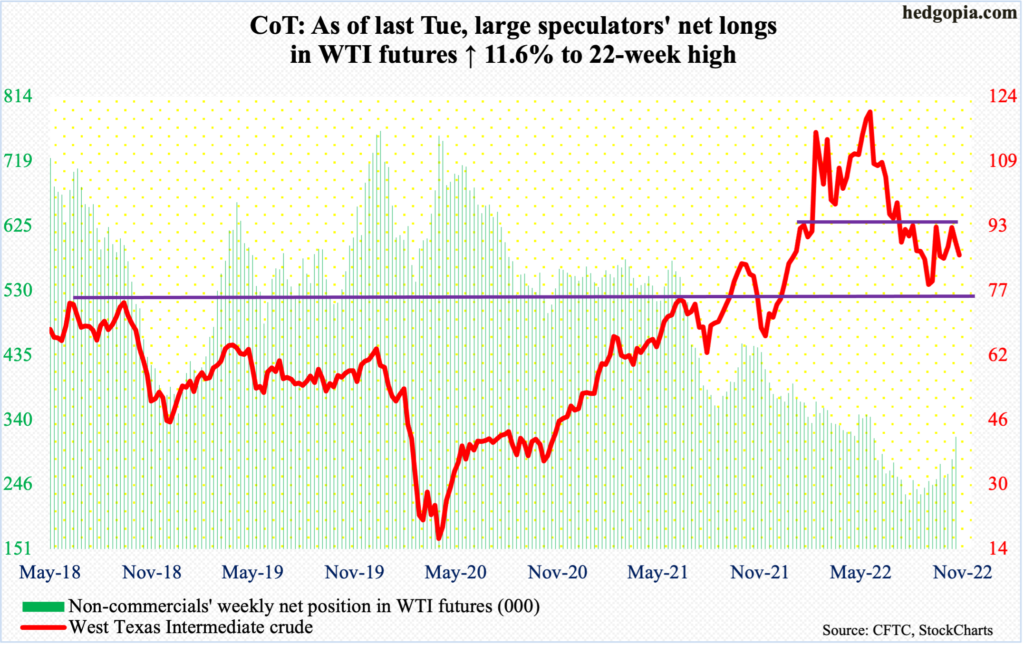
Sellers showed up Monday last week as soon as WTI ($85.87/barrel) hit $93.74. Horizontal resistance at $93-$94 goes back to at least January this year. This Monday, the crude lost 3.5 percent to essentially close at the 50-day ($85.91). Odds favor a breach of the average in the sessions ahead.
E-mini S&P 500: Currently net short 177.1k, up 2k.
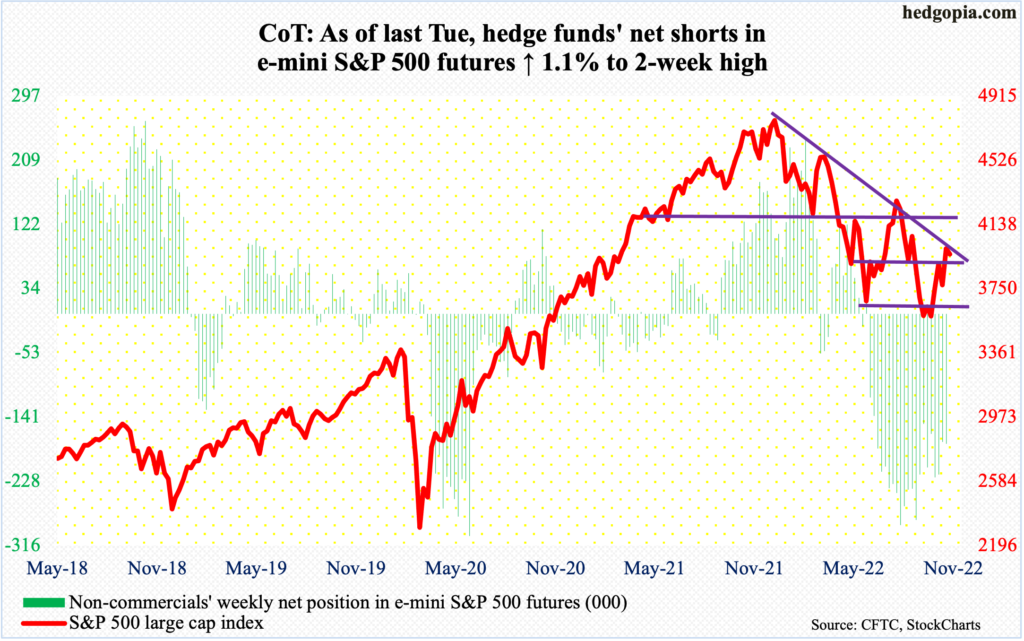
Equity bulls’ reaction to last Thursday’s CPI report for October was nothing short of theatrical. The S&P 500 jumped 5.9 percent last week, with the last two sessions rallying 6.5 percent, ending at 3993.
In the best of circumstances, bulls had a shot at 4100, which is where a falling trend line from January, when the large cap index peaked at 4819, lies. Right there also rests the 200-day at 4079. This resistance is tough to crack.
This Monday, the index dropped 0.9 percent to 3957. Breakout retest at 3900 will test the bulls’ mettle.
Euro: Currently net long 107.6k, up 1.8k.
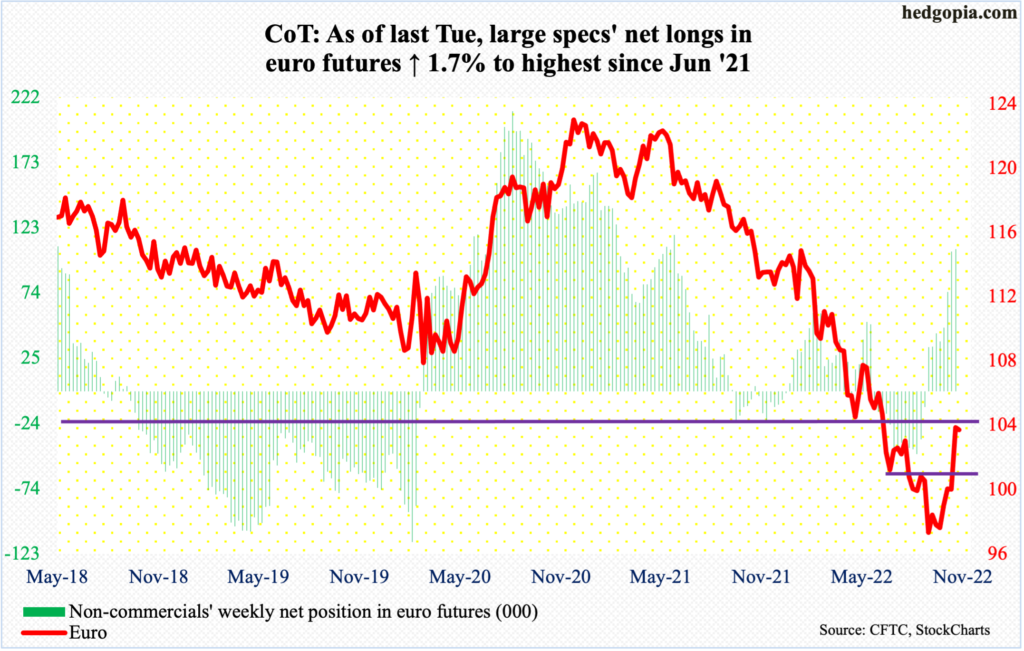
On September 28, the euro bottomed at $0.9559. This preceded a 21-month collapse, peaking at $1.2345 in January last year. A rising trend line from that low was defended early this month. All this laid the foundation for the massive rally last Thursday and Friday; for the week, the currency jumped 3.8 percent to $1.0347. This Monday, it fell 0.1 percent to $1.0332.
Euro bulls lost $1.04 in early July, followed by an unsuccessful test a month later. Last week’s test was the first one after that. Right here and now, this is a hard nut to crack.
Gold: Currently net long 82.3k, up 17.7k.
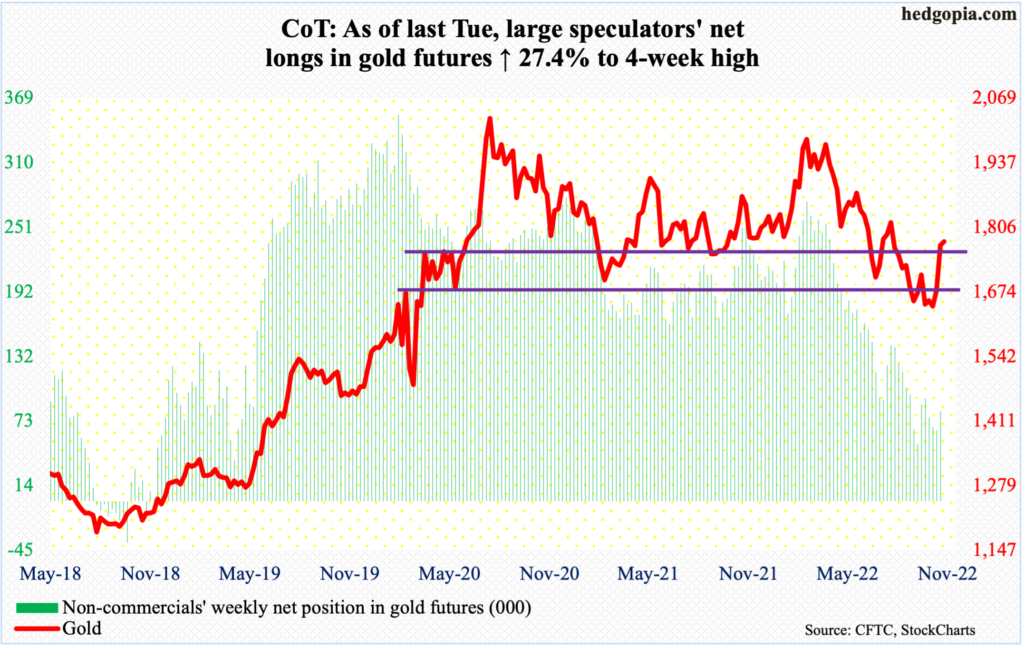
Last week, gold jumped 5.5 percent to end right on horizontal resistance at $1,760s-$1,770s. In the prior week, the metal ended right at $1,660s-$1,670s support. Before that, gold bugs defended $1,620s in September and October.
This Monday, gold built slightly on last week’s gains, up 0.4 percent to $1,777. Last week’s move also pushed the yellow metal past a falling trend line from March this year when it retreated after tagging $2,079.
The momentum remains with the bulls for now. They would love to go test the 200-day at $,1807.
Nasdaq 100 index (mini): Currently net short 2.4k, down 12.8k.
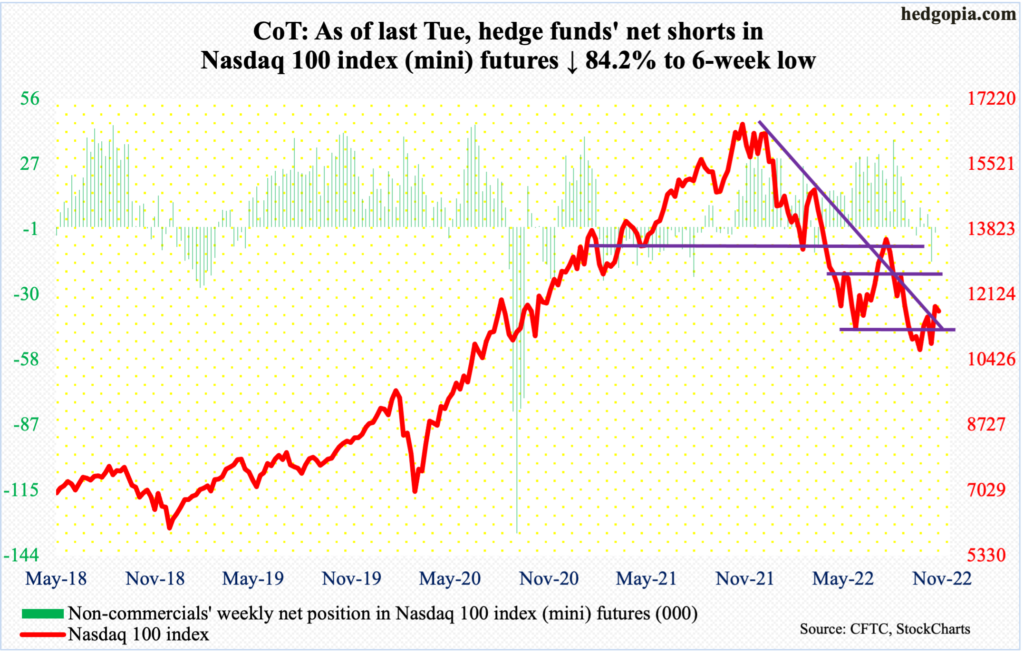
Tech was embraced well last week. On Thursday and Friday, the Nasdaq 100 surged 9.4 percent, accounting for most of the weekly gains of 8.8 percent, closing at 11817 – past lateral resistance at 11600s. At the same time, the tech-heavy index ended right on a falling trend line from last December; it peaked last November at 16765.
Thus far, the trend-line resistance is working, with the index dropping one percent this Monday to 11701. The way things are shaping up, tech bulls should struggle in the sessions ahead to save 11600s.
Russell 2000 mini-index: Currently net short 61.3k, up 11.6k.
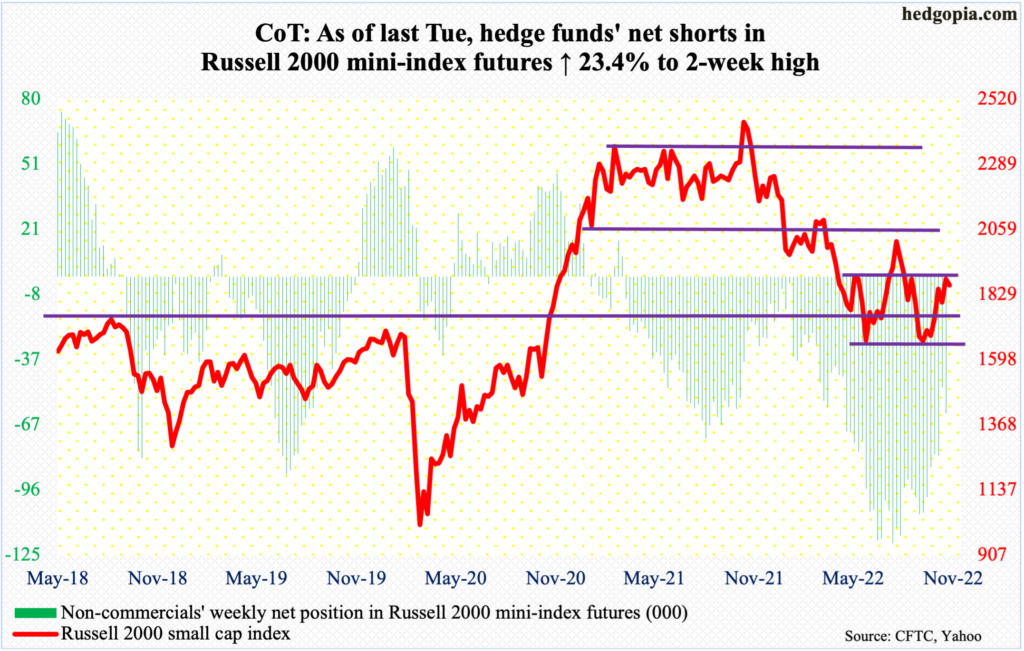
Small-caps were laggards last week – relatively, of course. The Russell 2000 was only up 4.6 percent. More importantly, the small cap index on Friday formed a shooting star right at crucial range resistance.
The index peaked last November at 2459, before dropping all the way to 1642 a month ago. Along the way, a major breakdown occurred mid-January, losing 2080s; for 10 months leading up to that, the Russell 2000 went back and forth between 2080s and 2350s. It then seesawed between 2080s and 1900, followed by a ping pong match between 1900 and 1700; 1700 is where it broke out of in November 2020.
If 1900 is not recaptured soon – unlikely right here and now – then 1800 is the path of least resistance. This Monday, the index fell one percent to 1861.
US Dollar Index: Currently net long 30.2k, up 405.
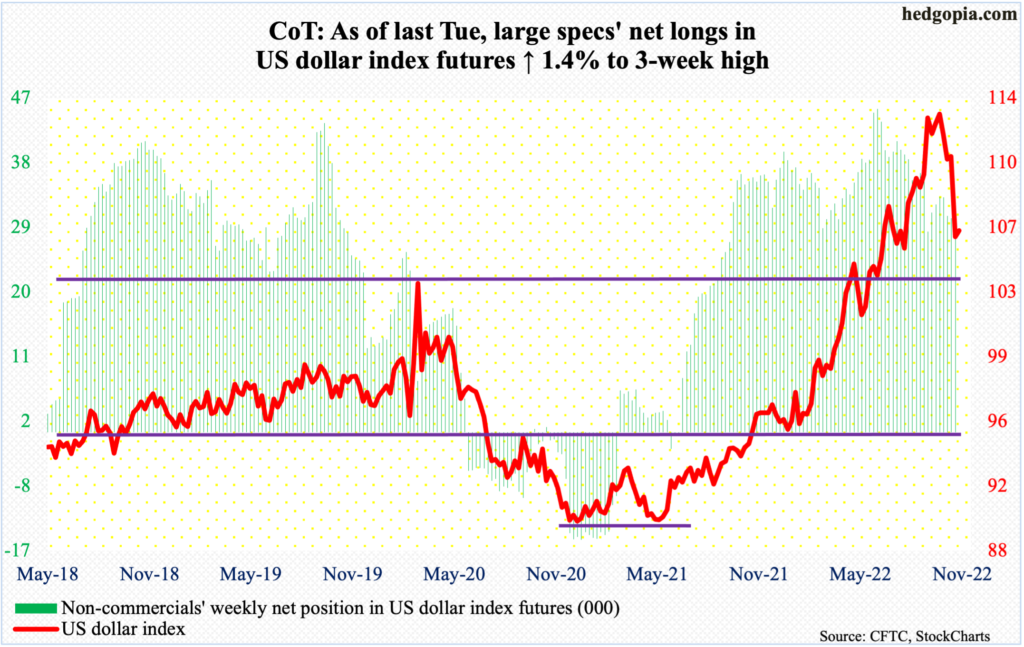
The US dollar index has peaked. It reached a major high on September 28 when it touched 114.75 – the highest print since May 2002. Since that high, there have been several lower highs.
Then, last week, reacting to October’s CPI, dollar bulls headed for the exits all at the same time – at least that is how it felt; it cratered 4.2 percent, losing 109.
Immediately ahead, there is support at 105, followed by the all-important 104. The 200-day lies at 104.57.
VIX: Currently net short 75.2k, up 11.3k.
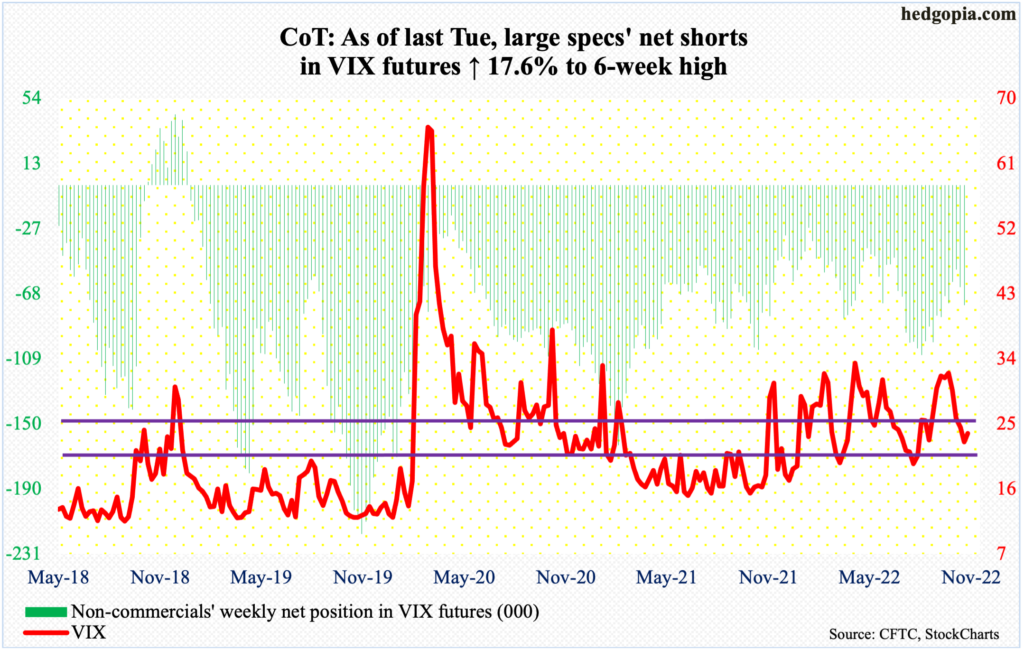
Last Thursday, VIX was vehemently denied at the 200-day. For the week, the volatility index shed 2.03 points to 22.52. This was the fourth consecutive weekly decline. On October 12, it tagged 34.53 before retreating.
Volatility has come down a lot over the past month. VIX is also near crucial support at low-20s. The daily could be itching to rally. This Monday, it added 1.21 points to 23.73. Nearest resistance lies at mid-20s.
Thanks for reading!
