
Following futures positions of non-commercials are as of November 15, 2022.
10-year note: Currently net short 343k, up 60k.
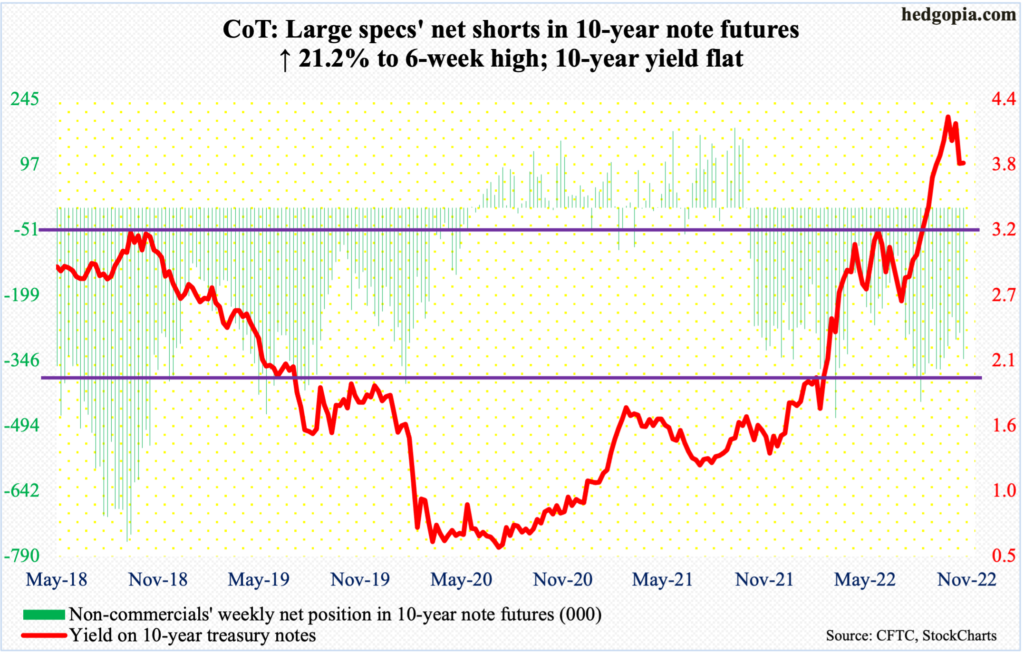
FOMC minutes for the November 1-2 meeting are due out next Wednesday. The fed funds rate was raised by 75 basis points in that meeting, which was a fourth consecutive hike by that magnitude. The benchmark rates are currently at a range of 375 basis points to 400 basis points – up from between zero and 25 basis points until March this year.
In all probability, this will be the last 75-basis-point increase in the current cycle. Futures traders, who until recently were undecided between a 75 and a 50 in the upcoming December (13-14) meeting, are now solidly behind a 50. They expect the Fed to stop tightening around five percent in the early months of next year.
So, the question is not about where the terminal rate may lie – it is around five percent, as things stand – the real question is how long rates will be left elevated. The way inflation is behaving, common sense would tell us that it will be a while before the Fed goes – should go – the other way. This is the issue the doves and the hawks within the FOMC will be fighting over in the months and quarters to come.
The likes of Vice-Chair Lael Brainard are already raising concerns as to what the tightening might do to the economy. The fight going forward will be between those who worry about the sticky inflation and those who worry about jobs. Chair Jerome Powell, who has his legacy at stake as to if he will be able to channel Paul Volcker if the need be, faces a real juggling act.
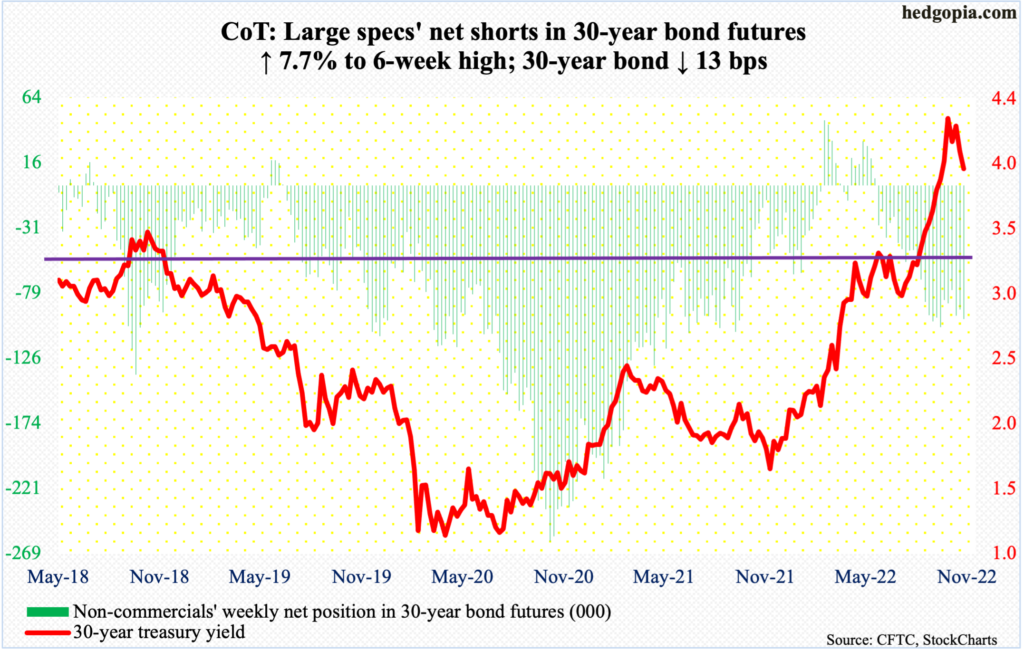
30-year bond: Currently net short 97.7k, up 7k.
Major economic releases for next week are as follows. Happy Thanksgiving!
Wednesday brings durable goods orders (October), the University of Michigan’s consumer sentiment index (November, final) and new home sales (October).
Orders for non-defense capital goods ex-aircraft – proxy for business capex plans – shrank 0.4 percent month-over-month in September to a seasonally adjusted annual rate of $75 billion. August’s $75.4 billion set a new record.
November’s preliminary reading showed consumer sentiment dropped 5.2 points m/m to 54.7 – a four-month low.
September sales of new homes dropped 10.9 percent m/m to 603,000 units (SAAR), which was a two-month low. July’s 543,000 was the lowest since March 2016.
WTI crude oil: Currently net long 307.7k, down 8.5k.
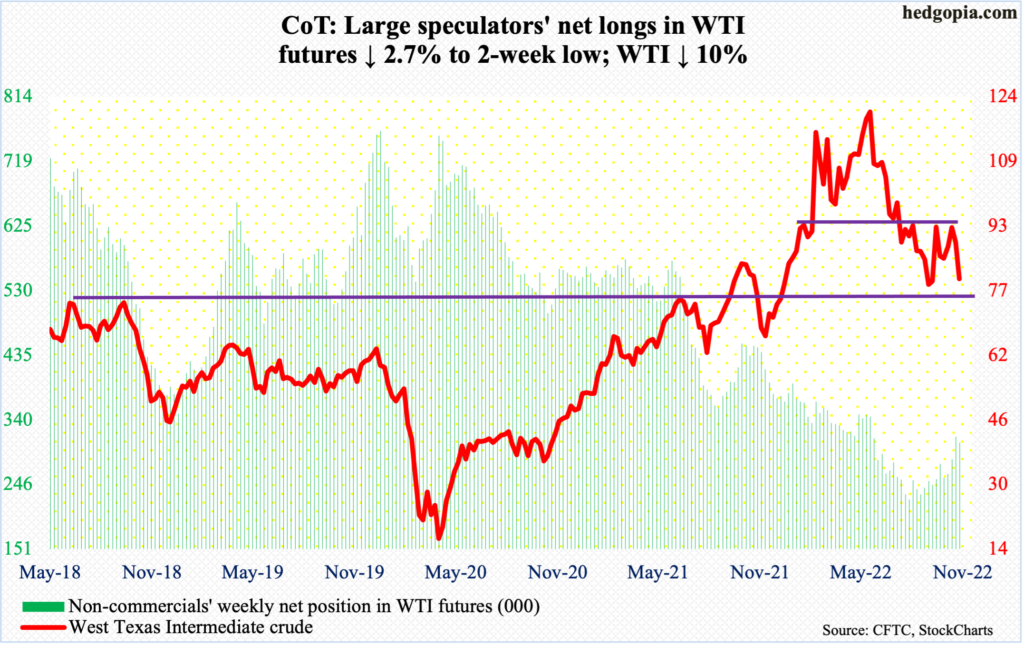
Last week’s rejection at $93-$94, which goes back to at least January this year, cost WTI dearly this week, as the crude tumbled 10 percent to $80.01/barrel. With this, it also sliced through horizontal support at $85.
The daily is getting oversold, but it just feels like WTI wants to go lower. Late-September lows just north of $76 are a must-hold; on Friday, the black gold tagged $77.59 before drawing some bids.
In the meantime, as per the EIA, US crude production in the week to November 11 was unchanged week-over-week at 12.1 million barrels per day. Crude imports decreased 895,000 b/d to 5.6 mb/d, which was the lowest since May last year. Crude stocks dropped as well, down 5.4 million barrels to 435.4 million barrels. Gasoline and distillate stocks, on the other hand, increased 2.2 million barrels and 1.1 million barrels to 207.9 million barrels and 107.4 million barrels respectively. Refinery utilization grew eight-tenths of a percentage point to 92.9 percent.
E-mini S&P 500: Currently net short 202.6k, up 25.6k.
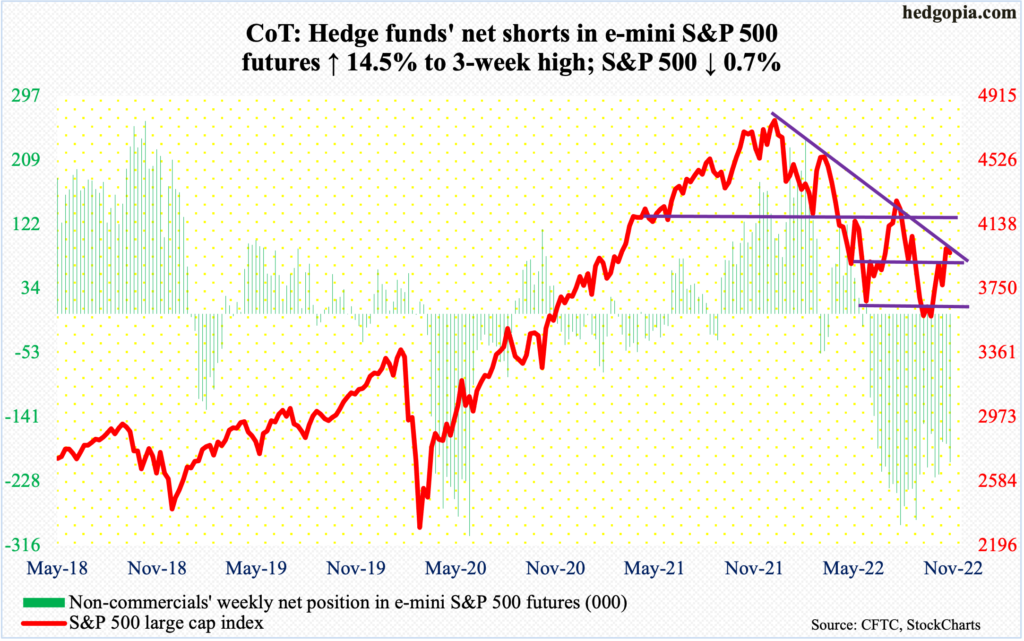
Last week’s massive rally in US equity indices predictably helped attract funds. In the week to Wednesday, $14.6 billion moved into US-based equity funds, versus a drawdown of $8.5 billion in the prior week (courtesy of Lipper). Likewise, in the week to Wednesday, SPY (SPDR S&P 500 ETF), VOO (Vanguard S&P 500 ETF) and IVV (iShares Core S&P 500 ETF) combined took in $7.5 billion, compared to outflows of $9.9 billion in the prior week (courtesy of ETF.com).
By Tuesday’s intraday high of 4029, the S&P 500 was up 0.9 percent for the week before sellers showed up. When it was all said and done, the large cap index was down 0.7 percent. If there is any consolation for the bulls, it is that 3900 drew bids on Thursday as the index ticked 3907 intraday, ending the week at 3965. Odds favor a breach of the level in the sessions ahead, which in and of itself can entice more selling.
The weekly produced a spinning top this week, with several technical indicators right at the median. This is a perfect spot for the bears to get active.
Euro: Currently net long 112.7k, up 5.1k.
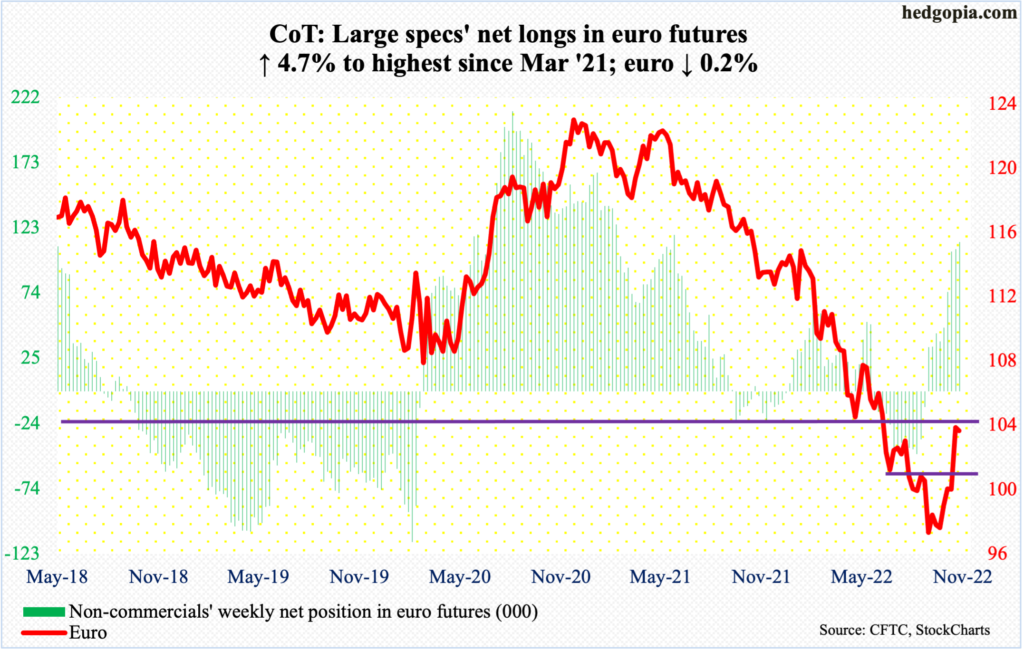
Euro bulls had a marvelous opportunity to reclaim $1.04 but came up short. By intraday Tuesday, as a matter of fact, the euro rose as high as $1.0482 but only to reverse and close at $1.0348. By the end of the week, the currency closed at $1.0325.
Immediately ahead, the November 11 gap-up gets filled at $1.020s.
On September 28, the euro bottomed at $0.9559. This preceded a 21-month collapse, peaking at $1.2345 in January last year. A rising trend line from that low was defended early this month.
Gold: Currently net long 126.3k, up 43.9k.
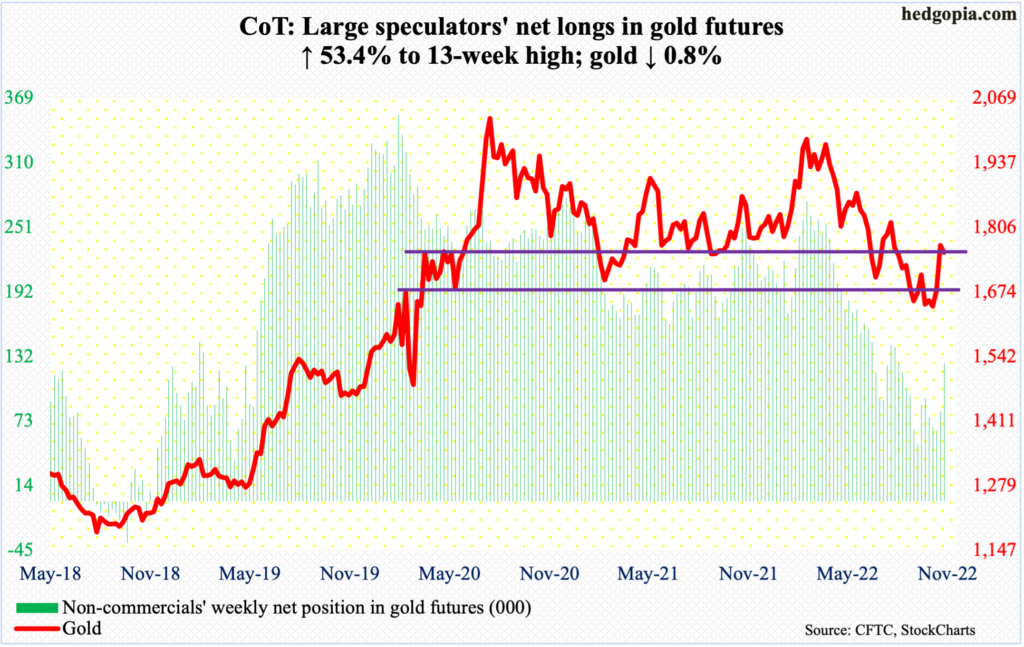
From the week to November 1 through Tuesday this week, non-commercials’ net longs in gold futures surged 95 percent to a 13-week high.
Early this month, gold bugs were in the process of defending horizontal support at $1,620s. Then, gold took off, recapturing $1,660s-$1,670s within the first week. By the middle of the month, the yellow metal tagged $1,792; this was this Tuesday, so likely reflects non-commercials’ latest buildup in net longs.
As soon as $1,660s-$1,670s was reclaimed, the yellow metal hurriedly rallied toward the next major level at $1,760s-$1,770s, which, in fact, was surpassed slightly. But, by that time, gold was so extended a breather was only natural.
Longs’ test going forward will be if they will be able to save $1,760s-$1,770s; so far, they have not, as the metal closed out the week at $1,754/ounce. Continued inability to do so opens the door toward $1,660s-$1,670s.
Nasdaq 100 index (mini): Currently net short 5.3k, up 2.8k.
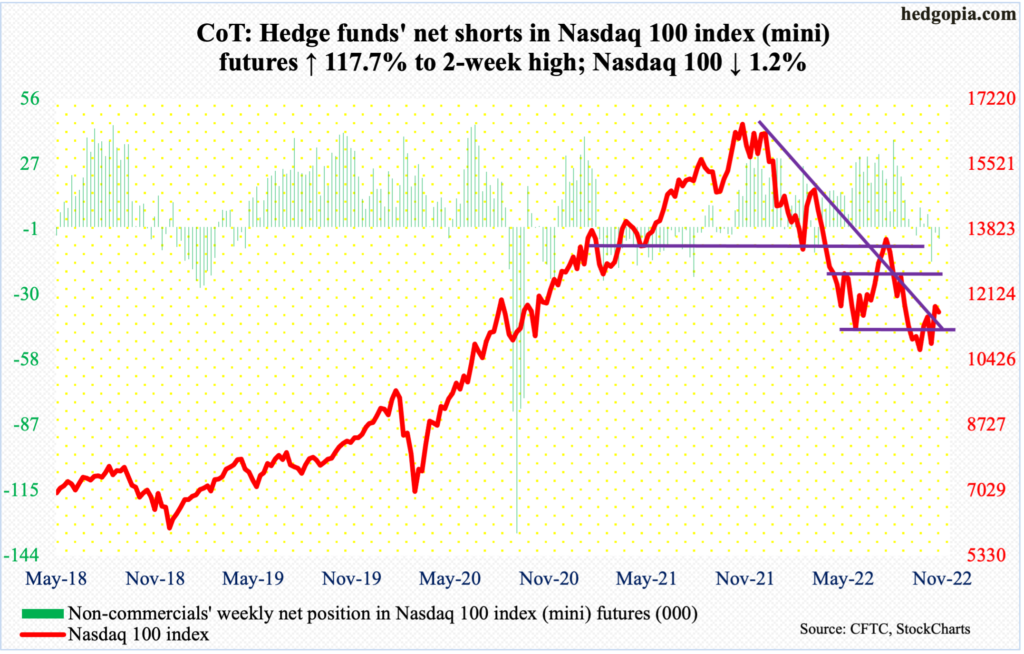
Last week, the Nasdaq 100 jumped 8.8 percent to close right on a falling trend line from last December. Positive momentum continued in the early sessions, as the tech-heavy index rallied another 1.8 percent when intraday Tuesday it touched 12025. But the bulls were unable to hang on to the gains, ending the week at 11677, down 1.2 percent for the week. The index is back below the trend line (on an intraday basis, not closing).
The Nasdaq 100 closed right on lateral support at 11600s. A breach raises the risk the June lows around 11000 will act as a magnet.
Russell 2000 mini-index: Currently net short 68k, up 6.7k.
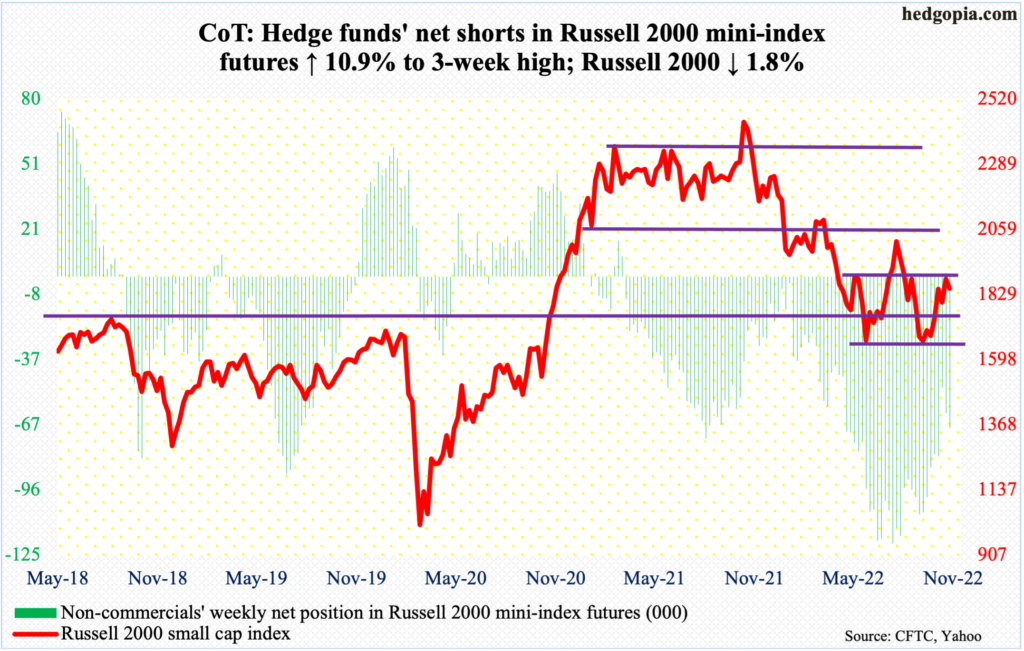
The Russell 2000 peaked last November at 2459 and then dropped all the way to 1642 by October 13 this year. Along the way, a major breakdown occurred mid-January, losing 2080s; for 10 months leading up to that, the small cap index went back and forth between 2080s and 2350s. It then seesawed between 2080s and 1900, followed by a ping pong match between 1900 and 1700; 1700 is where it broke out of in November 2020.
The rally post-October 13 low culminated in an unsuccessful test of 1900. Last Friday, a shooting star showed up right at that range resistance. This was followed this Tuesday by a long-legged doji.
The way things are shaping up, 1800 is the path of least resistance. The index closed out the week at 1850.
US Dollar Index: Currently net long 26.9k, down 3.3k.
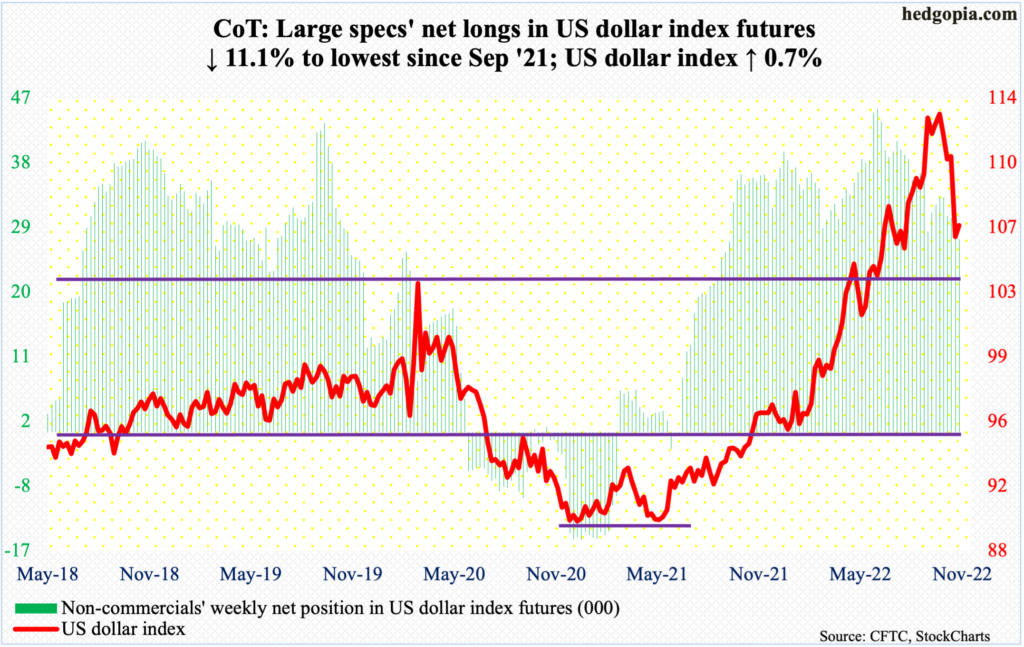
The US dollar index has peaked.
On September 28, it reached a major high tagging 114.75 – the highest print since May 2002. A pattern of several lower highs since that peak culminated in last week’s 4.2-percent drubbing, losing 109 in the process.
The downward momentum continued initially this week as the index fell as low as 105.16 by Tuesday – just above the 200-day moving average (104.78) – but only for bids to show up, ending the week at 106.83.
So, for now, the US dollar index is caught in the 105-109 range.
VIX: Currently net short 64.8k, down 10.4k.
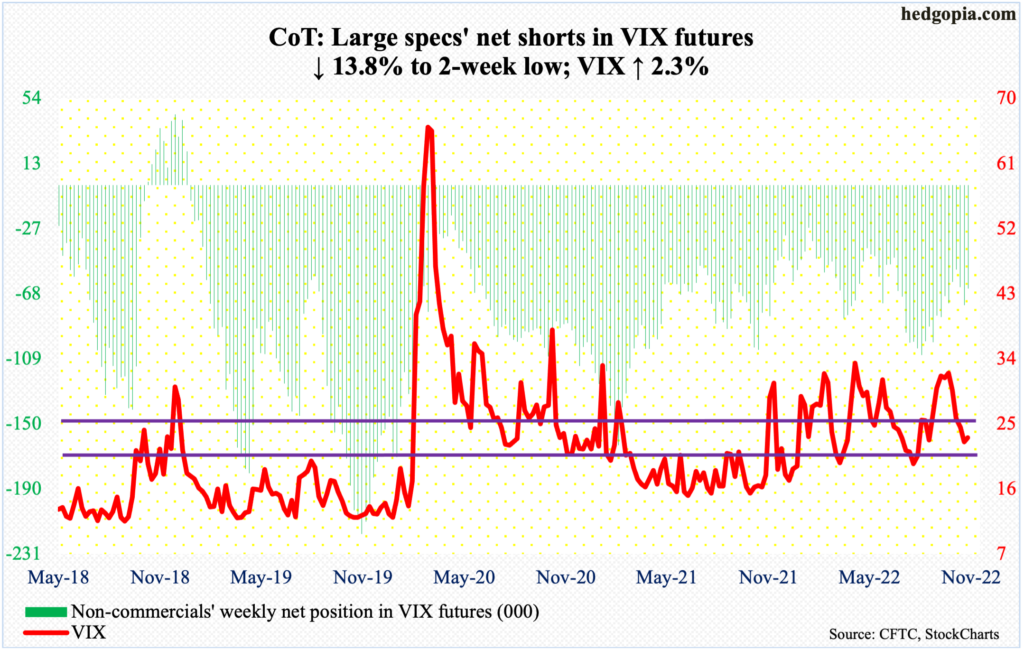
After four down weeks in a row, VIX rallied 0.60 points this week to 23.12. In fact, volatility bulls could have fared a lot better as the index rose as high as 26.22 – just under the 200-day (26.46) – intraday Tuesday but only to end the session at 24.54; VIX fell the next three sessions.
As things stand, VIX finds itself right between mid-20s resistance and low-20s support. It is possible it weakens early next week before it finds a footing.
Thanks for reading!
