
Following futures positions of non-commercials are as of November 29, 2022.
10-year note: Currently net short 296.8k, down 24.5k.
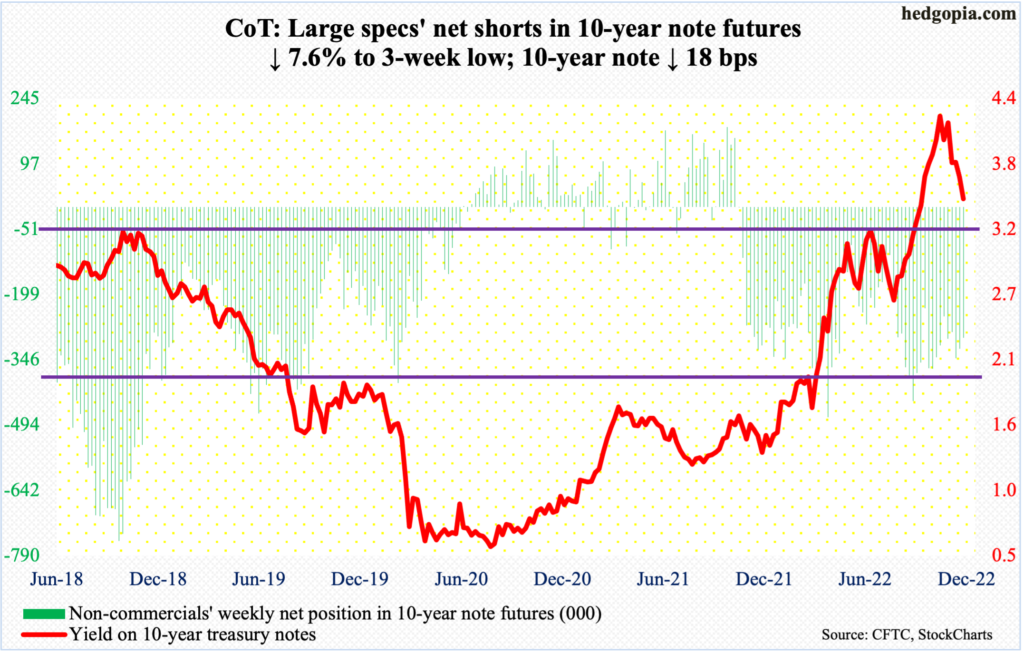
Markets and the Federal Reserve are talking past each other. Chair Jerome Powell’s Wednesday speech was interpreted as dovish – probably wrongly – causing a massive rally in both stocks and bonds. When this happens, financial conditions loosen, which is exactly the opposite of what the central bank wants.
Going by the most recent data, inflation seems to be trending lower but remains elevated. The message from the FOMC hawks in particular, including Chair Powell, is clear, which is that they would do whatever is necessary to bring inflation under control. Markets are not listening.
The Fed will keep at it until the job market cracks and wage growth decelerates. We had none of it in November, when the economy created 263,000 non-farm jobs and private-sector wages grew 5.1 percent year-over-year. Both were stronger than expected. The risk going forward is a wage price spiral, driven by service-industry jobs.
Futures traders, on the other hand, continue to believe the Fed will begin to cut by the latter months of next year. When it is all said and done, this staring contest will be won by the Fed.
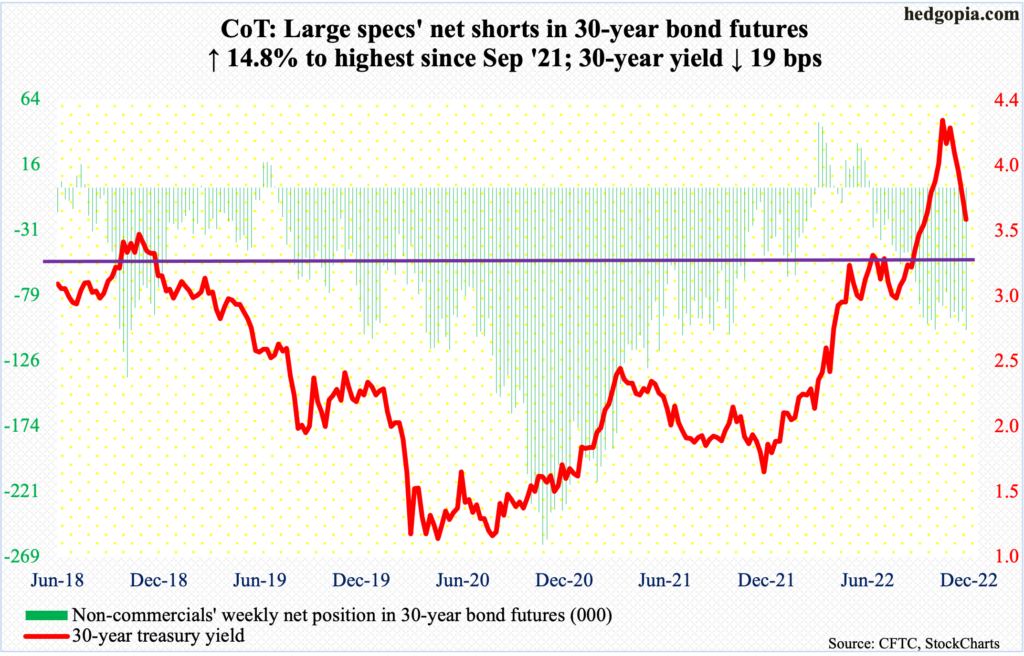
30-year bond: Currently net short 103.9k, up 13.4k.
Major economic releases for next week are as follows.
The ISM services index (November) and factory orders (October) are scheduled for Monday.
Services activity in October declined 2.3 percentage points month-over-month to 54.4 percent.
Preliminarily, October orders for non-defense capital goods ex-aircraft – proxy for business capex plans – rose 0.7 percent m/m to a seasonally adjusted annual rate of $75.3 billion, which is just a stone’s throw away from August’s record $75.4 billion.
Labor productivity (3Q22, revised) is reported on Wednesday. Preliminarily, non-farm output per hour fell 1.4 percent y/y in 3Q. This was the third consecutive quarter of negative growth and a fourth down month in the last five.
Friday brings the producer price index (October) and the University of Michigan’s consumer sentiment index (December, preliminary).
In the 12 months to October, headline and core (excluding food and energy) wholesale prices increased eight percent and 6.7 percent respectively.
In November, consumer sentiment decreased 3.1 points m/m to 56.8 – a four-month low.
WTI crude oil: Currently net long 284.6k, down 7.5k.
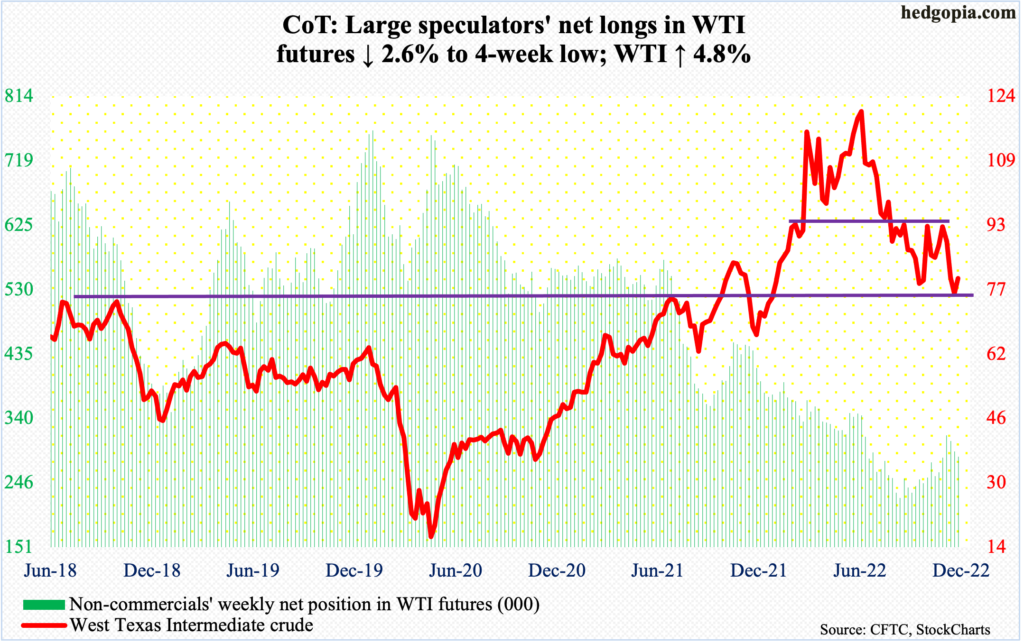
Monday’s intraday low of $73.60 breached lateral support at $75-$76 intraday but was saved by close. By Thursday, WTI tagged $83.34/barrel to close out the week at $79.98.
There is decent horizontal resistance at $85, which coincides with the 50-day moving average at $84.67.
Hence for now, the crude is trapped between this range.
OPEC+ is meeting on Sunday to decide on its production policy. Oil traders are betting on a cut and rallied WTI 4.8 percent this week. A possible OPEC+ decision to roll over its existing policy will not be liked by the bulls.
In the meantime, as per the EIA, US crude production in the week to November 25 was flat week-over-week at 12.1 million barrels per day. Crude imports dropped one mb/d to six mb/d. As did crude stocks, which fell 12.6 million barrels to 419.1 million barrels. Gasoline and distillate inventory, however, rose – up 2.8 million barrels and 3.5 million barrels to 213.8 million barrels and 112.6 million barrels respectively. Refinery utilization increased 1.3 percentage points to 95.2 percent.
E-mini S&P 500: Currently net short 204.2k, up 12.7k.
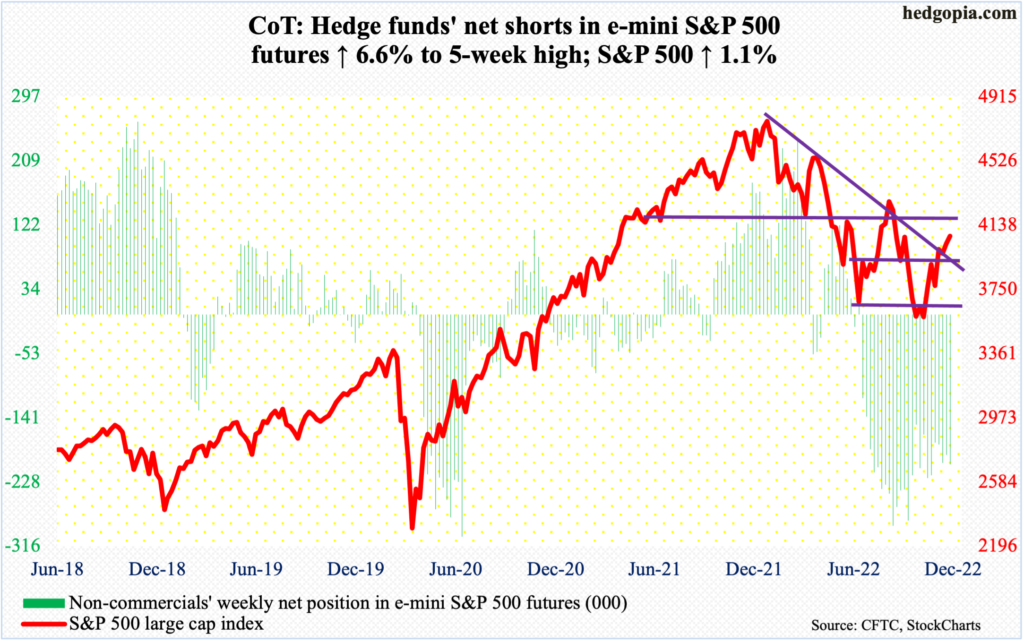
The S&P 500 has reached a crucial juncture. After rallying 17.5 percent from the October 13 low of 3492, the large cap index last Thursday ticked 4101 to test a falling trend line from January when it peaked at 4819. Thus far, the test has been unsuccessful, with the index ending last week at 4072.
Nevertheless, the index remains less than 30 points from the resistance. Plus, for the first time since early April, it is now above the 200-day, which was recaptured on Wednesday when the S&P 500 shot up 3.1 percent. On Friday, the average was lost intraday, but the bulls managed to rally the index from down 1.2 percent at one stage to end the session down 0.1 percent.
Momentum remains with the bulls. Should the resistance in question give way in the sessions ahead, there is another hurdle. Since last month’s bottom, the S&P 500 has rallied within an ascending channel. Wednesday’s low was made at the channel support (more on this here). Sellers can show up at the top of the channel.
Euro: Currently net long 122.2k, down 865.
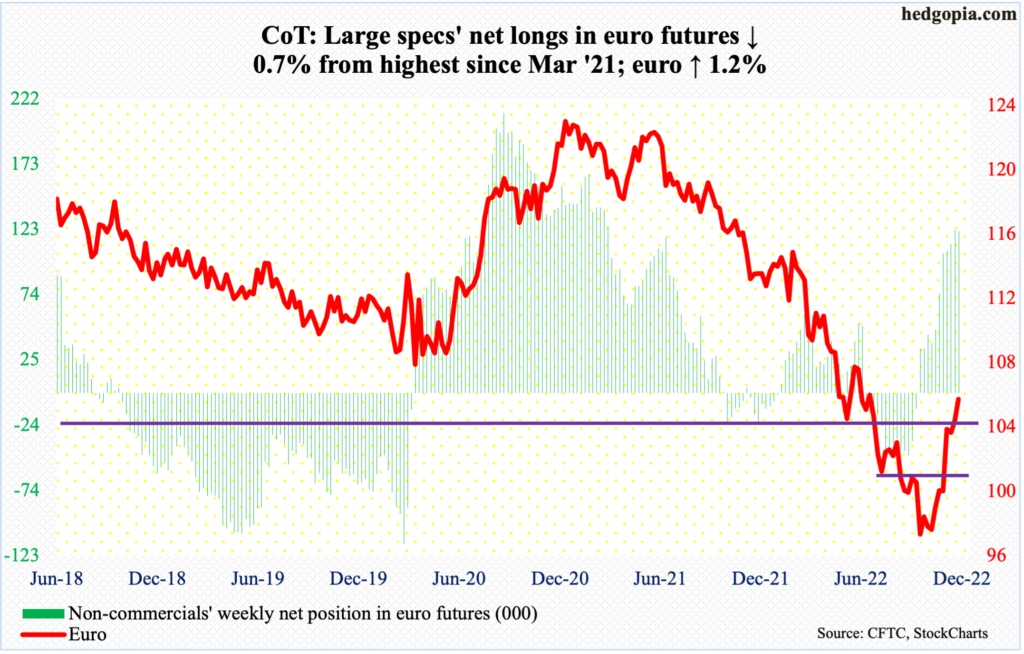
On November 15, the euro tagged $1.0482 intraday before retreating. This Monday, euro bulls had another opportunity to reclaim $1.04, ticking $1.0478 intraday but only to close at $1.0340. Their persistence paid off on Thursday when the currency not only recaptured $1.04 but also the 200-day. It closed out the week at $1.0533.
The euro bottomed at $0.9559 on September 28, having peaked at $1.2345 in January last year. Having rallied for a couple of months now, the daily obviously is extended. But as long as $1.04 remains intact, the ball remains with the bulls.
Gold: Currently net long 110k, down 6.1k.
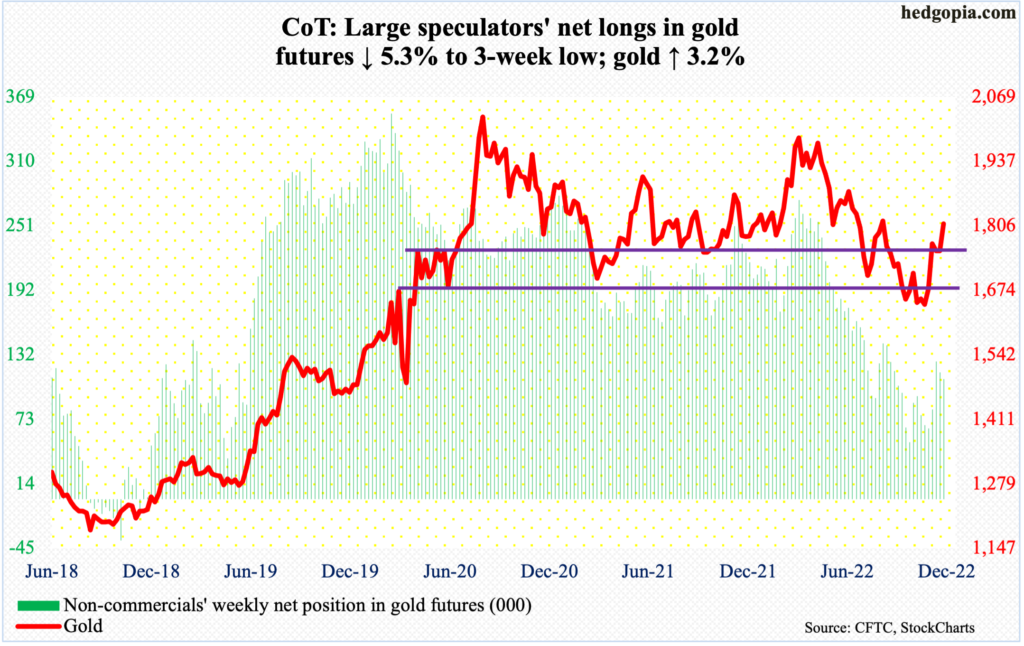
Gold bugs finally took care of $1,760s-$1,770s, which fell on Thursday. The metal ended the week at $1,810/ounce, rallying as high as $1,819 on Friday. This is another level – $1,820s to be precise – where sellers could be tempted into action. Should this occur and the bulls are able to snap up all the supply at/near the 200-day ($1,803) or $1,760s-$1,770s, then gold would have built a solid foundation for further strength.
Nasdaq 100 index (mini): Currently net long 9.8k, up 6.7k.
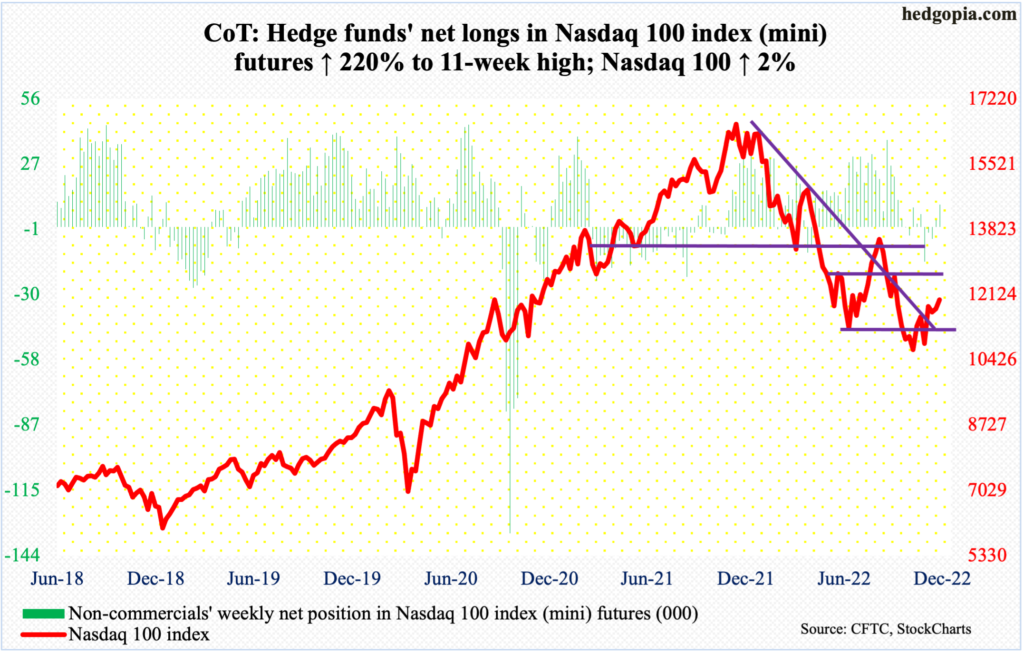
After a massive Wednesday, tech bulls tried to further build on that momentum but witnessed slight selling pressure just north of 12100 in Thursday’s long-legged doji session. There is decent resistance at 12100s.
Unlike the S&P 500 which reclaimed the 200-day this week, the tech-heavy index (11994) remains 4.4 percent from the average.
For consolation, the Nasdaq 100 this week managed to poke its head out of a falling trend line from last December – all good except tech is not where money is gravitating toward recently.
Russell 2000 mini-index: Currently net short 57.6k, down 7.3k.
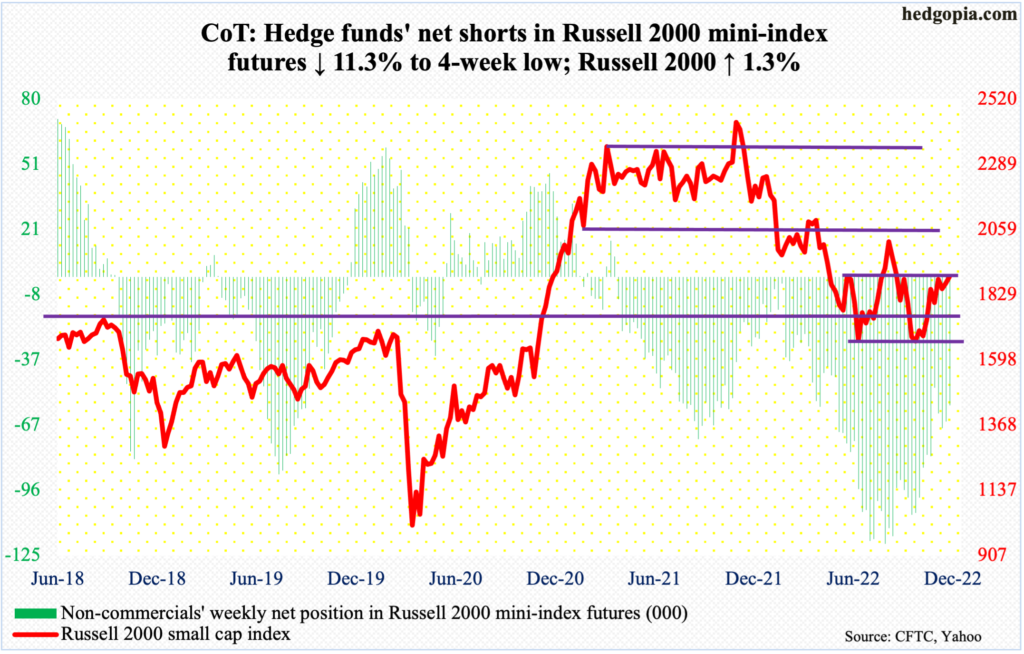
Once again, the Russell 2000 finds itself just under 1900. Small-cap bulls have been hammering at this resistance for several weeks now.
For reference, the Russell 2000 peaked last November at 2459 and then dropped all the way to 1642 by October 13 this year. Along the way, a major breakdown occurred mid-January, losing 2080s; for 10 months leading up to that, the small cap index went back and forth between 2080s and 2350s. It then seesawed between 2080s and 1900, followed by a ping pong match between 1900 and 1700; 1700 is where it broke out of in November 2020.
The rally post-October 13 low culminated in an unsuccessful test of 1900 on November 15. This week, the index was less than two points from it on both Thursday and Friday, ending the week at 1893.
A breakout opens the door toward 2000.
US Dollar Index: Currently net long 24.9k, up 827.
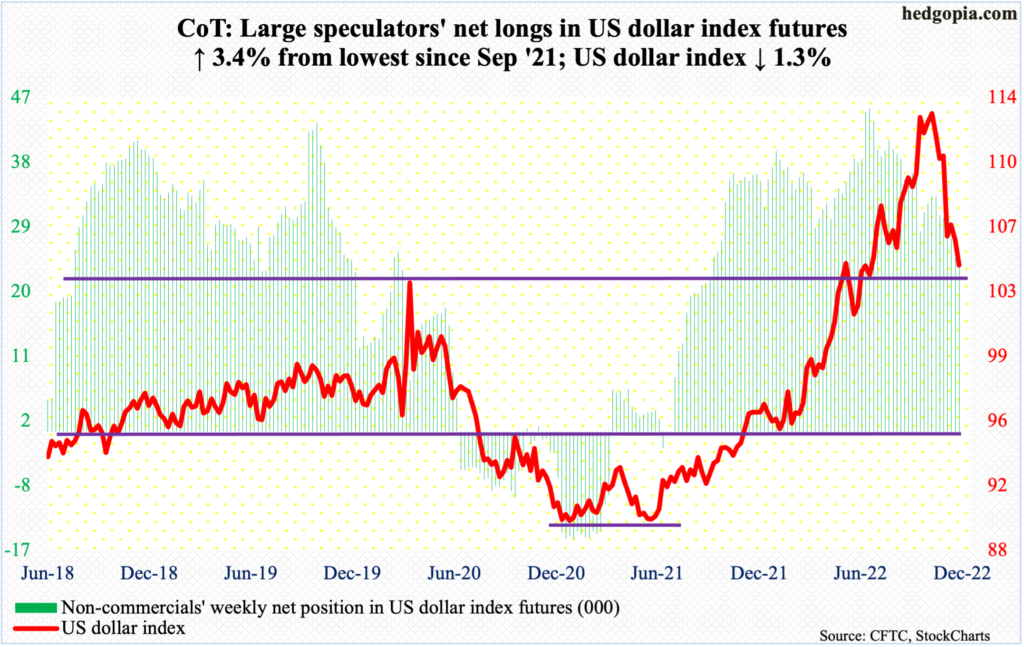
It is going to be a big test for dollar bulls. The US dollar index shed 1.3 percent this week to close at 104.50. This level has proven to be important for both bulls and bears going back to at least 2017. The index broke out of it in the middle of this year, before reaching a major high on September 28 tagging 114.75 – the highest print since May 2002. This was then followed by several lower highs.
Overall, momentum remains down. Nevertheless, this is an opportunity for the bulls to step up and save the breakout retest.
VIX: Currently net short 67.6k, up 4.2k.
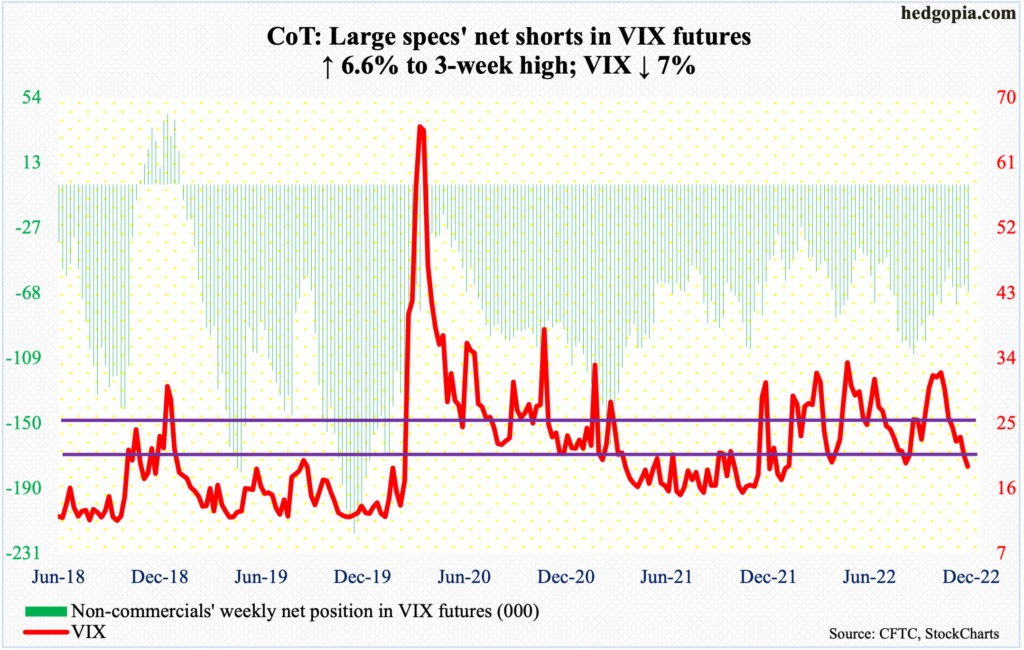
Volatility bulls were unable to defend low-20s, closing the week at 19.06. That said, in both March/April and August this year, VIX bottomed around here, before rallying toward 35.
Else, the volatility index runs a risk of hurtling down toward a rising trendline from November 2017 when VIX reached an all-time low of 8.56. This trendline support lies just south of 17.
Thanks for reading!
