
Following futures positions of non-commercials are as of December 6, 2022.
10-year note: Currently net short 369.2k, up 72.4k.
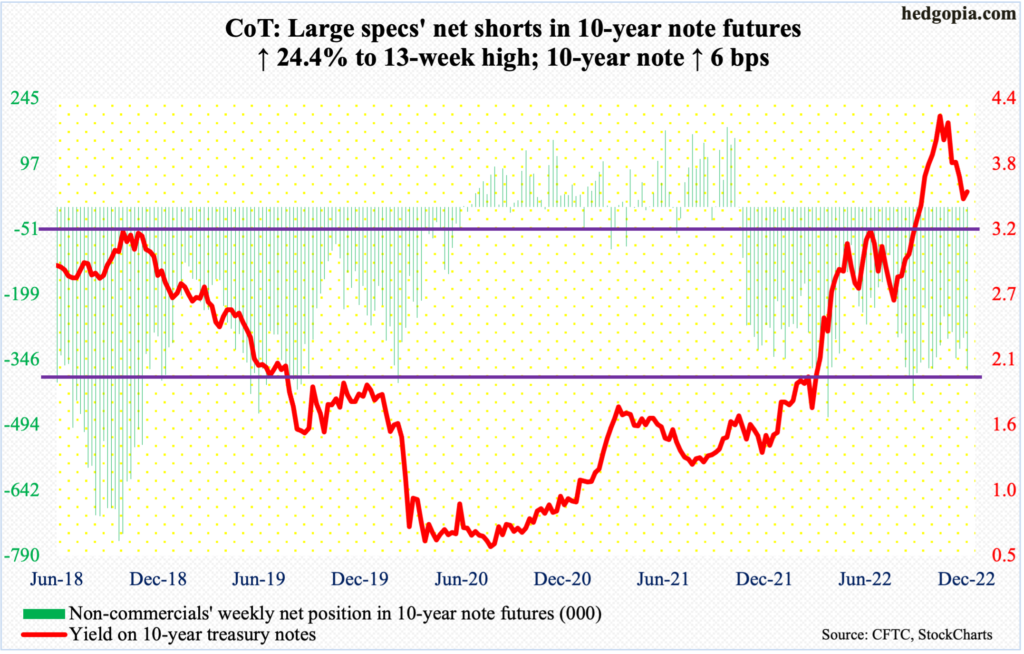
The FOMC meets next week.
The day the two-day meeting begins, the Bureau of Labor Statistics will report November’s consumer price index. It is unlikely a hotter-than-expected CPI on Tuesday will affect the outcome of next week’s meeting. A 50-basis-point raise is pretty much locked in.
October’s CPI was reported on November 10 and it was softer than expected; the S&P 500 celebrated this with a 5.5-percent jump. Should next week’s come in softer than what the consensus expects, it is too soon to say how it will impact stock prices, as markets have also begun to focus on rising recession prospects for next year.
Ahead of the meeting, futures traders expect the fed funds rate to peak just over five percent. Most importantly, they expect the central bank to begin easing by September of next year.
This does not quite jibe with what FOMC hawks, including Powell, are saying. They continue to suggest a pause in the early months next year and then go sideways for a while – meaning higher for longer. Markets want them to ease much sooner.
This is what is at stake. Markets and the Fed are on diverging paths (more on this here). From this standpoint, should November’s CPI come in softer than expected, it will be interesting to see if Powell changes his tune or stays put with his hawkish message. Equities will probably not like the latter scenario.
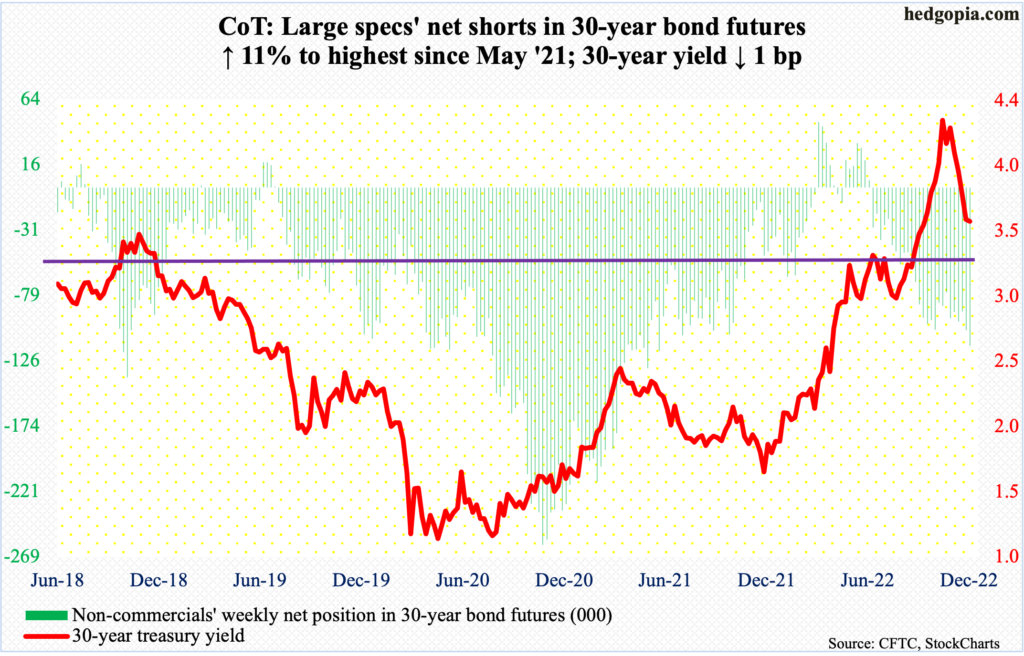
30-year bond: Currently net short 115.4k, up 11.4k.
Major economic releases for next week are as follows.
On Tuesday, the NFIB optimism index (November) and the consumer price index (November) are on deck.
Small-business optimism dropped 0.8 points month-over-month in October to 91.3 – a three-month low.
In the 12 months to October, headline and core CPI increased 7.7 percent and 6.3 percent respectively, with the former peaking at 9.1 percent in June and the latter at 6.6 percent in September. These peaks were the steepest since November 1981 and August 1982, in that order.
Thursday brings retail sales (November), industrial production (November) and Treasury International Capital data (October).
Retail sales jumped 1.3 percent m/m in October to a seasonally adjusted annual rate of $694.5 billion – a fresh record.
Capacity utilization in October declined 0.2 percent m/m to 79.9 percent. July’s 80.2 percent was the highest since September 2018. In the seven months from April to October, utilization crossed 80 percent in five.
Foreigners sold $283 billion in US stocks in the 12 months to September, down a tad from August’s record 12-month net selling of $293.5 billion. In March last year, they reached a record net buying of $404.7 billion.
WTI crude oil: Currently net long 285.3k, up 714.
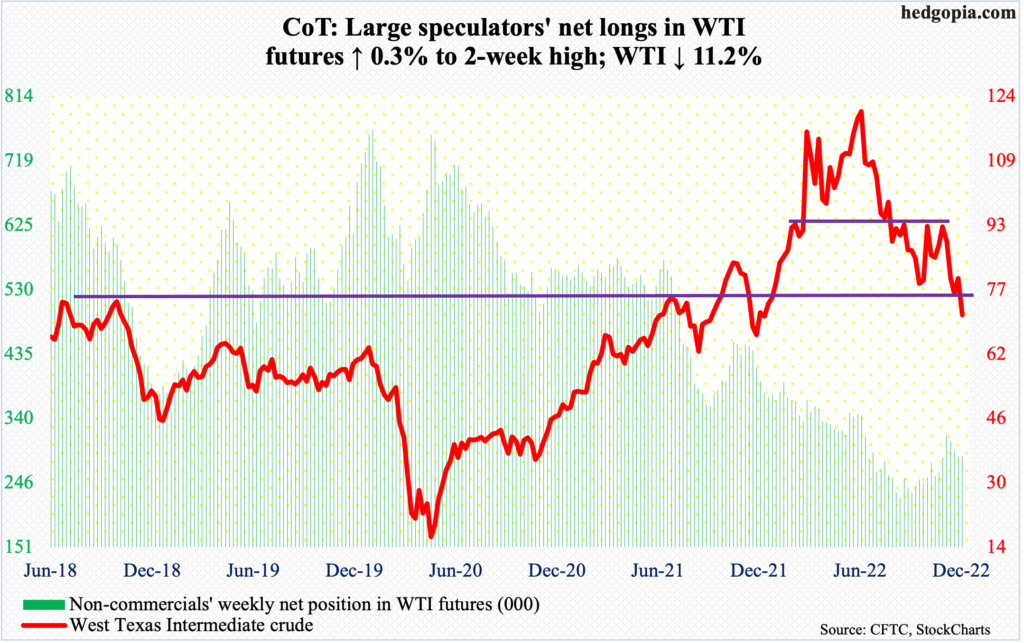
OPEC+ disappointed oil traders who had rallied WTI 4.8 percent last week expecting an output cut. The group instead decided to stick to its current targets. In October, OPEC+ cut output by two million barrels per day from November until the end of 2023. WTI collapsed 11.2 percent this week to $71.02/barrel.
With this, lateral support at $75-$76 was convincingly breached, and this is the level to watch going forward on rally attempts. Down below, there is decent support at $65.
In the meantime, as per the EIA, US crude production in the week to December 2 rose 100,000 b/d week-over-week to 12.2 million b/d. Crude imports dropped 25,000 b/d to six mb/d. As did crude stocks, which fell 5.2 million barrels to 413.9 million barrels. Gasoline and distillate inventory, however, rose – up 5.3 million barrels and 6.2 million barrels to 219.1 million barrels and 118.8 million barrels respectively. Refinery utilization increased three-tenths of a percentage point to 95.5 percent.
E-mini S&P 500: Currently net short 203.7k, down 457.
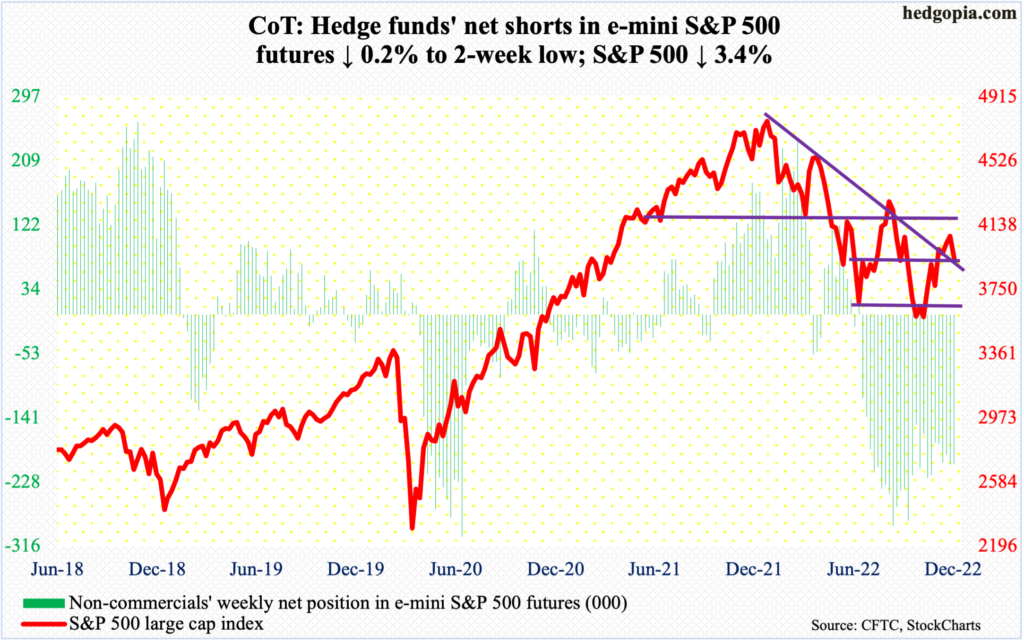
SPY (SPDR S&P 500 ETF) shorts have been leaving, providing an upside tailwind to the ETF/S&P 500. From bulls’ perspective, the problem is that the potential fuel for rally is increasingly losing its potency. As of end-November, short interest on the ETF dropped to the lowest since mid-January this year (chart here). For reference, the large cap index reached a record high of 4819 on January 4 before reversing, then reaching 3492 on October 13.
If non-commercials, too, began to short-cover, that would for sure help the bulls, but they are staying put with their net shorts in S&P 500 e-mini futures, which as of Tuesday stood at 203,719 contracts – fairly elevated.
Technically, the index was rejected at dual resistance early this month. The intraday high of 4101 on the 1st was an unsuccessful test of a falling trendline from January. Just underneath lied the down-sloping 200-day moving average, which was only reclaimed for three sessions.
Thus far, the index (3934) remains above 3900, a decisive loss of which is likely to result in a new round of selling. Non-commercials likely are anticipating a breach, hence are maintaining decent short exposure.
Euro: Currently net long 124.9k, up 2.6k.
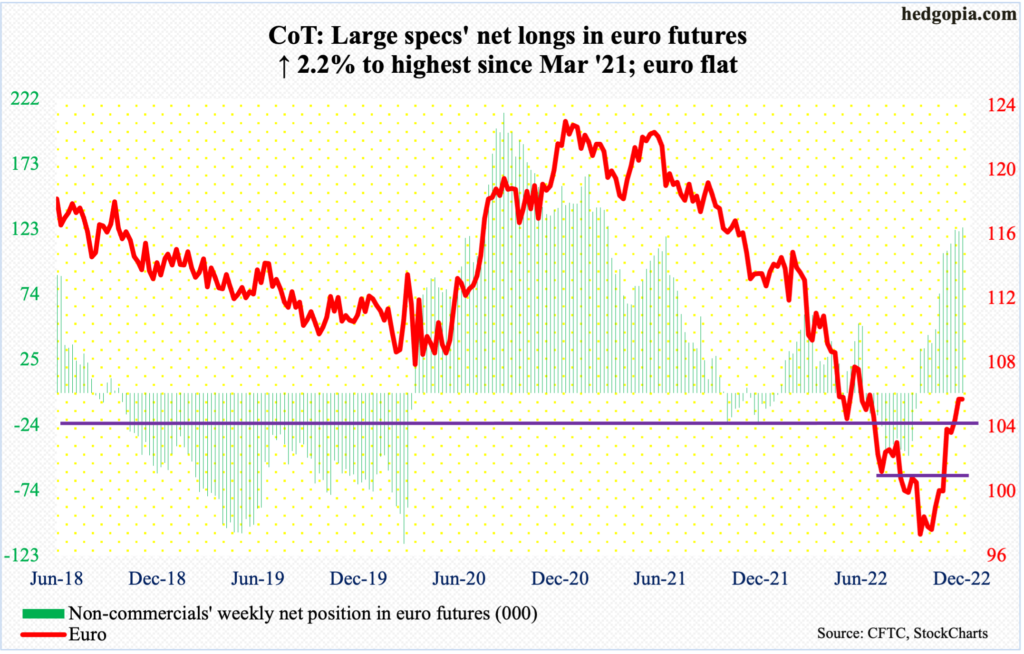
Last week, the euro broke out of/reclaimed $1.04, which has proven to be an important level for bulls and bears alike going back more than seven years. This week, a breakout retest did not quite occur, but the currency did tag $1.0459 on Tuesday, and that was it. It closed out the week at $1.0533, unchanged for the week. The weekly produced a back-to-back hammer.
The daily is extended. The euro bottomed at $0.9559 on September 28, so has come a long way. In the event of downward pressure, $1.04 awaits a spirited bull-bear duel.
Gold: Currently net long 115.1k, up 5.1k.
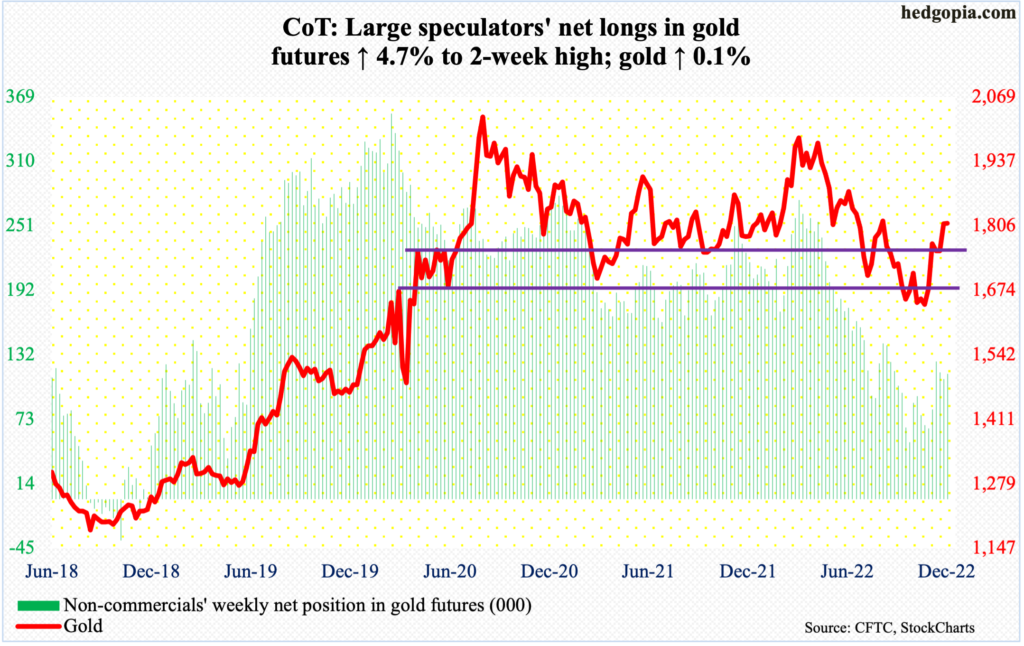
On the back of last week’s reclaiming of $1,760s-$1,770s, gold bugs went after another layer of resistance this week, but unsuccessfully. Gold closed out the week at $1,811, having tagged $1,823 on Monday. A takeout of $1,820s raises the odds $1,870s-$1,880s gets tested in due course.
The 200-day ($1,800) lies nearby. Should the average continue to attract bids, $1,820s resistance should yield sooner or later.
Nasdaq 100 index (mini): Currently net long 13.5k, up 3.8k.
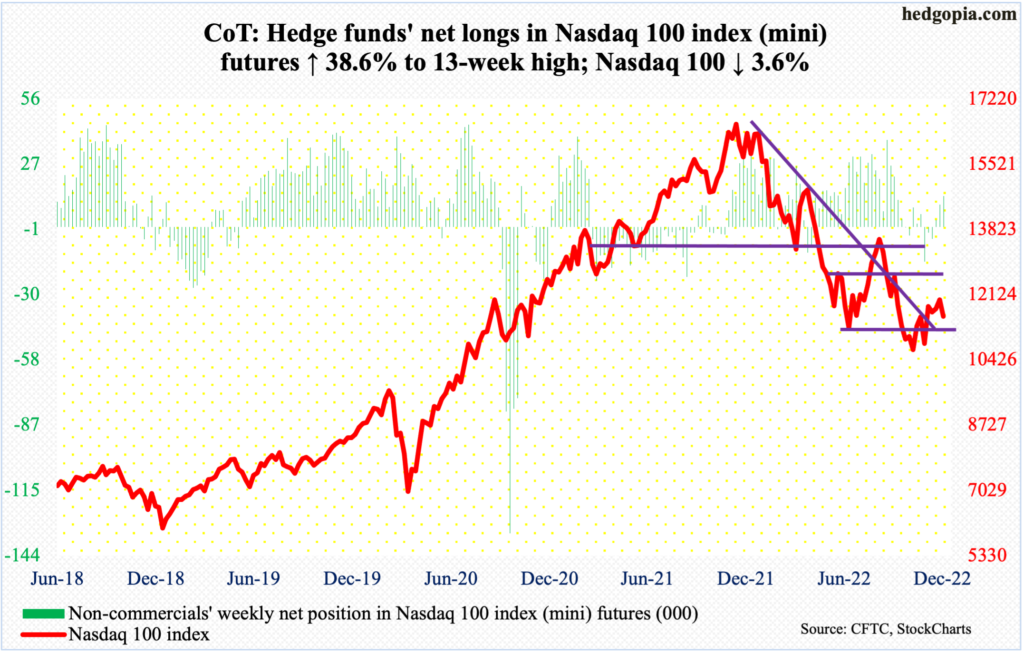
Last Wednesday’s 4.6-percent surge was followed by a long-legged doji/spinning top on Thursday, ticking 12115 intraday. The subsequent selloff brought the Nasdaq 100 down to 11432 by this Wednesday. This was just above the 50-day, which is struggling to turn up.
Perhaps ominously for tech bulls, some weekly indicators, including the RSI, are turning down from the median. Tech has lost its mojo and risks losing the 50-day eventually.
Russell 2000 mini-index: Currently net short 73.4k, up 15.8k.
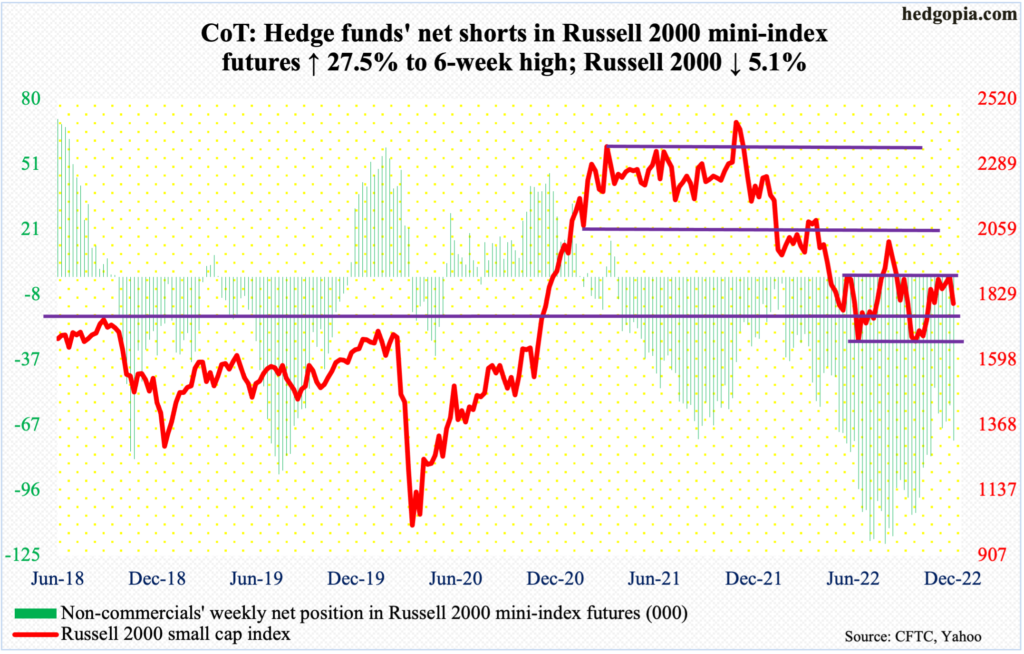
The Russell 2000 plunged 5.1 percent this week. Small-cap bulls did their best to take back 1900 but came up short. Several times last week, the level was tested, only to see sellers get active. By the end of this week, the small cap index went sub-1800 to 1797.
Bulls have been hammering at 1900 for several weeks now. Here is why the failure is significant.
The Russell 2000 peaked in November last year at 2459 and then dropped all the way to 1642 by October 13 this year. Along the way, a major breakdown occurred mid-January, losing 2080s; for 10 months leading up to that, the small cap index went back and forth between 2080s and 2350s. It then seesawed between 2080s and 1900, followed by a ping pong match between 1900 and 1700; 1700 is where it broke out of in November 2020.
Currently, the index is exactly midway between 1900 and 1700. At this point, it is a toss-up as to which way it goes, with downward bias toward 1700 the most likely outcome.
US Dollar Index: Currently net long 24.9k, down 6.
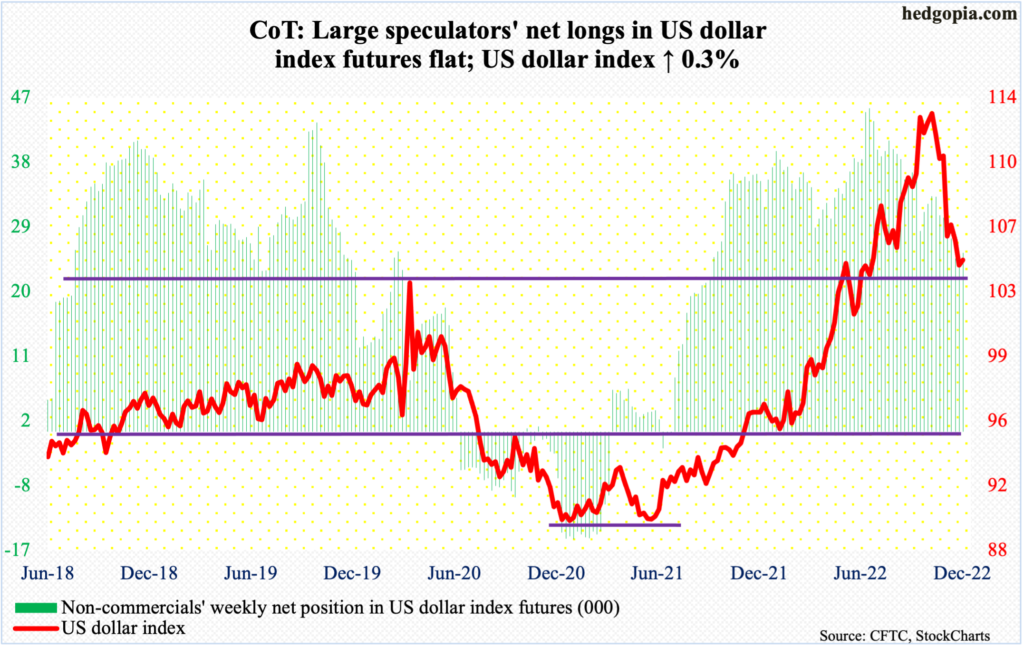
Dollar bulls are not letting go of 104. Both this week and last, the level was tested and held firm, closing the week out at 104.80.
This level has proven to be important for both bulls and bears going back to at least 2017. The US dollar index broke out of it in the middle of this year, before reaching a major high on September 28 tagging 114.75 – the highest print since May 2002. This was then followed by several lower highs. That is why a loss of 104 will be a major development, should one occur.
VIX: Currently net short 74.6k, up 7k.
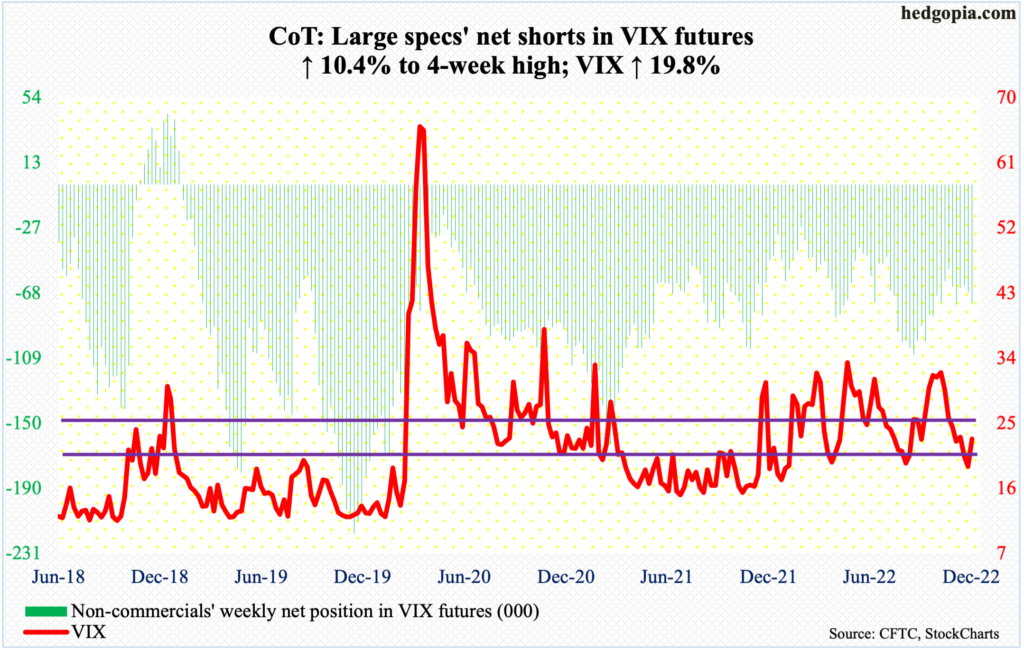
Volatility bulls were unable to defend low-20s, but not the high-teens. Last Friday’s intraday low of 18.95 just about matched the low of August as well as that of March/April. On both those occasions, VIX then proceeded to rally toward 35.
This time around, should history repeat itself, the volatility index (22.83) is just getting going. Immediately ahead, there is resistance at mid-20s, with both the 50- and 200-day (26.07 and 26.14 respectively) lying around there.
Meanwhile, since early November, the CBOE equity-only put-to-call ratio has produced six one-or-higher readings, indicating investor panic. But there is no panic currently. There arguably was in early October. Besides, these off-the-chart readings have also come on days the S&P 500 rallied, sometimes big (more on this here). It is hard to make a head or tail of this behavior – unless equity longs are not really buying the strength of the past couple of months and are hedging any chance they get.
Thanks for reading!
