
Following futures positions of non-commercials are as of January 6, 2023.
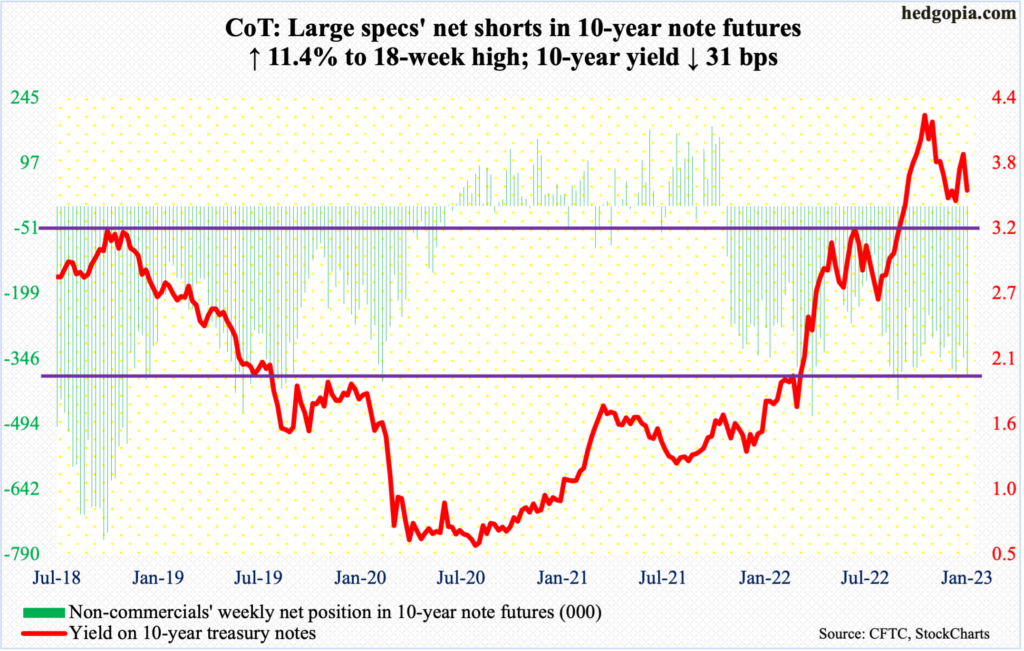
10-year note: Currently net short 383.6k, up 39.4k.
FOMC minutes for the December 13-14 meeting, out Wednesday, essentially repeated what the post-meeting statement and/or Chair Jerome Powell said in the post-meeting presser three weeks ago.
On the 14th, Chair Powell was as hawkish as he could get, reminding the markets that there would be no rate cuts this year. “Historical experience cautions strongly against prematurely loosening policy. I wouldn’t see us considering rate cuts until the committee is confident that inflation is moving down to two percent in a sustainable way.”
This week’s minutes told us that with inflation still well above the committee’s longer-run goal of two percent, participants agreed that inflation was unacceptably high and that “no participants anticipated that it would be appropriate to begin reducing the federal funds rate target in 2023.”
The US labor market remains strong despite dogged efforts by the Federal Reserve to slow it down. This was evident in this week’s JOLTs report for November and the payrolls report for December as well as the weekly unemployment claims.
The problem is that goods inflation is slowing down, but services inflation is not. Services tend to be labor-intensive. In this regard, December’s ISM services PMI went sub-50 to 49.6, which was much weaker than the expected 55; this was the first contractionary print since May 2020. This suggested services jobs could weaken in months ahead. Realizing this, both equity and bond markets rallied big on Friday. And that is a potential problem.
Per the minutes, participants also noted that, because monetary policy worked importantly through financial markets, an unwarranted easing in financial conditions, especially if driven by a misperception by the public of the committee’s reaction function, would complicate the committee’s effort to restore price stability. In other words, the Fed would prefer equities not rally in anticipation of a looser policy; else, the Fed will be forced to delay implementation of a looser policy. A catch-22!
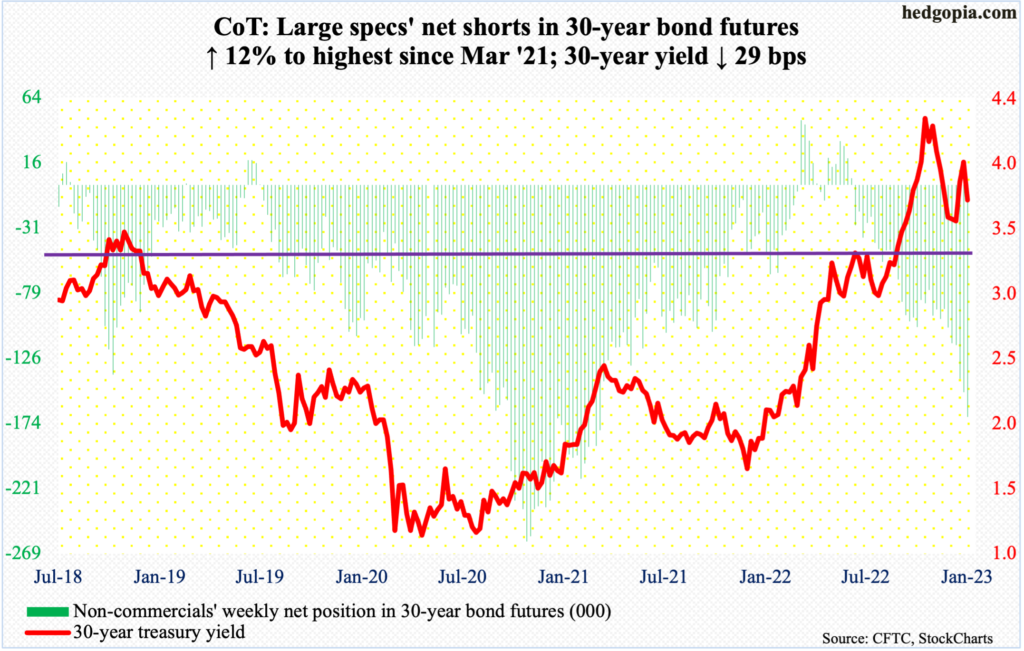
30-year bond: Currently net short 169.3k, up 18.2k.
Major economic releases for next week are as follows.
The NFIB optimism index (December) is scheduled for Tuesday. Small-business optimism rose six-tenths of a point month-over-month in November to 91.9, which was a two-month high.
Thursday brings the consumer price index (December). In the 12 months to November, headline and core consumer inflation increased 7.1 percent and six percent, which respectively peaked at 9.1 percent and 6.6 percent last June and September.
The University of Michigan’s consumer sentiment index (January, preliminary) is on tap for Friday. In December, sentiment rose 2.9 points m/m to 59.7 – a two-month high.
WTI crude oil: Currently net long 271.1k, down 33.6k.
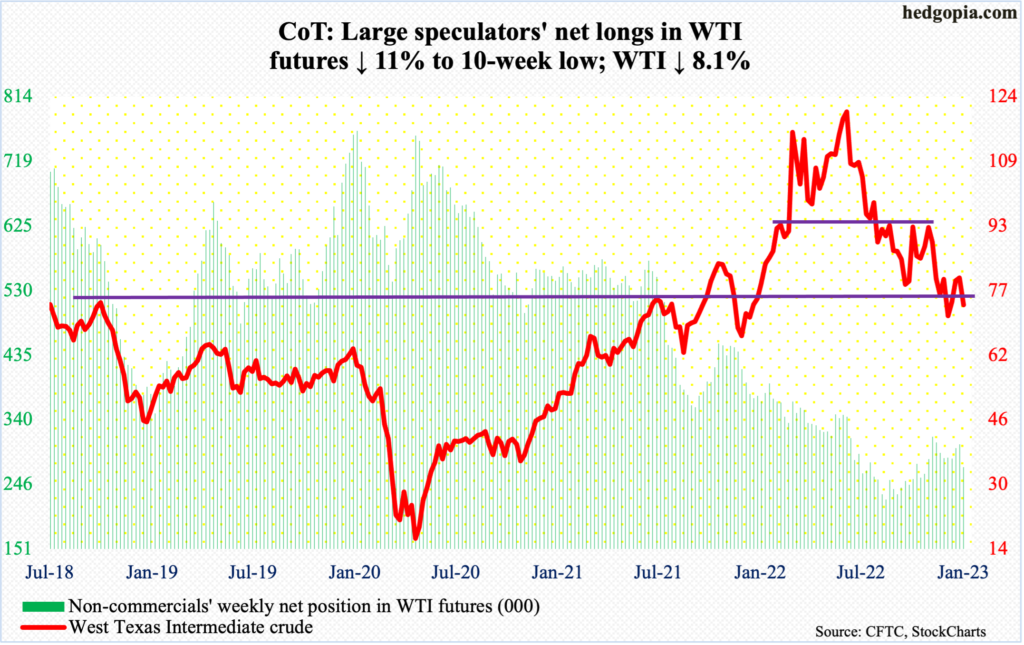
After rallying for three weeks, WTI did not have much left to break out of a falling trend line from June. On Tuesday, the crude tagged $81.50 intraday, which barely fell short of the trend line in question. Besides, this was where the 50-day moving average (now $80.56) and the daily upper Bollinger band ($81.39) lied. Facing a confluence of resistance, selling picked up momentum. By Thursday, WTI ticked $72.46 intraday, closing the week out at $73.77/barrel.
In the first half last month, WTI attracted bids at $70. The daily lower Bollinger band lies at $70.63, which, having just been rejected at the upper band, may just act as a magnet.
In the meantime, as per the EIA, US crude production in the week to December 30 increased 100,000 barrels per day to 12.1 million b/d. Crude imports decreased 540,000 b/d to 5.7 mb/d. Stocks of gasoline and distillates fell as well – by 346,000 barrels and 1.4 million barrels respectively to 222.7 million barrels and 118.8 million barrels. Crude inventory, however, increased 1.7 million barrels to 420.6 million barrels. Refinery utilization plunged 12.4 percentage points to 79.6 percent.
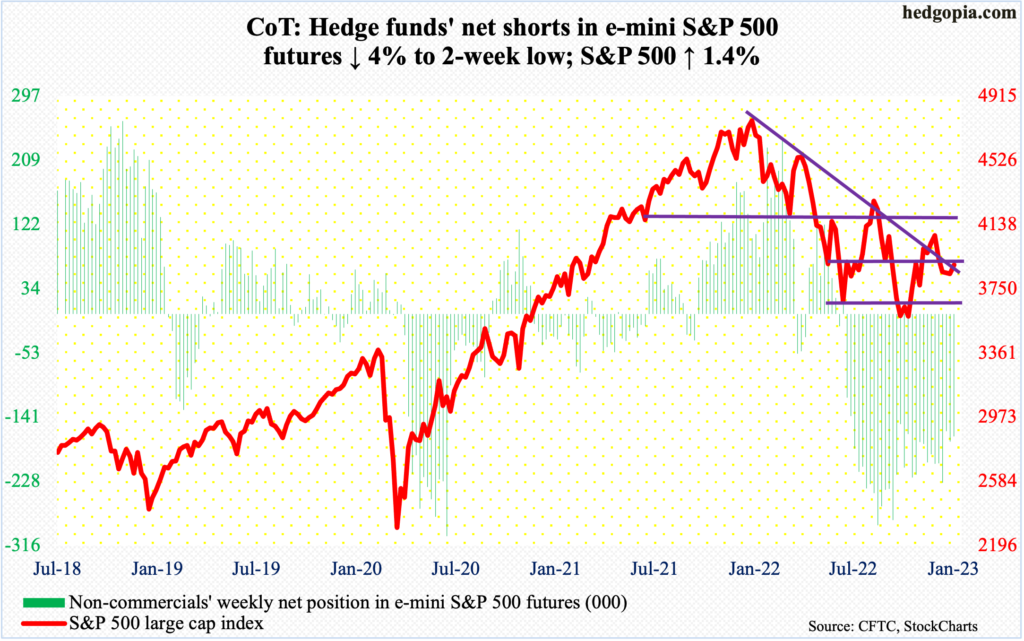
E-mini S&P 500: Currently net short 167.3k, down 7k.
US-based equity funds went back to losing funds, bleeding $16.2 billion in the week to Wednesday. This followed inflows of $1 billion last week, which came after experiencing $68.3 billion in outflows over five weeks (courtesy of Lipper). In the week to Wednesday, SPY (SPDR S&P 500 ETF), VOO (Vanguard S&P 500 ETF) and IVV (iShares Core S&P 500 ETF) combined lost $3.4 billion, having come on the heels of two-week withdrawals of $11.1 billion (courtesy of ETF.com).
Until Thursday, the S&P 500 was down 0.8 percent for the week. Then came Friday’s post-December jobs reaction in which the large cap index rallied 2.3 percent, for a weekly gain of 1.4 percent; the 50-day (3904) was tagged in the session. There is room for the daily to continue to rally. A takeout of the average opens the door toward the 200-day at 3996, which along with 4100, where sellers showed up twice in the first half last month, could prove to be tough to crack.
Euro: Currently net long 129.9k, down 16.2k.
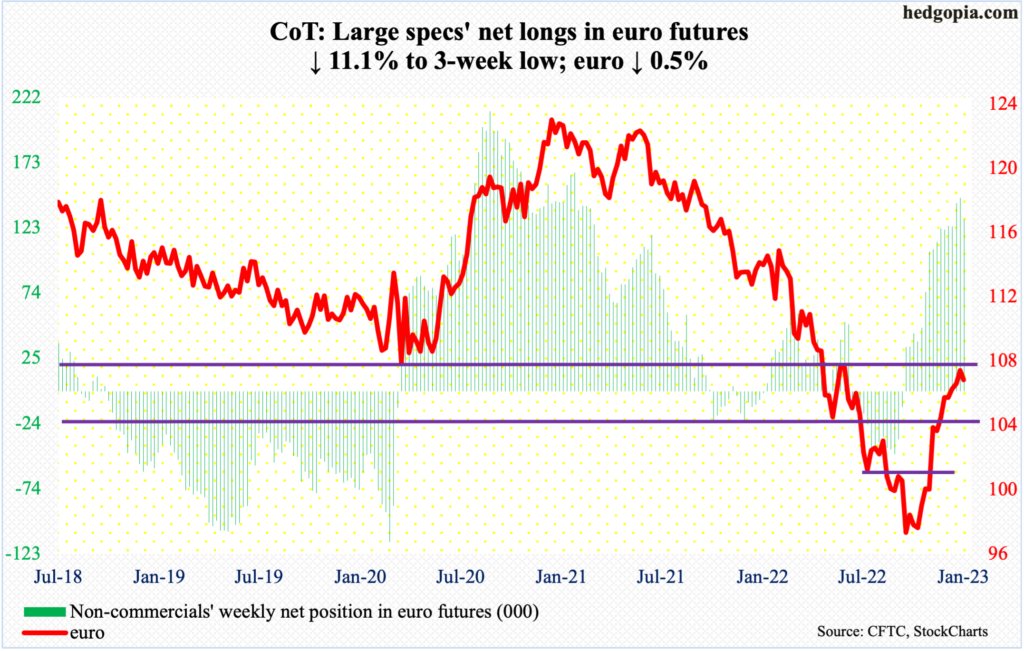
In an outside day last Friday, the euro rallied 1.2 percent. More often than not, this pattern indicates a potential change in trend.
The euro rallied from $0.9559 late September last year to $1.0736 on December 15, before coming under slight pressure. Before staging a reversal last Friday, the currency dropped to $1.0485, ending the session at $1.0643.
If last Friday’s action represents an important reversal, euro bulls for sure hope this results in the takeout of $1.07-$1.08, which has proven to be an important level for bulls and bears alike going back several years. Since the mid-December high, the euro has essentially gone sideways.
Gold: Currently net long 141.7k, up 4.8k.
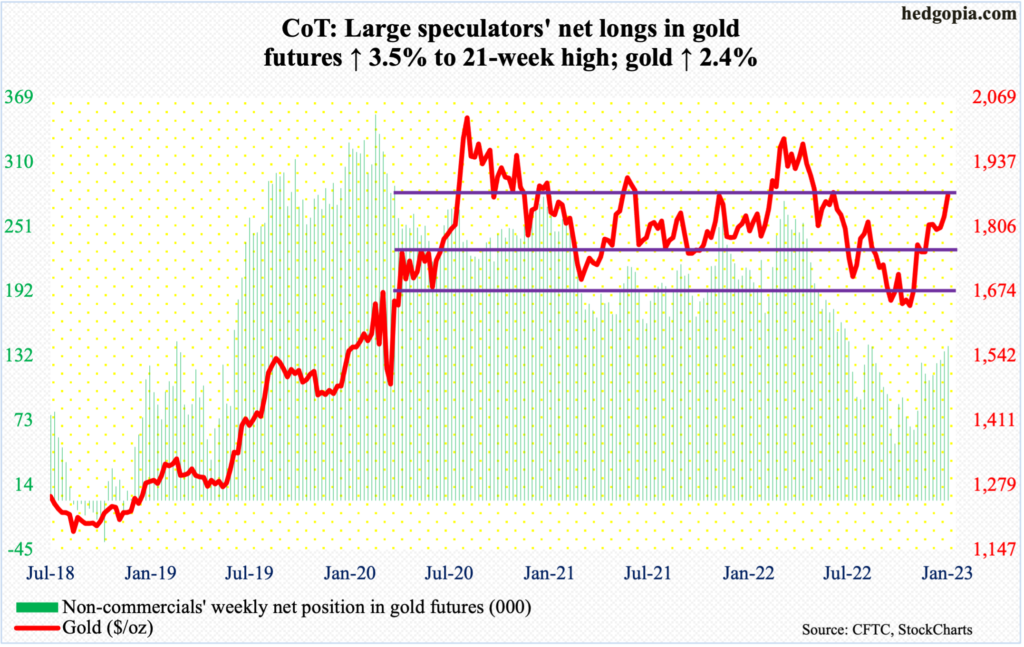
Gold decisively broke out of $1,820s as soon as the trading week began Tuesday. By Thursday, the metal tested the breakout, tagging $1,830 intraday. This led to Friday’s 1.6-percent jump, as the US dollar index slumped 1.1 percent.
The yellow metal is just under horizontal resistance at $1,880s. Gold bugs would have scored another victory should this yield. After this, the next level to watch is $1,920s.
Non-commercials continue to add to net longs and exude confidence.
Nasdaq 100 index (mini): Currently net long 1.4k, up 190.
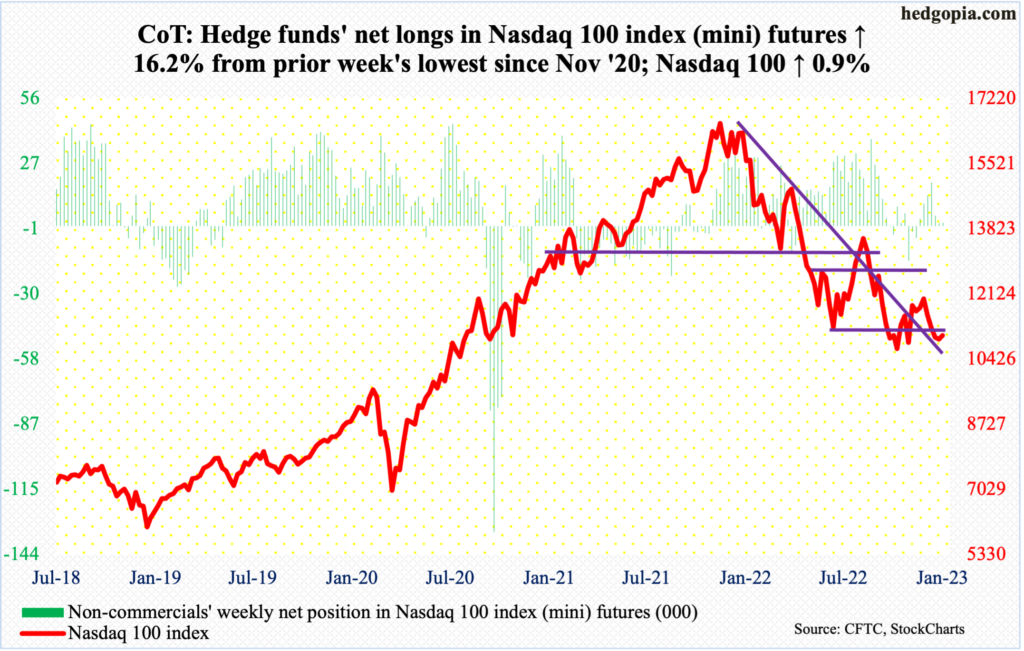
The Nasdaq 100 formed a back-to-back dragonfly doji on the weekly, finding support at 10671 last week and at 10696 this week. The pattern can signal a reversal in price. This week’s 0.9-percent rally comes after four consecutive down weeks.
Immediately ahead, there is horizontal resistance at 11400, with the 50-day at 11368. The tech-heavy index ended the week at 11040.
Russell 2000 mini-index: Currently net short 65.4k, down 4.6k.
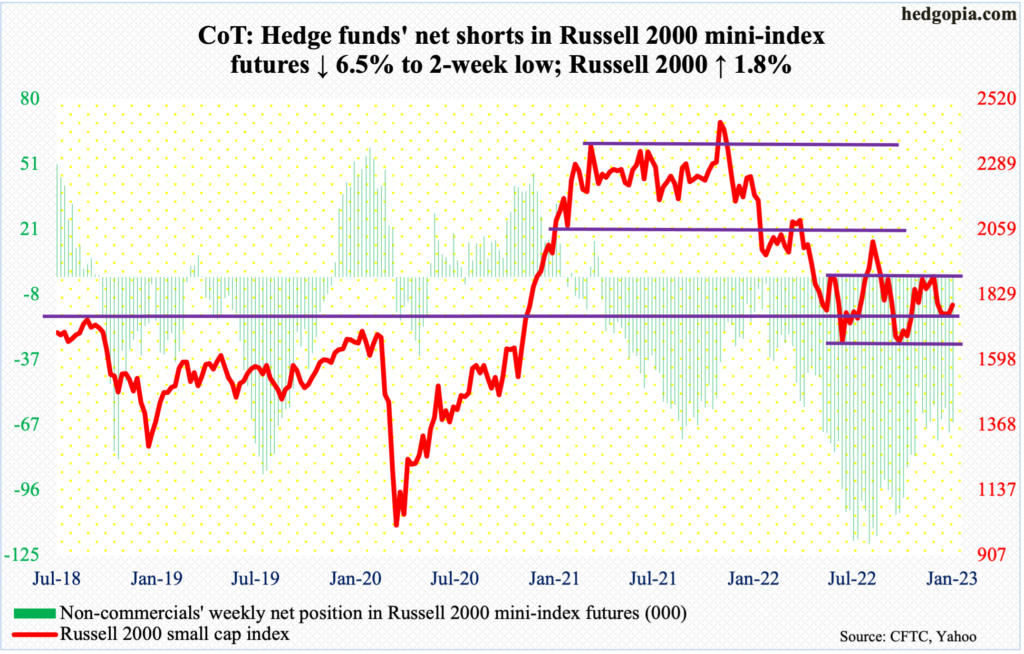
The Russell 2000 (1793) closed just about midway between 1700 and 1900 – a range the small cap index has traded since January last year. In the middle of November and early December, there were several rejections at 1900. After that, small-cap bears tried several times to reclaim 1700, but to no avail.
Bulls have a shot at 1900. But before that, they have to first take care of the 50- and 200-day (1813 and 1836 respectively).
US Dollar Index: Currently net long 17.8k, up 820.
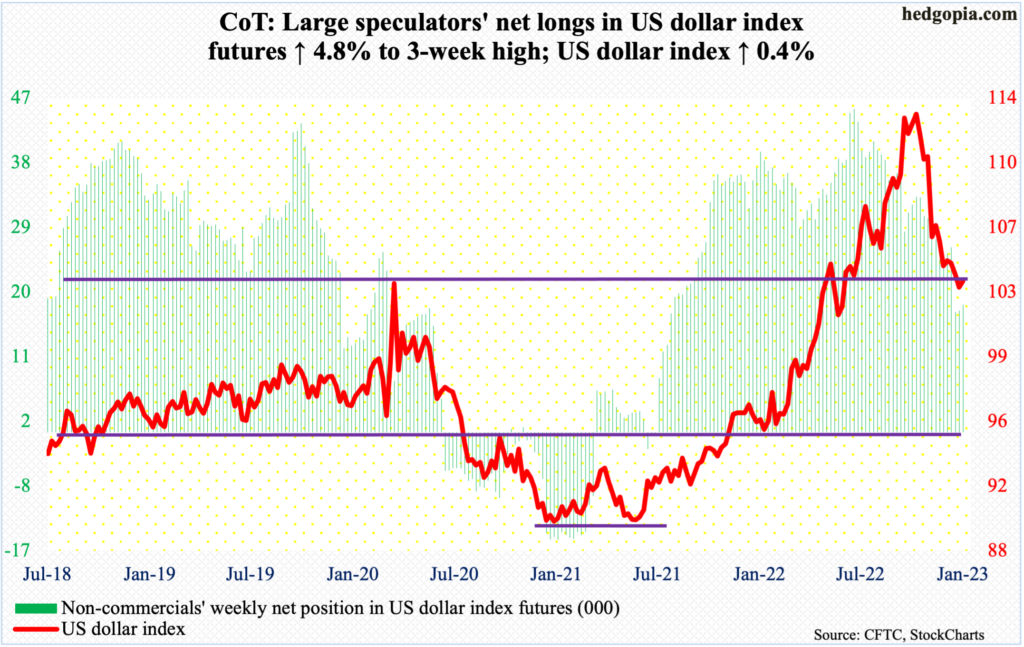
The US dollar index experienced a huge reversal this week, forming a shooting star. Friday’s action, in which the index ticked 105.50 intraday but reversed to end down 1.1 percent to 103.65, was primarily responsible for the weekly candle.
This was the second week in a row the index closed below 104, which goes back to at least 2017. The breach is not decisive yet, but it is getting close.
VIX: Currently net short 68k, down 415.
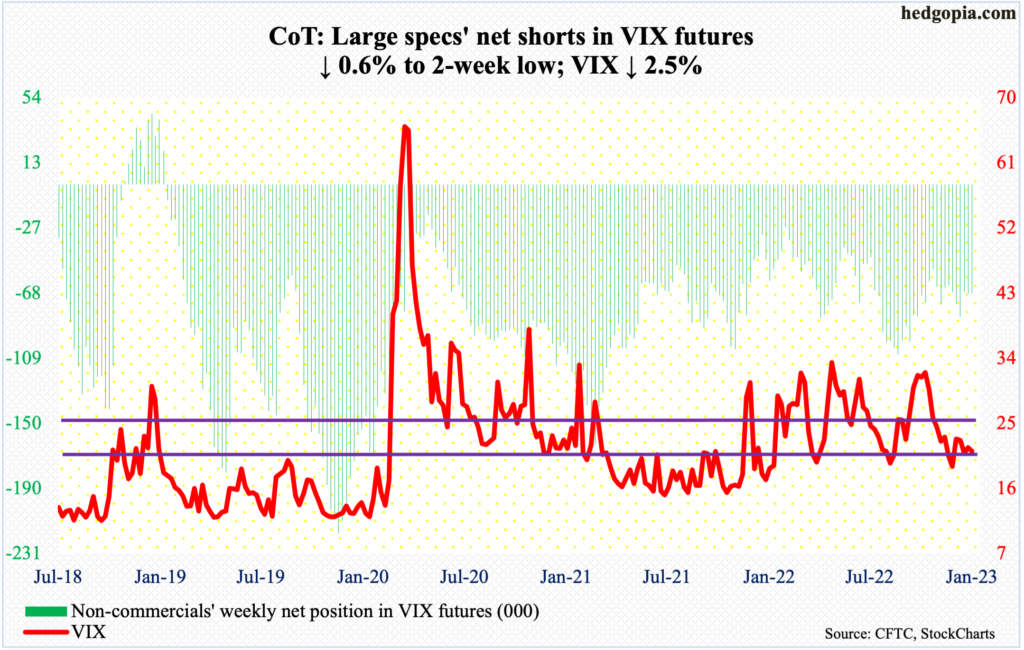
In all four sessions this week, VIX got repelled at the falling 50-day, which also resembles a falling trend line from mid-December.
The volatility index closed out the week at 21.13. Trend-line support going back to early December gets tested at 20.70s, which likely gives way in the sessions ahead, then raising odds of a move toward 20.
Thanks for reading!
