
Following futures positions of non-commercials are as of January 17, 2023.
10-year note: Currently net short 545.1k, up 133.7k.
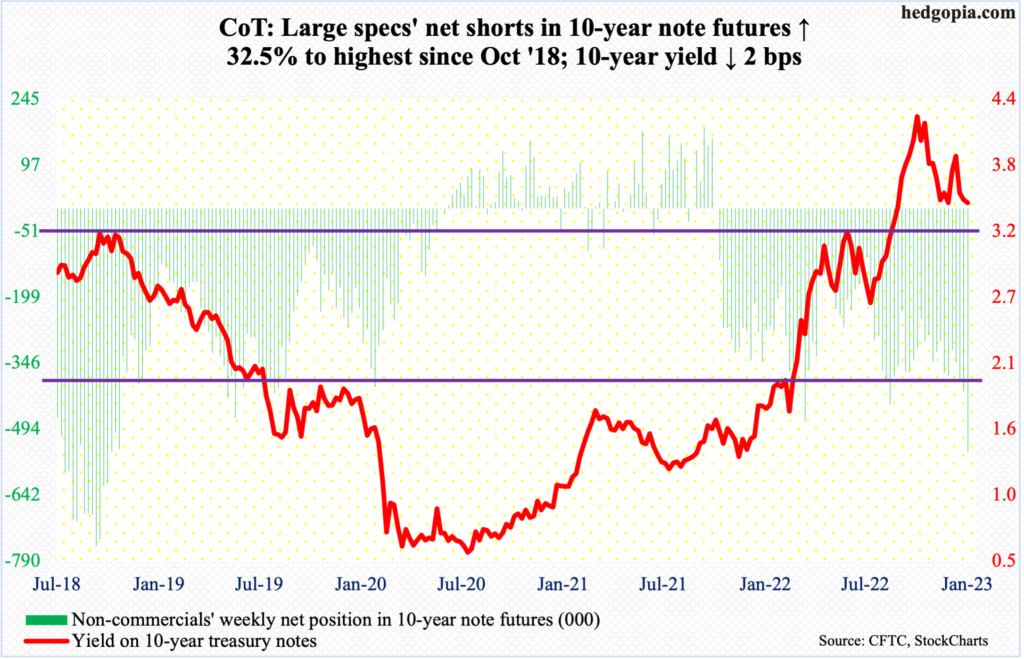
The 10-year treasury yield sits at a crucial juncture. It ended this week at 3.48 percent. Around 3.4 percent lies important horizontal support. Intraday Thursday, these notes were yielding 3.37 percent, before turning higher.
Rates peaked at 4.33 percent last October, having bottomed at 0.398 percent in March 2020 and most recently at 2.52 percent last August. Needless to say, the 10-year yield rallied strongly before peaking last October.
On the monthly, the 10-year yield has a lot more to go on the downside. On the daily, however, there is room to rally. Thursday’s intraday low of 3.37 percent came just above the 200-day moving average at 3.31 percent.
Immediately ahead, there is horizontal resistance at 3.64 percent; just above lies the 50-day at 3.66 percent. Non-commercials must be at least hoping rates get to these levels in the near future, as they are now aggressively net short 10-year note futures. As of Tuesday, they had accumulated 545.1 million contracts in net shorts, which are the highest since October 2018.
These traders must also be hoping that they are not forced to cover at some point in the future. Several times in the past, short squeeze has followed as soon as net shorts build enough to tilt the balance.
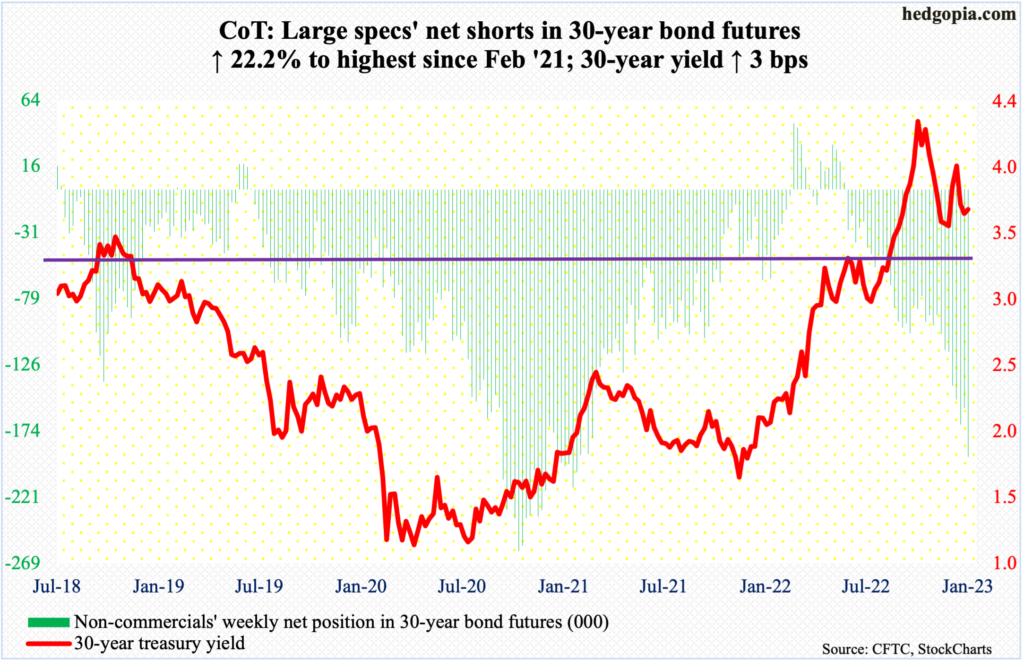
30-year bond: Currently net short 192.4k, up 35k.
Major economic releases for next week are as follows.
Thursday brings GDP (4Q22, first estimate), durable goods orders (December) and new home sales (December).
The Atlanta Fed’s GDPNow model forecasts real GDP growth of 3.5 percent last quarter. The economy grew 3.2 percent in 3Q. This follows a back-to-back contraction in the first half last year – drop of 1.6 percent in 1Q and 0.6 percent in 2Q, in that order.
Orders for non-defense capital goods ex-aircraft – proxy for business capex plans – inched up 0.1 percent month-over-month in November to a seasonally adjusted annual rate of $75.1 billion, which set a new record.
November sales of new homes increased 5.8 percent m/m to 640,000 units (SAAR) – a three-month high.
Personal income/spending (December) and the University of Michigan’s consumer sentiment index (January) are scheduled for Friday.
In the 12 months to November, headline and core PCE (personal consumption expenditures) grew 5.5 percent and 4.7 percent. They peaked last year – headline in June at seven percent and core in February at 5.4 percent.
January’s preliminary reading put consumer sentiment at 64.6, up 4.9 points m/m. This was a nine-month high.
WTI crude oil: Currently net long 280.3k, up 29.2k.
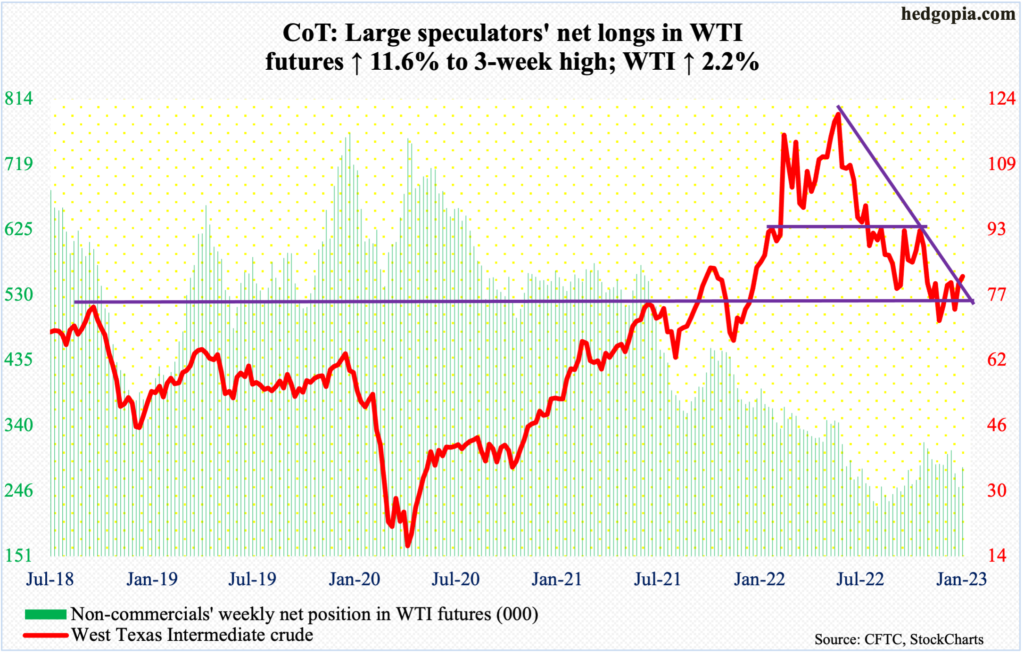
WTI ($81.64/barrel) this week poked its head out of a falling trend line from last June when it made a lower high of $123.68 versus the $130.50 reached in March last year.
More important perhaps is the fact that the crude closed out the week right at lateral resistance going back to October 2021. A breakout here raises the odds it is headed toward $84-$85 at first and maybe even $93-$94.
In the meantime, as per the EIA, US crude production in the week to January 13 was unchanged week-over-week at 12.2 million barrels per day. Crude imports grew 511,000 b/d to 6.9 mb/d. Stocks of crude and gasoline rose as well – by 8.4 million barrels and 3.5 million barrels respectively to 448 million barrels and 230.3 million barrels. Distillate inventory, however, decreased 1.9 million barrels to 115.8 million barrels. Refinery utilization rose 1.2 percentage points to 85.3 percent.
E-mini S&P 500: Currently net short 226.8k, up 13.6k.
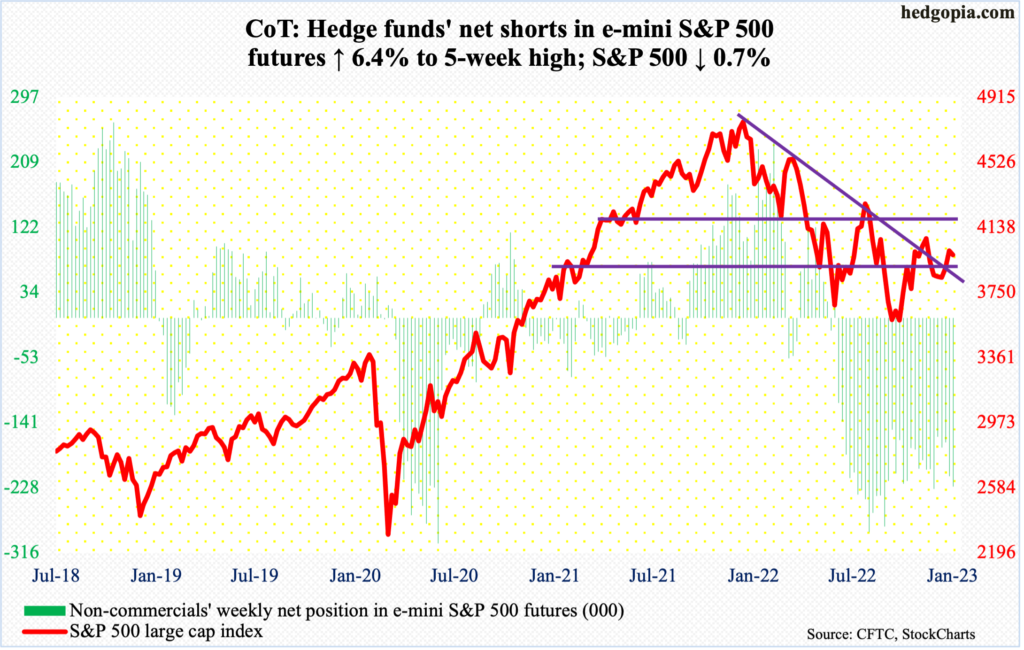
US-based equity funds continued to bleed – losing $4.1 billion in the week to Wednesday; this was the third straight weekly outflows and the eighth out of the last nine, during which $88.8 billion was redeemed (courtesy of Lipper). In the meantime, SPY (SPDR S&P 500 ETF), VOO (Vanguard S&P 500 ETF) and IVV (iShares Core S&P 500 ETF) combined drew $411 million in the week to Wednesday, following inflows of $426 million in the prior week (courtesy of ETF.com). Going by the flows pattern into these ETFs, it increasingly feels like conviction is lacking as to which way the S&P 500 is headed.
Indeed, the large cap index on Tuesday ticked 4015 to get denied at a falling trendline from last January when it peaked at 4819. That said, by the end of the week, straight-line support at 3900 was defended, closing at 3973. In a span of three sessions, the 50- and 200-day were lost and regained right away (3929 and 3969 respectively).
The trendline in question now gets tested just south of 4000. In the event this gives way, there is formidable roadblock at 4100.
Euro: Currently net long 127k, down 8k.
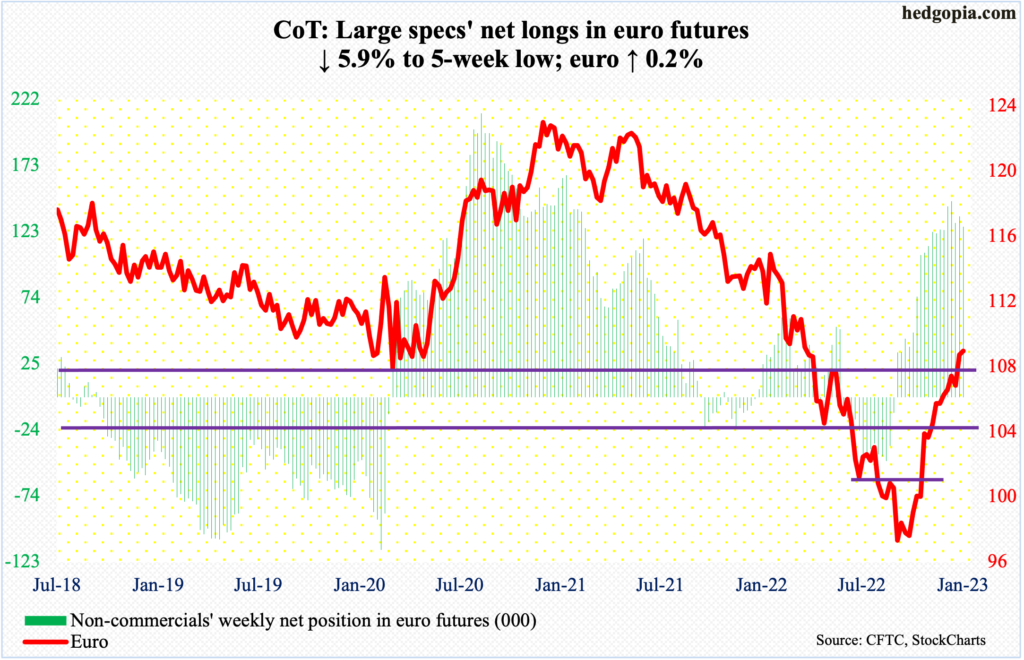
Euro bulls continued to go after lateral resistance at $1.07-$1.08. This week, the currency inched up 0.2 percent to $1.0857, having tagged $1.0887 on Wednesday.
It just feels like the euro is itching to break out, having gone sideways at/around $1.0860s the last six sessions.
Gold: Currently net long 153.2k, up 2.7k.
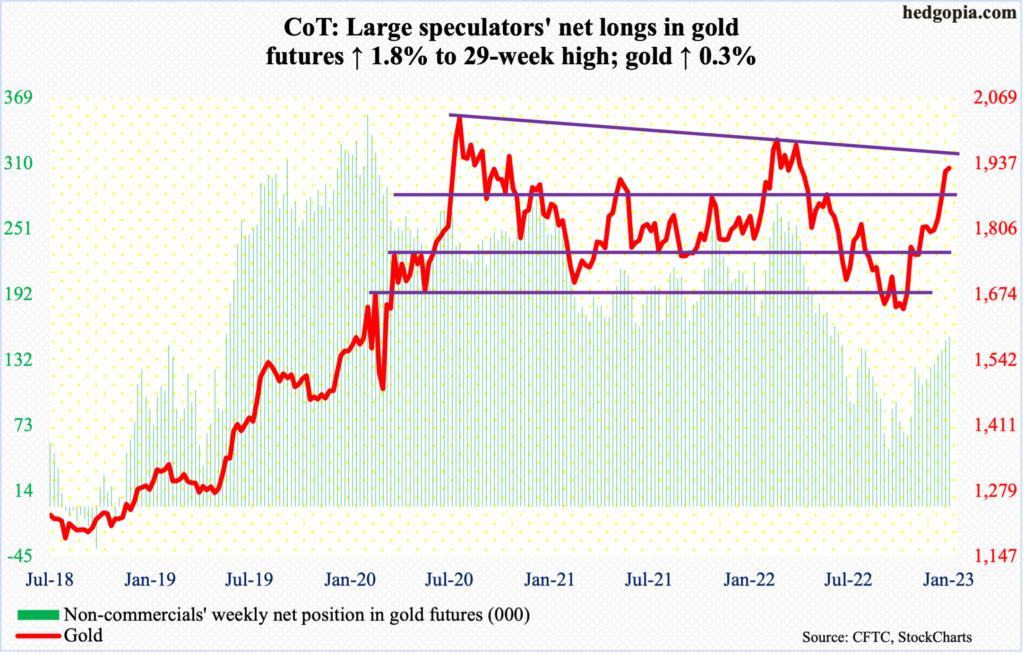
Non-commercials continued to add, taking net longs in gold futures to a 29-week high. They have ridden the recent rally in the metal very well.
During last September and October, gold ($1,928/ounce) bottomed at $1,620s. Its most recent breakout took place three weeks ago – out of $1,820s.
Trendline resistance (on an intraday basis) from August 2020 when gold peaked at $2,089 lies at $1,960. Breakout opens the door toward $2,080s, which was also hit in March last year.
Nasdaq 100 index (mini): Currently net short 20.6k, up 12.5k.
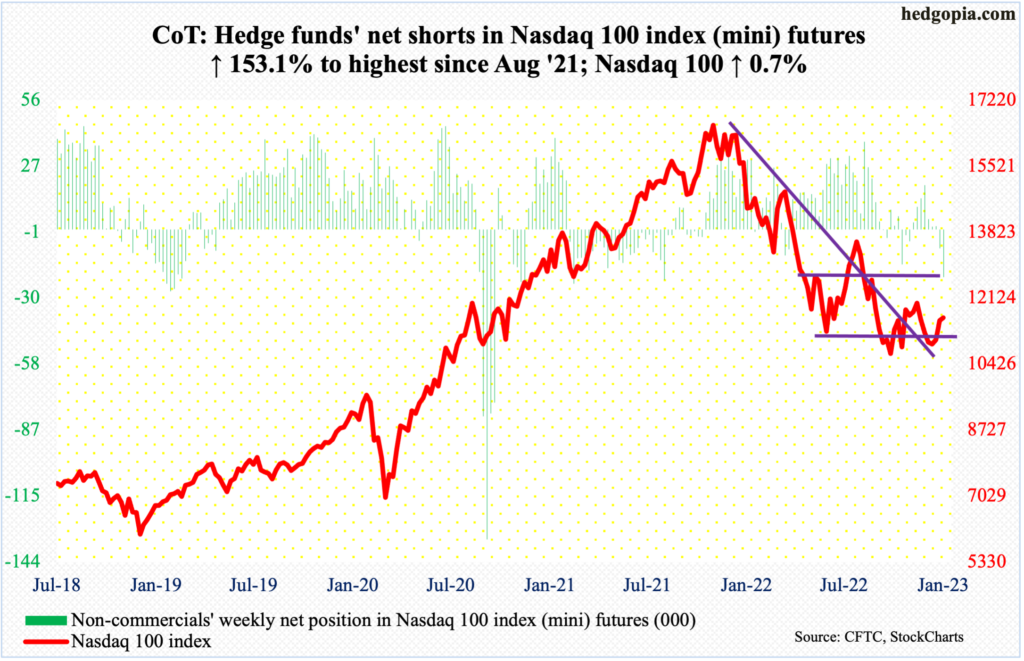
From down 2.5 percent at Thursday’s low, the Nasdaq 100 reversed to end the week up 0.7 percent. This was the third straight up week. Earlier, between the November 2021 record high of 16765 and the low last October of 10441, the tech-heavy index tumbled 37.7 percent.
Friday’s 2.9-percent jump pushed the index (11619) back above the 50-day, with bulls showing willingness to own tech even as US tech behemoths will be reporting earnings results the next couple of weeks.
Ideally, they would like to at least test straight-line resistance at 12100s; the 200-day lies around there at 12064.
Although the fact remains that non-commercials, who switched to net short Nasdaq 100 index (mini) futures for the first time in eight weeks last week, raised their holdings to highest since August 2021 this week.
Russell 2000 mini-index: Currently net short 62.9k, up 4.8k.
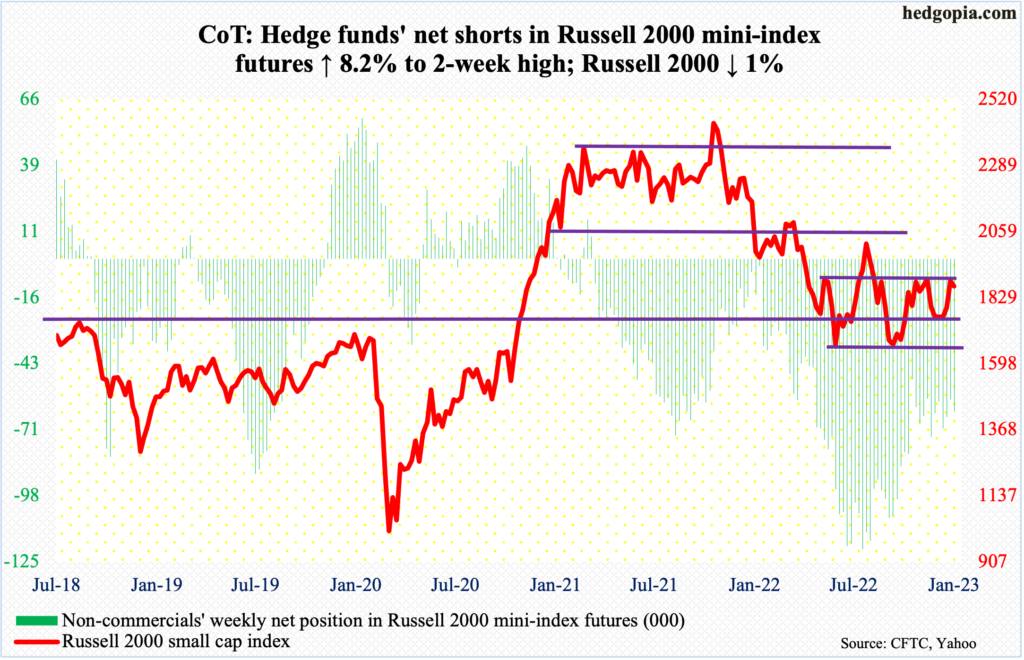
Small-cap bulls managed to push through 1900 on the Russell 2000 on Wednesday, but only intraday, with the session tagging 1904 but closing at 1854. Thus ended one more attempt to break out of a one-year, 200-point range between 1700 and 1900.
In the middle of November and early December, there were several rejections at 1900. Wednesday’s was the first serious attempt this year. Although unsuccessful thus far, the small cap index (1867) remains well within striking distance of another go at it.
US Dollar Index: Currently net long 13.4k, down 3.2k.
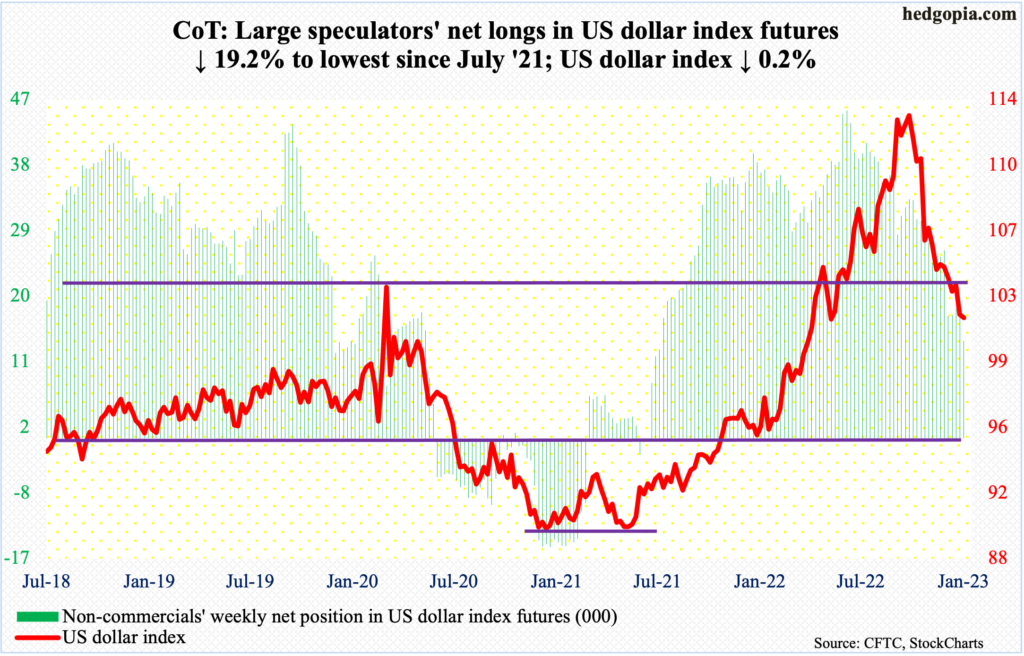
Last week, the US dollar index fell 1.6 percent to decisively lose 104, which goes back to at least 2017. This week, dollar bears struggled to genuinely build on that, only falling 0.2 percent and forming a weekly spinning top.
On Wednesday, the index dropped as low as 101.27, which was just above decent support at 101, closing out the week at 101.78. Should 101 hold, 104 is the path of least resistance.
VIX: Currently net short 52.4k, down 20.5k.
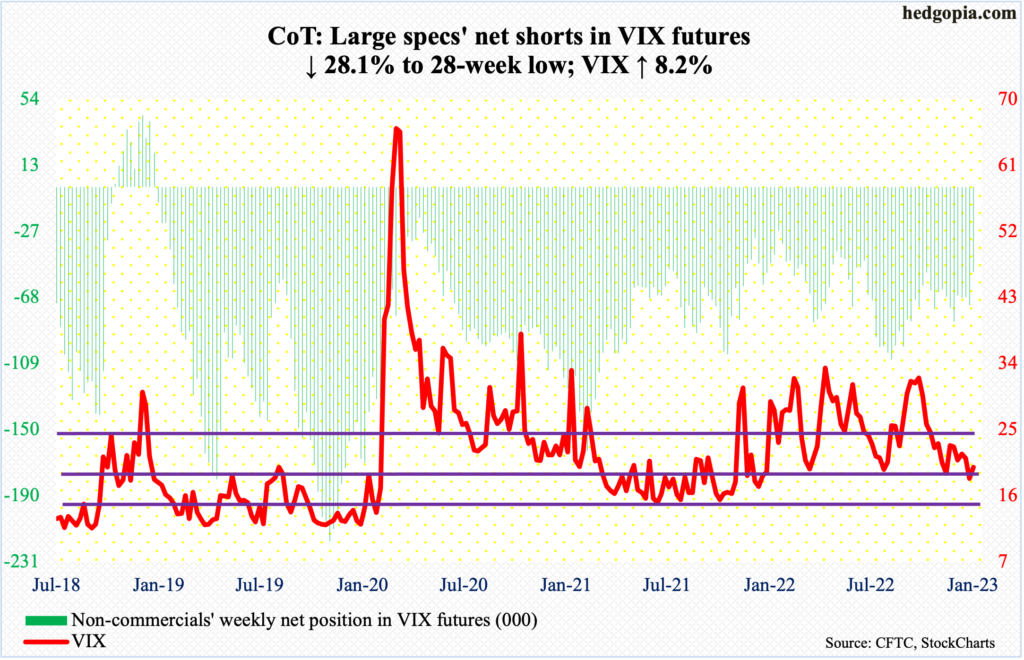
Going back to March last year, VIX has consistently found support at 18-19. This was once again the case, as the volatility index ticked 18.01 on the 13th (this month). This week, it closed at 19.85.
Regardless what happens next week or the next few weeks, VIX remains in the low end of its long-term range.
Thanks for reading!
