
Following futures positions of non-commercials are as of June 13, 2023.
10-year note: Currently net short 691.9k, down 61.8k.
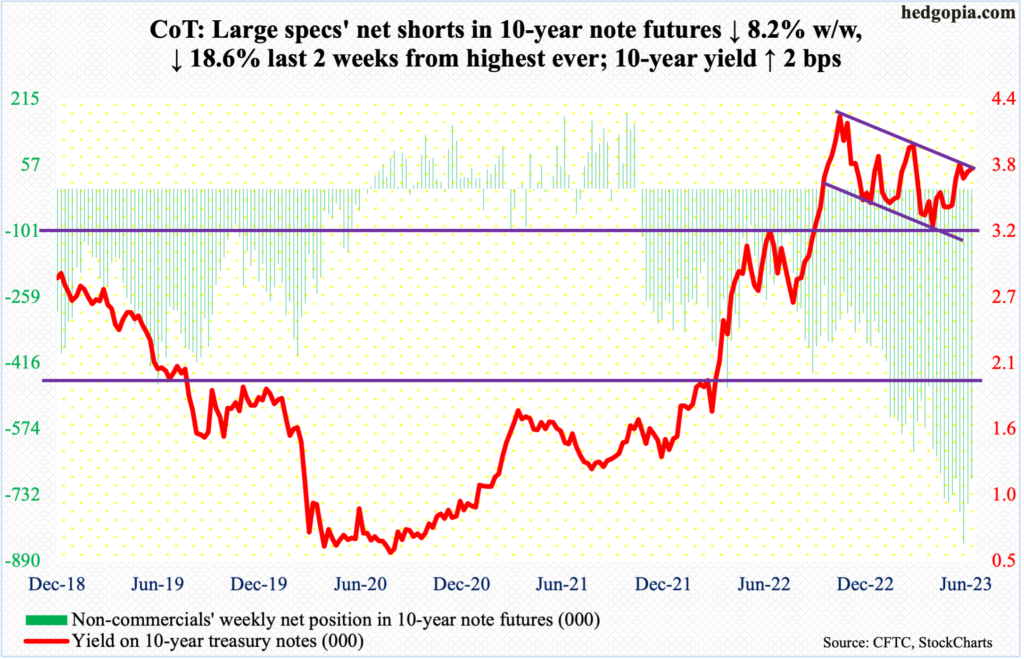
Non-commercials reduced net shorts in 10-year note futures for the second week in a row. In the last couple of weeks, their holdings dropped 18.6 percent to 691,853 contracts, down from record 850, 421 in the week to May 30.
They began cutting in the week leading to this week’s FOMC meeting, in which the Federal Reserve was expected to pause, which it did, leaving the rates unchanged at a range of 500 basis points to 525 basis points. This is the first meeting since March last year the fed funds rate was not raised; rates were between zero and 25 basis points back then.
The FOMC dot plot this week was a lot more hawkish than expected, with 12 of 18 members expecting two more 25-basis-point hikes by December. Ahead of the meeting, futures traders had their money on one more increase in July – which is still the case. These traders continue to doubt the central bank’s resolve in this matter and have been proven wrong so far. Odds favor they will be wrong again (more on this here).
On the long end of the yield curve, a hawkish FOMC message put 10-year treasury notes under pressure, but not a whole lot. The 10-year yield rose two basis points this week to 3.77 percent. Yields rose as high as 3.85 percent intraday Wednesday, the day the FOMC decision was published, but bond bears, such as non-commercials, were unable to hang on to those, ending the session at 3.8 percent. Wednesday’s high kissed a falling trendline from last October when the 10-year yield retreated after touching 4.33 percent. The longer this goes on, the higher the incentive for these traders to continue to reduce their holdings, which can put these yields under more pressure. In all likelihood, a process to this effect has begun.
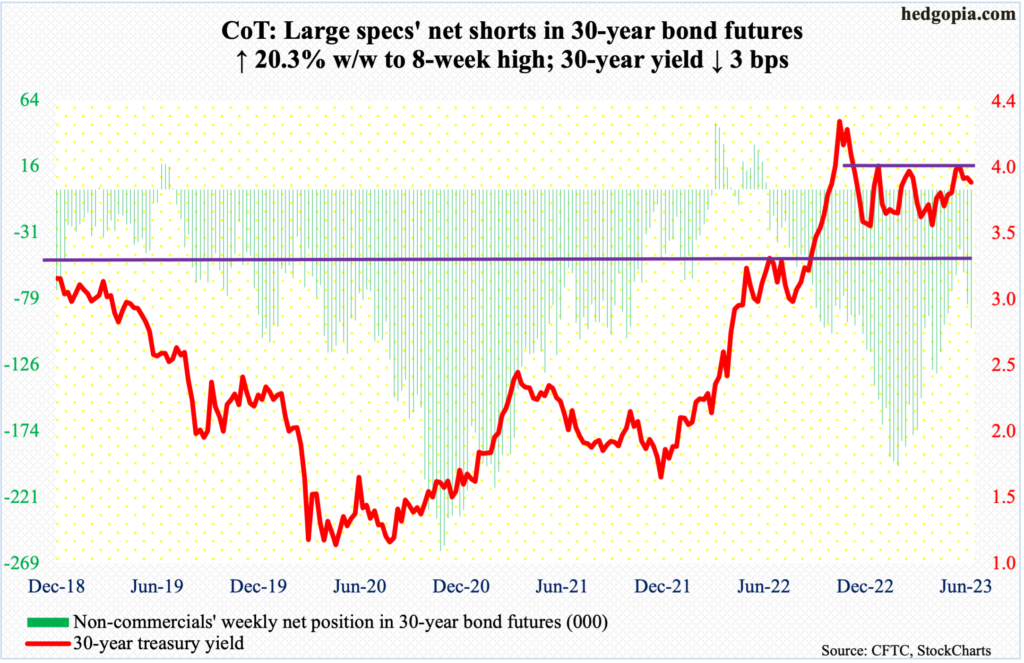
30-year bond: Currently net short 99.7k, up 16.8k.
Major US economic releases for next week are as follows.
Markets are closed Monday for Juneteenth holiday.
The NAHB housing market index (June) is due out on Monday. Homebuilder optimism jumped five points month-over-month in May to 50. Last December’s 31 was the lowest since April 2020.
Housing starts (May) are scheduled for Wednesday. April starts grew 2.2 percent m/m to a seasonally adjusted annual rate of 1.4 million units – a two-month high. January’s 1.34 million was the lowest since June 2020.
Existing home sales (May) come out on Thursday. Sales dropped 3.4 percent m/m in April to 4.28 million units – a three-month low.
WTI crude oil: Currently net long 171.2k, down 13.3k.
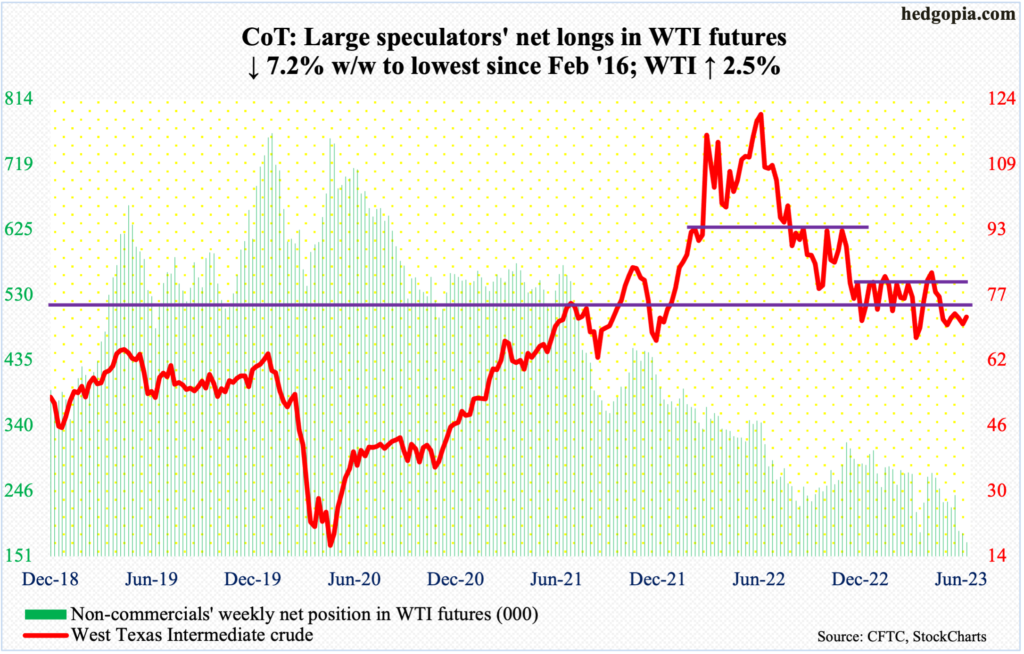
Horizontal support at $63-$64 was not quite tested this week, but West Texas Intermediate crude did drop to $66.80 intraday Monday before oil bulls decided to step up and buy the weakness. As recently as the 5th, the crude tagged $75.06 just above the 50-day moving average.
When it was all said and done, the crude rallied 1.9 percent this week to $71.93 – at the bottom end of a six-month range between $71-$72 and $81-$82. The upper end has not been tested for a couple of months now.
The daily could rally. The nearest resistance lies at $73-$74.
In the meantime, as per the EIA, US crude production in the week to June 9 was flat week-over-week at 12.4 million barrels per day. Crude imports decreased 19,000 b/d to 6.4 mb/d. Stocks of crude, gasoline, and distillates all increased – by 7.9 million barrels, 2.1 million barrels and 2.1 million barrels respectively to 467.1 million barrels, 220.9 million barrels and 113.9 million barrels. Refinery utilization declined 2.1 percentage points to 93.7 percent.
E-mini S&P 500: Currently net short 331.4k, down 13.1k.
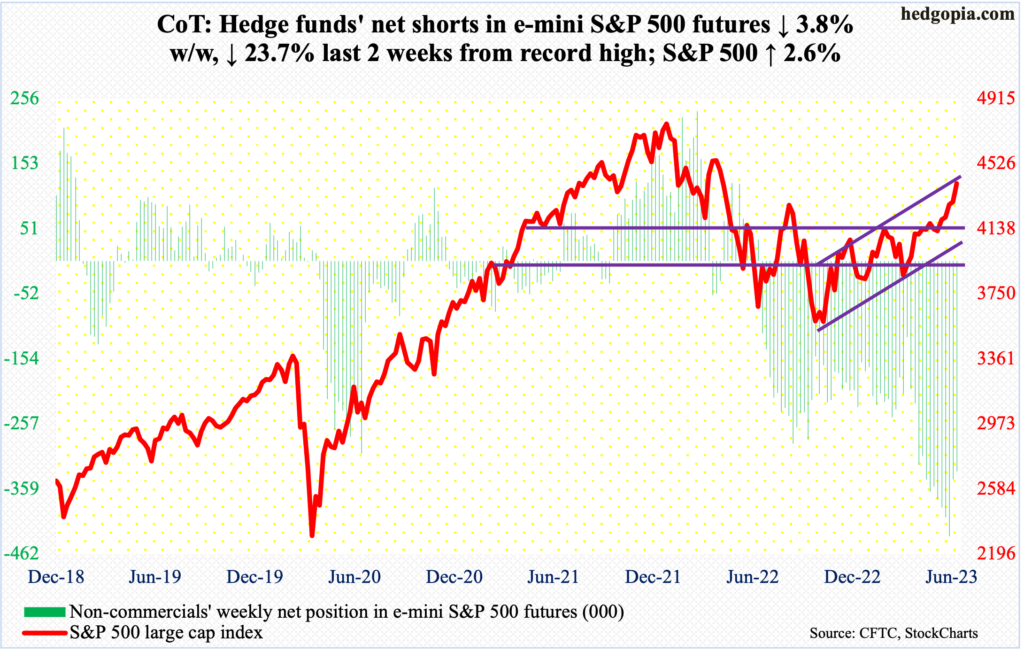
Equity bulls simply ran past last August’s high of 4320s and are staring right into another potential crucial juncture. Friday’s high of 4448 tested – unsuccessfully – the top end of an ascending channel from last October when the S&P 500 bottomed at 3492. This ceiling can prove to be a major hurdle, and the test is taking place at a time when sentiment is increasingly beginning to reek of complacency.
The large cap index (4410) has now rallied for five straight weeks, with the daily RSI solidly into the low-70s in all of this week.
Non-commercials have reduced their record net shorts the last couple of weeks and could very well be in a waiting mode to see if the cash breaks out of the channel. In this scenario, buying has to come from somewhere else for a breakout to occur.
Euro: Currently net long 151.8k, down 6.6k.
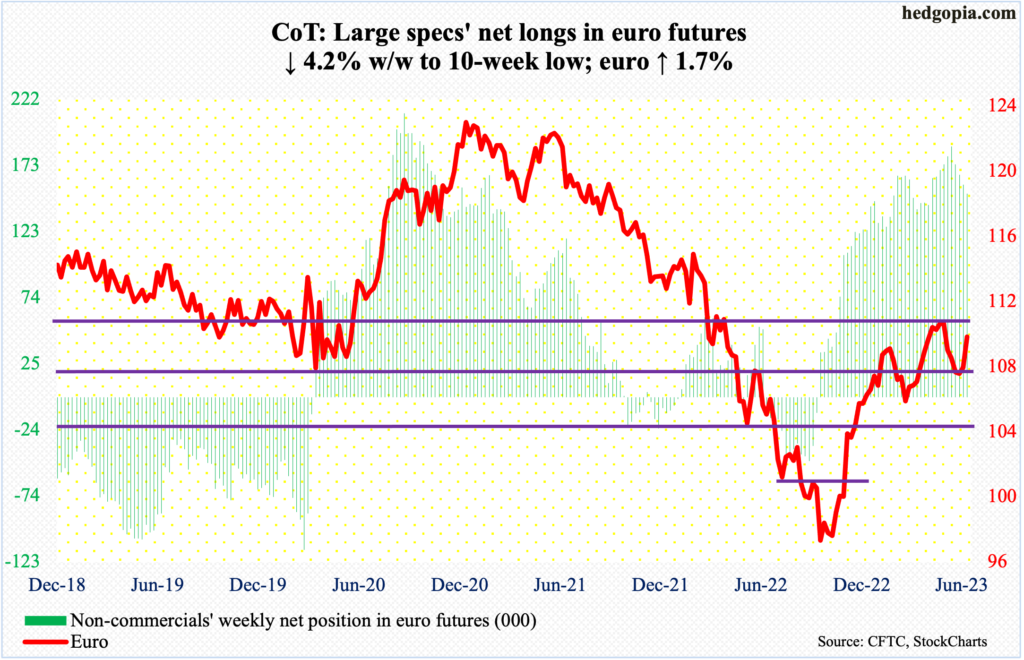
This was a week in which the Federal Reserve stood pat while the European Central Bank continued to hike, bringing its benchmark rate to 3.5 percent. The ECB has now raised rates for eight consecutive times. President Christine Lagarde said another hike in July was “very likely.”
Ahead of the meeting, euro bulls’ mettle was tested around $1.07-$1.08, which they successfully defended. Eight weeks ago, the currency had tagged $1.1095, followed by $1.1092 the week after that, before coming under pressure.
This week, the euro rallied 1.7 percent to $1.0942. For several weeks this April and May, rally attempts were rejected at $1.09-$1.10. This will be quite a test in the sessions ahead.
Gold: Currently net long 160.2k, down 15.4k.
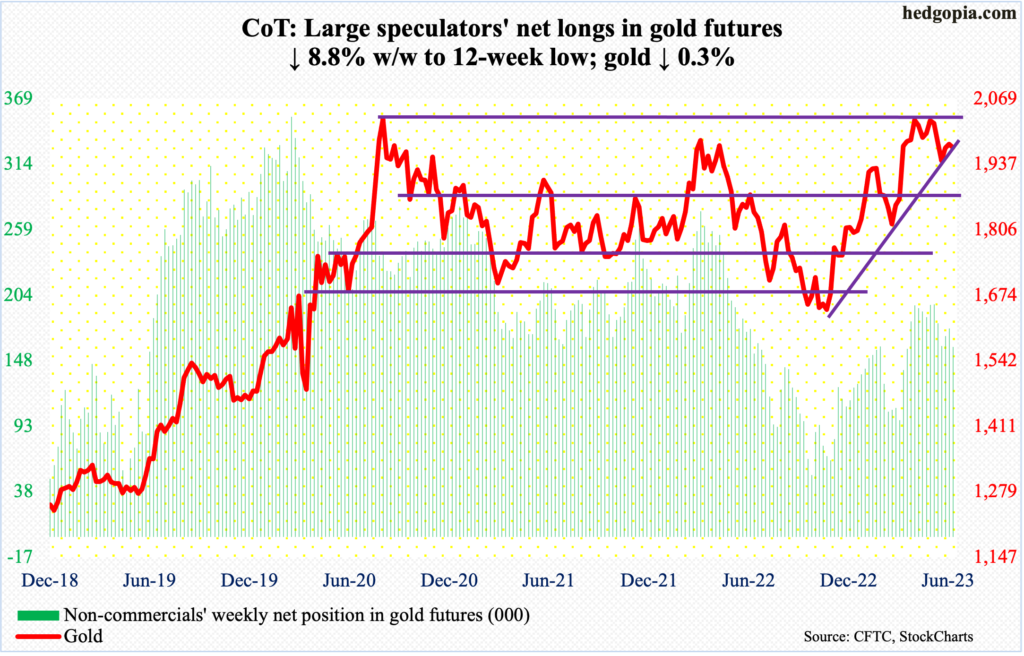
On May 4, in a spinning top session, gold ticked $2,085/ounce before retreating. This was an important price point. In the past, $2,089 was tagged in August 2020 – an all-time high – and $2,079 was hit in March 2022. Gold bugs tried several times, but these levels kept attracting offers.
This Thursday, the metal made an intraday low of $1,936, matching the low from May 26. There is decent support at $1,920s. One potential problem is continued reduction in net longs by non-commercials. In the week to May 9 – this was the week gold ticked $2,085 – these traders were net long 195,814 contracts. As of this Tuesday, these holdings got reduced to 160,209.
Support at $1,920s is a must-hold for the bulls. A breach can hasten non-commercials into cutting back more of their holdings.
Nasdaq 100 index (mini): Currently net long 15.7k, up 6.8k.
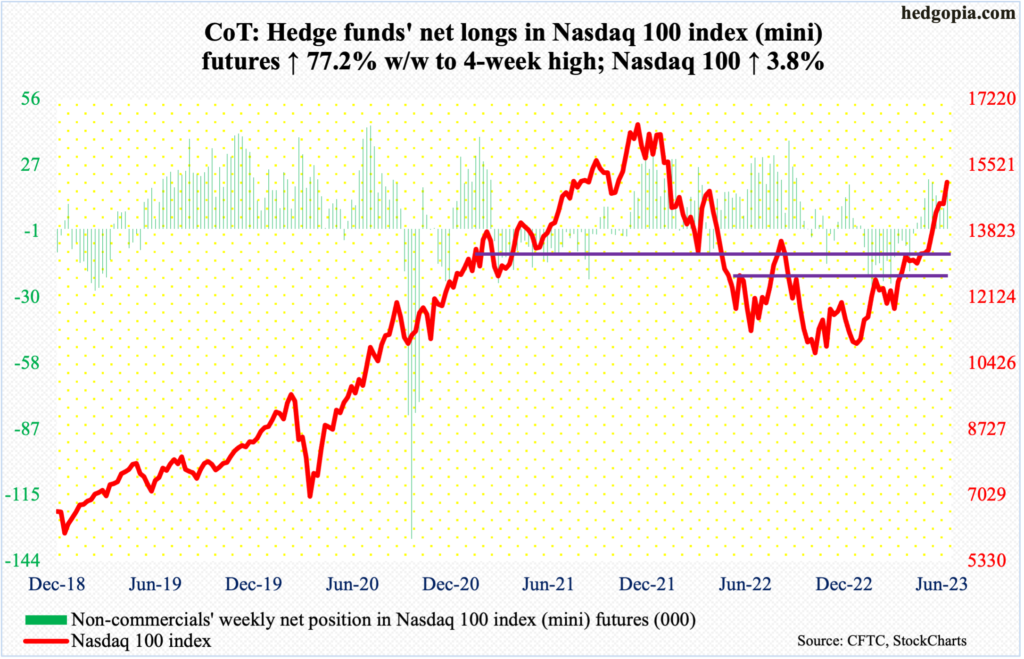
Off last October’s low, the Nasdaq 100 is now up 44.5 percent (not a typo)! Momentum is strong – maybe unsustainably strong – with the daily RSI north of 70 in most of the past month; even the weekly is now solidly into the 70s, with this week ending at 75.76. Several times in the past, this has also been a time to take the foot off the pedal.
Friday’s high of 15285 was sold, with a close of 15084, but it is too soon to declare this is the beginning of a reversal. As overbought as the index is, momentum is yet to break down. Immediately ahead, tech bulls need to save 14700s.
Russell 2000 mini-index: Currently net short 75.9k, up 13.3.
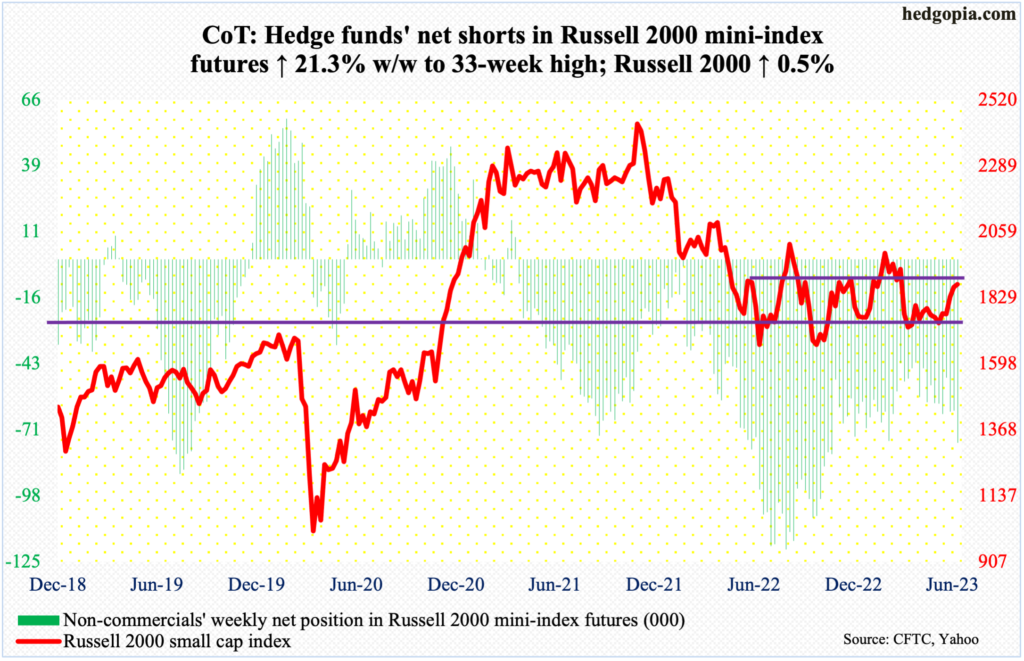
Last week, the S&P 500, the Nasdaq 100, and the Russell 2000 were all rejected at important resistance (more on this here). This week, the first two were able to push through their respective roadblock, but the small cap index failed to do so.
The Russell 2000 has been rangebound between 1900 and 1700 since January last year, even as support at the latter goes back to August 2018. Since losing 1900 in early March, the level had not been tested in earnest – until this week.
In three sessions this week, the Russell 2000 traded just north of 1900 intraday but only to get pushed back below by close. In the end, it managed to rally 0.5 percent to 1875 – much weaker than the S&P 500’s 2.6 percent and the Nasdaq 100’s 3.8 percent.
Small-cap bulls next will be forced to defend 1800 – the mid-point of the range.
US Dollar Index: Currently net long 14k, up 1.8k.
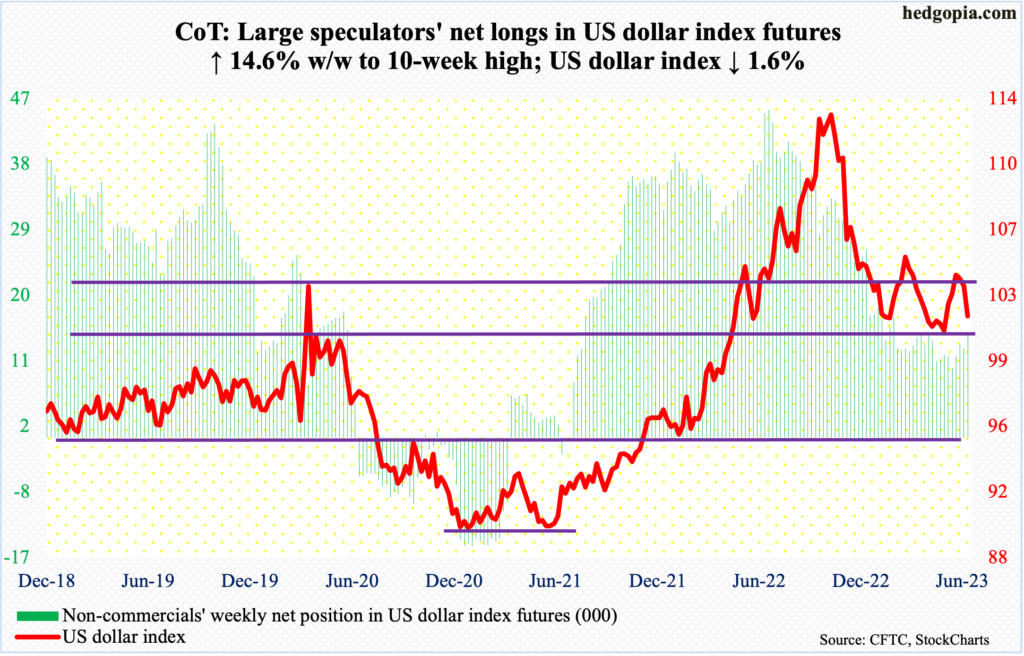
After several weeks of struggle at 103-104, the US dollar index came under decent pressure this week, down 1.6 percent to 101.84.
Horizontal support at 100-101 goes back eight years. The index tagged 101.58 in Friday’s spinning top session. Several times in April and May (this year), it dropped below 101 – between 100 and 101 – before attracting bids. Earlier, the index peaked at 114.75 last September.
The daily is beginning to get oversold, so it is possible 100-101 holds near term, but is vulnerable medium- to long-term.
VIX: Currently net short 67.4k, up 9.6k.
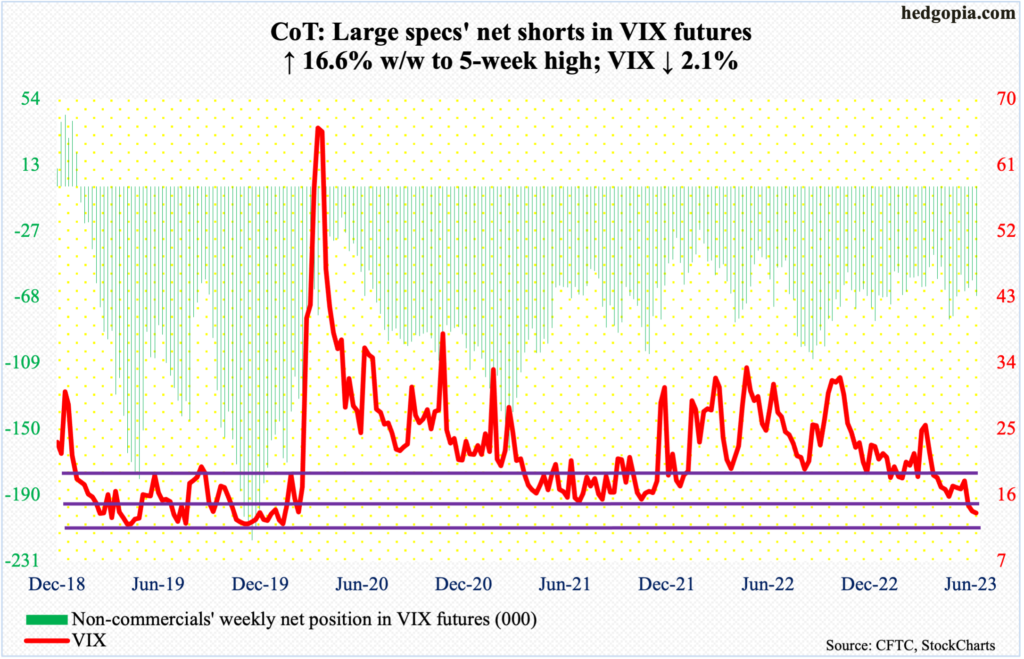
Friday’s intraday low of 13.48 was the lowest since February 2020. Non-commercials raised bets that volatility would continue to remain suppressed, with net shorts at a five-week high.
In the options market on Friday, the CBOE equity-only put-to-call ratio produced a reading of 0.465, which was the second sub-50 reading in the last six sessions and the lowest reading since April last year. The 10-day average was 0.559 on Friday, which again was the lowest since April last year.
In the meantime, the ratio of VIX to VXV ended this week at 0.808, representing the third straight week of low-0.80s reading.
These are all increasing signs of complacency, unwinding of which is destined to be painful.
Thanks for reading!
