
Following futures positions of non-commercials are as of June 20, 2023.
10-year note: Currently net short 750k, up 58.1k.
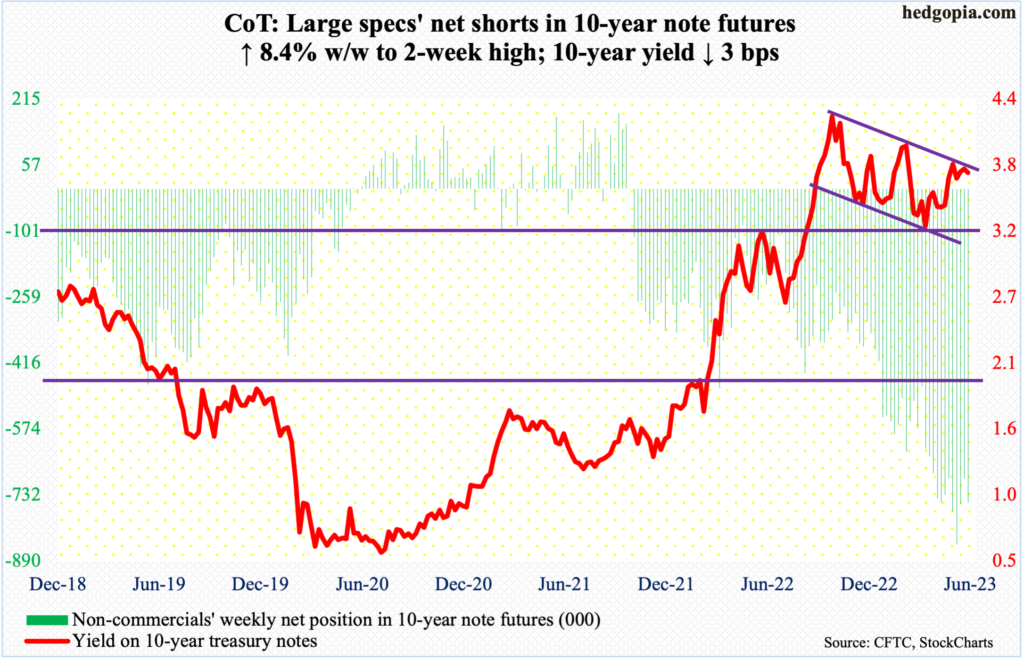
The Bank of England’s unexpected 50-basis-point hike on Thursday to five percent highlights central bankers’ increasing frustration with inflation that is increasingly proving sticky; UK inflation was 8.7 percent in the year to May, with the core at 7.1 percent. Norges Bank, Norway’s central bank, too, raised its key policy rate this week by a higher-than-expected 50 basis points to 3.75 percent; Norway’s core inflation rose to 6.7 percent in the 12 months to May.
Before this, on the 6th and 7th this month, the Reserve Bank of Australia and the Bank of Canada both surprised with a 25-basis-point increase in their benchmark rates.
In last week’s FOMC meeting, the Federal Reserve decided not to surprise the markets, holding off raising rates. It did so probably because in the May meeting it had already dropped hints that after eight consecutive increases totaling 500 basis points, it would stand pat in the June meeting.
That said, the Fed was amply clear that it is not done. The FOMC dot plot, in fact, raised its rate forecasts for the year, with 12 of 18 members expecting two more 25-basis-point hikes by December. The fed funds rate currently is in a range of 500 basis points to 525 basis points, up from zero to 25 basis points in March last year.
This late in the tightening cycle, even if the Fed tries to pull a surprise, markets in all probability are not going to fall for it. Hindsight is always 20/20 but there was a time when it could – and should – have pulled this one off, particularly when its hawkish message was falling on equities’ deaf ears. Major equity indices rallied 30 percent-40 percent off their October 2022 lows; looser financial conditions are still posing a challenge for the central bank.
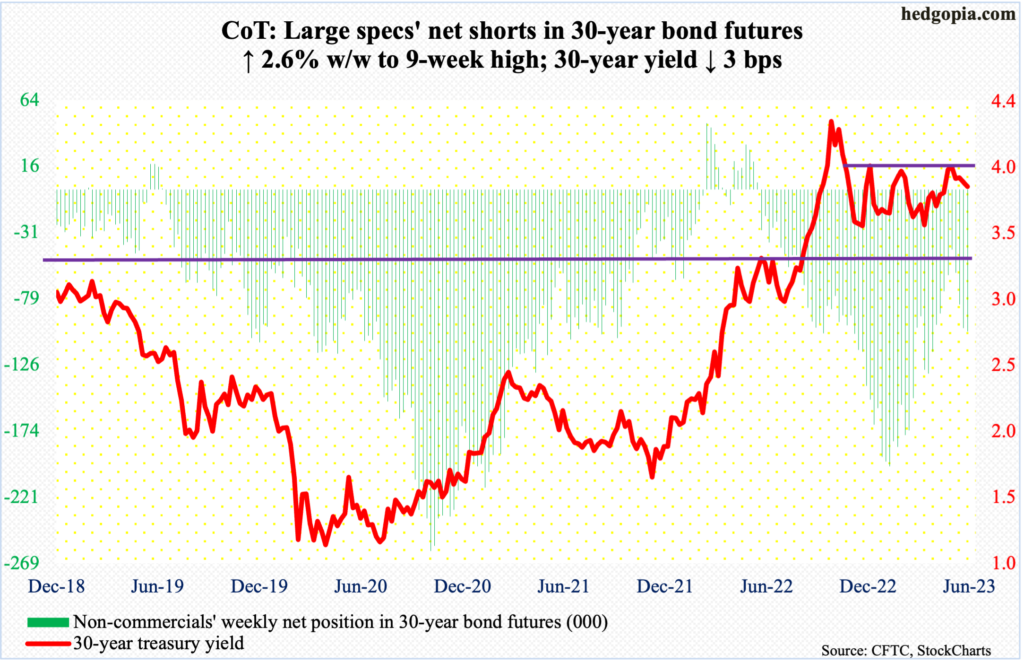
30-year bond: Currently net short 102.3k, up 2.6k.
Major US economic releases for next week are as follows.
Durable goods orders (May), the S&P Case-Shiller Home Price Index (April) and new home sales (May) will be out Tuesday.
In April, orders for non-defense capital goods ex-aircraft – proxy for business capex plans – rose 1.4 percent month-over-month to a seasonally adjusted annual rate of $74 billion – a new high.
Nationally, March home prices inched up 0.7 percent year-over-year. This was the slowest y/y price appreciation since May 2012. Since rising at a record 20.8 percent in March last year, price appreciation has softened every month.
Sales of new homes increased 4.1 percent m/m in April to 683,000 units (SAAR) – a 13-month high.
Thursday brings GDP (1Q23, 3rd estimate) and corporate profits (1Q23, revised).
The second estimate showed real GDP grew 1.3 percent in the first quarter. This comes after growth of 2.6 percent in 4Q22 and 3.2 percent in the quarter before that. This was preceded by a back-to-back drop in the first two quarters last year – by 1.6 percent in 1Q and 0.6 percent in 2Q.
Preliminarily, corporate profits adjusted for inventory valuation and capital consumption dropped 5.1 percent quarter-over-quarter in 1Q23 to $2.79 trillion (SAAR). Profits reached an all-time high of $3 trillion in 2Q last year.
Personal income/spending (May) and the University of Michigan’s consumer sentiment index (June, final) are scheduled for Friday.
In the 12 months to April, headline and core PCE (personal consumption expenditures) respectively rose 4.4 percent and 4.7 percent. The two respectively peaked last year at seven percent in June and 5.4 percent in February. The Fed targets two percent on core PCE.
June’s preliminary reading showed consumer sentiment increased 4.7 points m/m to 63.9 – a four-month high. Last June, sentiment hit a record low 50.
WTI crude oil: Currently net long 193.2k, up 22k.
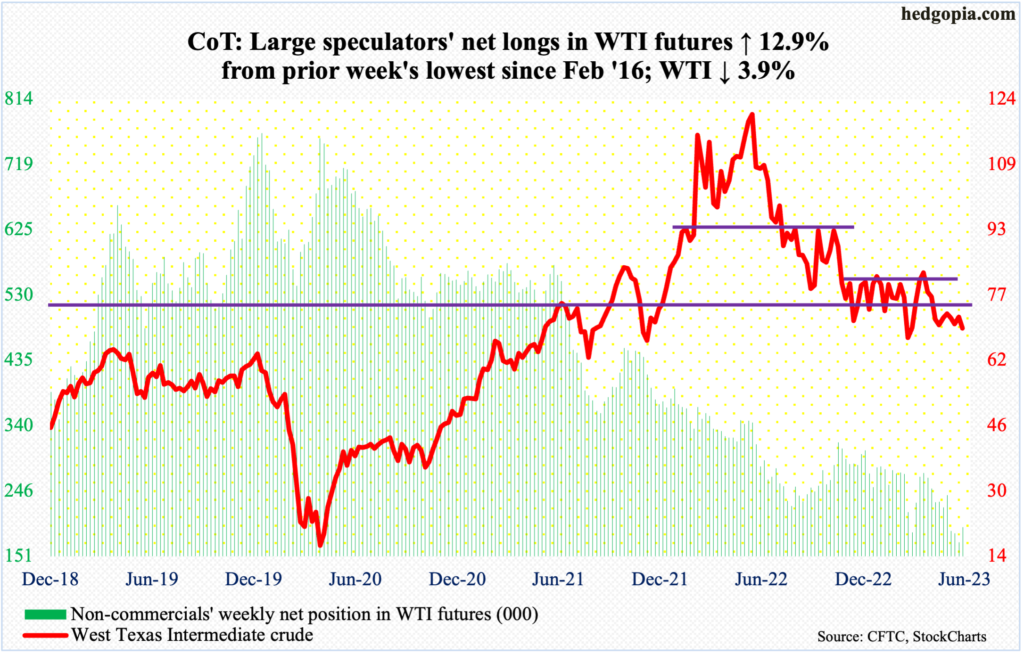
West Texas Intermediate crude has gone back and forth between $71-$72 and $81-$82 for six and a half months. The upper end has not been tested for a couple of months, even as $73-$74 has resisted rally attempts for a month and a half, including this week, with Wednesday tagging $72.72. By Friday, the crude ticked $67.35 intraday before attracting bids at the daily lower Bollinger band, closing the week out at $69.16/barrel.
A loss of $67 raises the odds of a test of horizontal support at $63-$64.
In the meantime, as per the EIA, US crude production in the week to June 16 dropped 200,000 barrels per day week-over-week to 12.2 million b/d. As did crude imports, which decreased 220,000 b/d to 6.2 mb/d. Crude stocks declined as well – by 3.8 million barrels to 463.3 million barrels. Stocks of gasoline and distillates, however, increased 479,000 barrels and 434,000 barrels respectively to 221.4 million barrels and 114.3 million barrels. Refinery utilization declined six-tenths of a percentage point to 93.1 percent.
E-mini S&P 500: Currently net short 239.3k, down 92.1k.
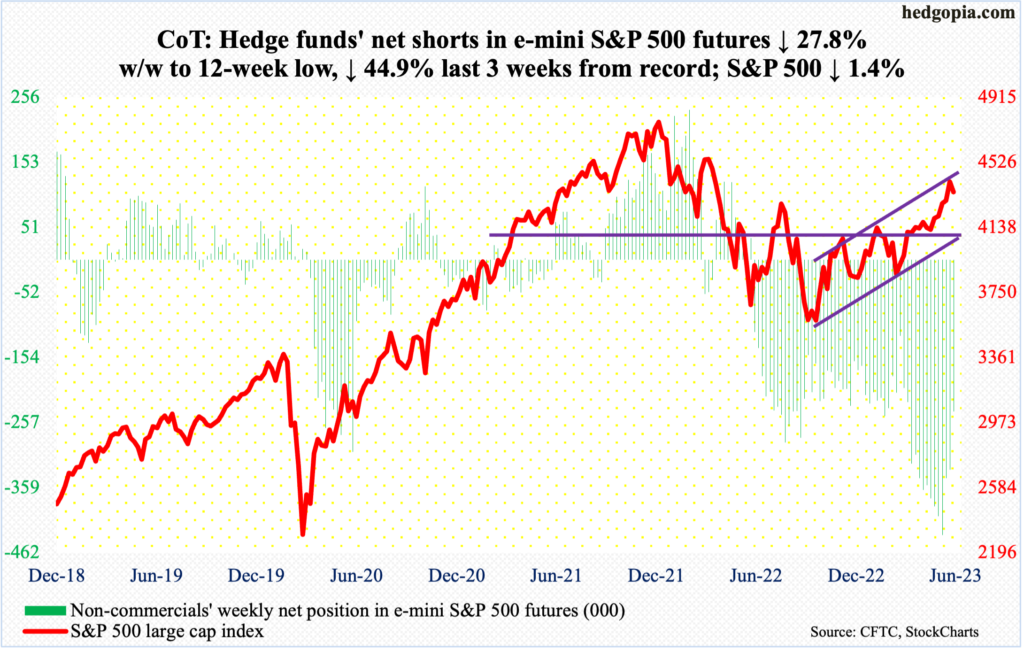
The ascending channel from last October’s low is following a typical technical script. It is now favoring the bears. From that low through the June 16th 14-month high of 4448, the S&P 500 jumped 27.4 percent. That high just about kissed the upper bound of the channel (more on this here). This week, the large cap index gave back 1.4 percent to 4348.
Last week, equity bulls rallied past last August’s high of 4320s, which they now need to defend. A failure to do so – likely – opens the door toward 4200, which also coincides with the 50-day moving average (4202).
Euro: Currently net long 144.6k, down 7.2k.
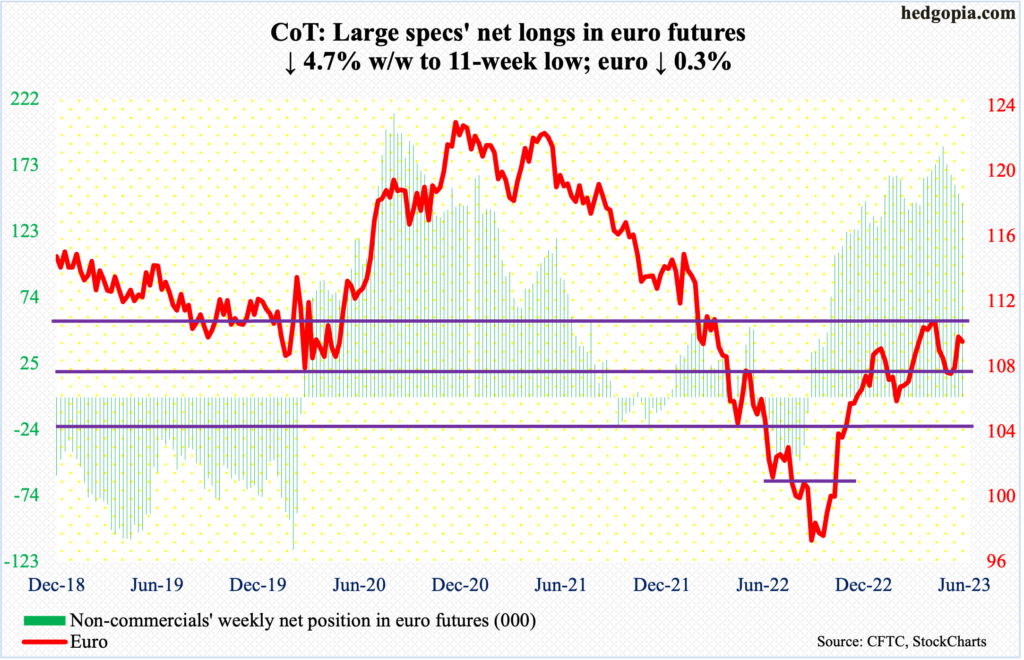
The euro bottomed last September at $0.9559. For several weeks in April and May this year, rally attempts were rejected at $1.09-$1.10, which once again drew offers this week.
The currency rallied after bottoming at $1.0635 on May 31. On both Wednesday and Thursday this week, the euro rose past $1.10 intraday, but only to close the week out at $1.0914.
The daily probably wants to go lower. There is horizontal support at $1.07-$1.08.
Gold: Currently net long 163k, up 2.8k.
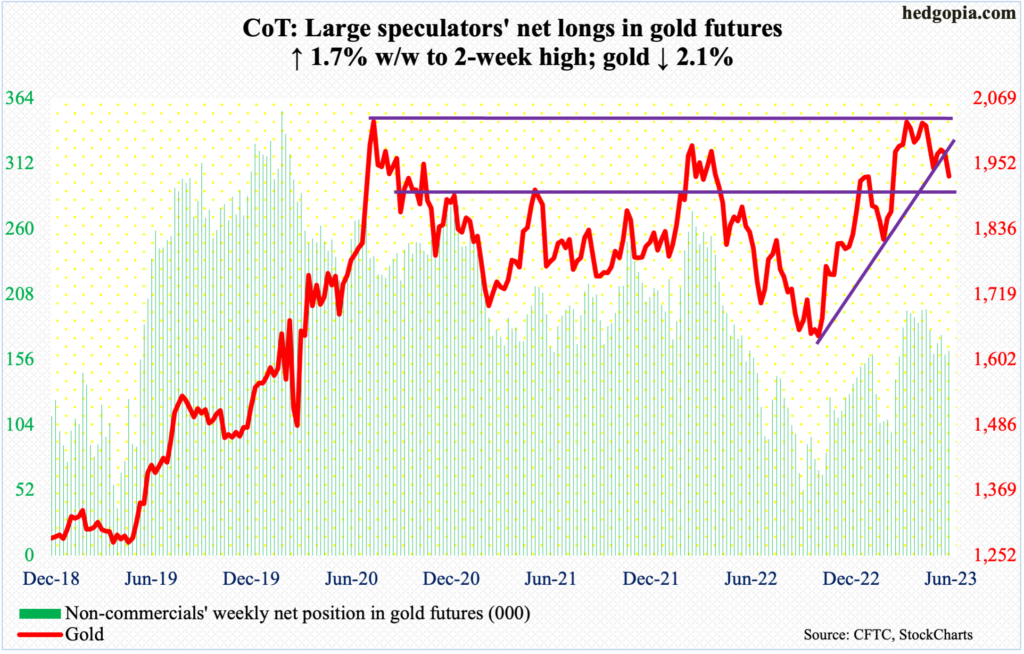
Gold bugs are now having to defend another crucial support. Since meeting with tremendous resistance at multi-year highs, they have been on the defensive.
After bottoming at $1,620s last September and October, gold rallied incessantly. On May 4, in a spinning top session, it ticked $2,085/ounce before retreating. This was an important price point. In the past, $2,089 was tagged in August 2020 – an all-time high – and $2,079 was hit in March 2022.
Non-commercials began to reduce their net longs right around the time the metal touched $2,085.
This week, a rising trendline from last year’s lows was breached. By Friday, the yellow metal tagged $1,920, finishing the session/week at $1,930. This is a must-save for the bulls. Medium- to long-term, a breach probably occurs. Near-term, bulls need to recapture $1,950s to garner some momentum.
Nasdaq 100 index (mini): Currently net long 16k, up 313.
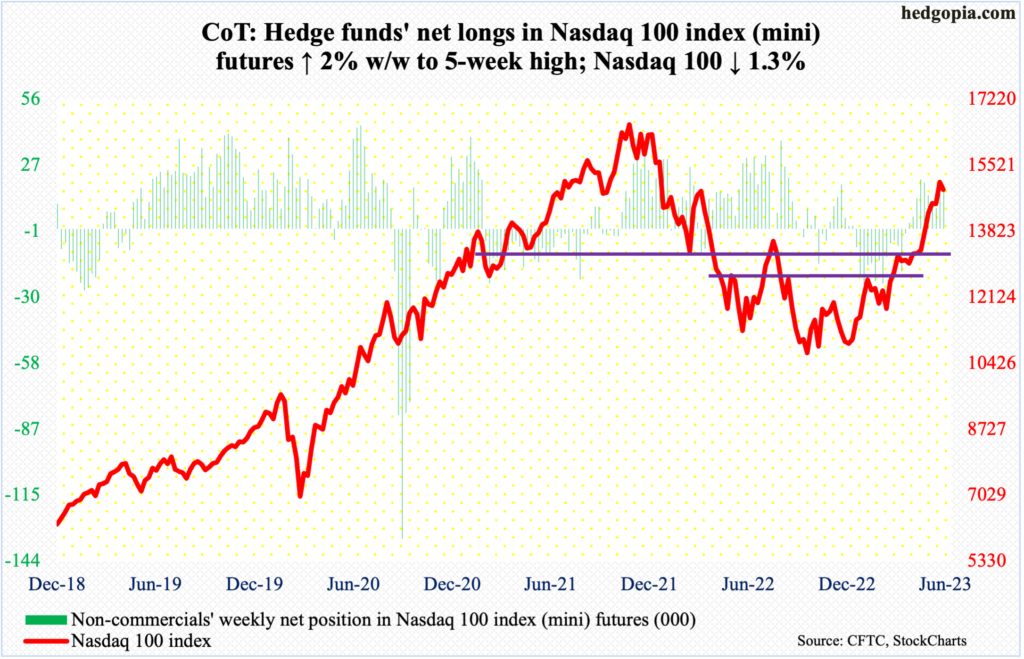
After rallying 44.5 percent off last October’s low and remaining overbought for weeks, with both the daily and weekly RSI into the 70s, the Nasdaq 100 shed 1.3 percent this week, outperforming both the S&P 500 and the Russell 2000.
On the 16th, the tech-heavy index printed 15285 before closing at 15084. This was a small reversal, and that probably led the foundation for this week’s weakness.
There is horizontal support at 14700s. A likely breach in the sessions ahead opens the door to unwinding the overbought condition the index (14891) is in – the weekly in particular.
Russell 2000 mini-index: Currently net short 72.7k, down 3.2k.
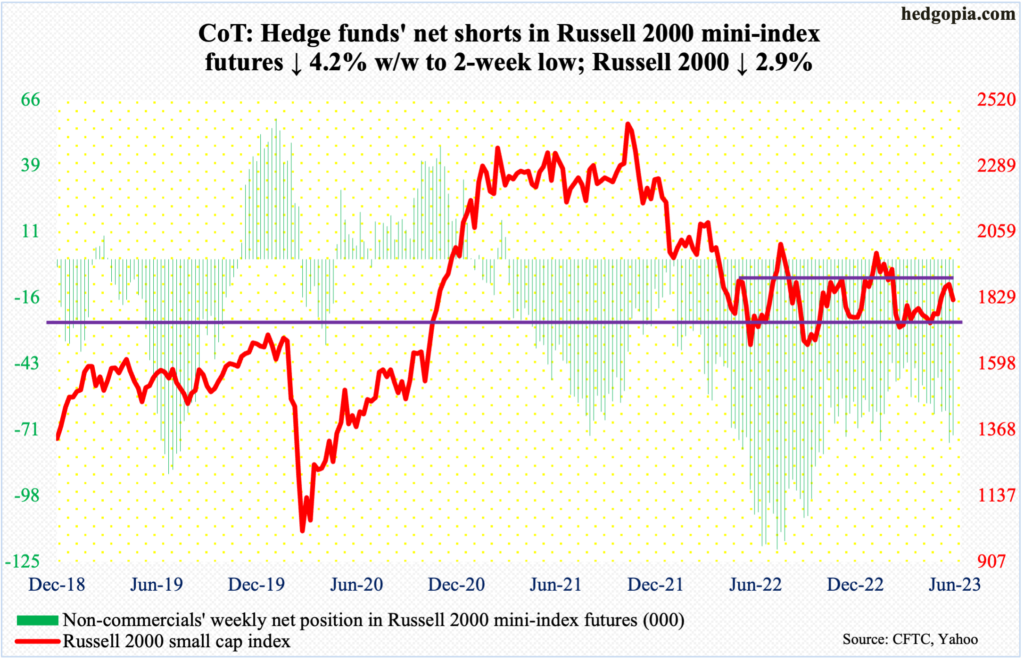
Last week, small-cap bulls had an opportunity to finally break out of a one-and-a-half-year range between 1700 and 1900; in three of the five sessions, in fact, the Russell 2000 did rally past 1900 intraday but only to fall back under by close. Bulls’ inability to recapture 1900 emboldened the bears this week, as the latter pushed the small cap index 2.9 percent lower. The mid-point of the range – 1800 – was just about tested, with the weekly close of 1822 not too far away from the weekly low of 1819.
The Russell 2000 has been rangebound between 1900 and 1700 since January last year, even as support at the latter goes back to August 2018. Odds favor a test of the lower bound sooner than later.
US Dollar Index: Currently net long 14.9k, up 863.
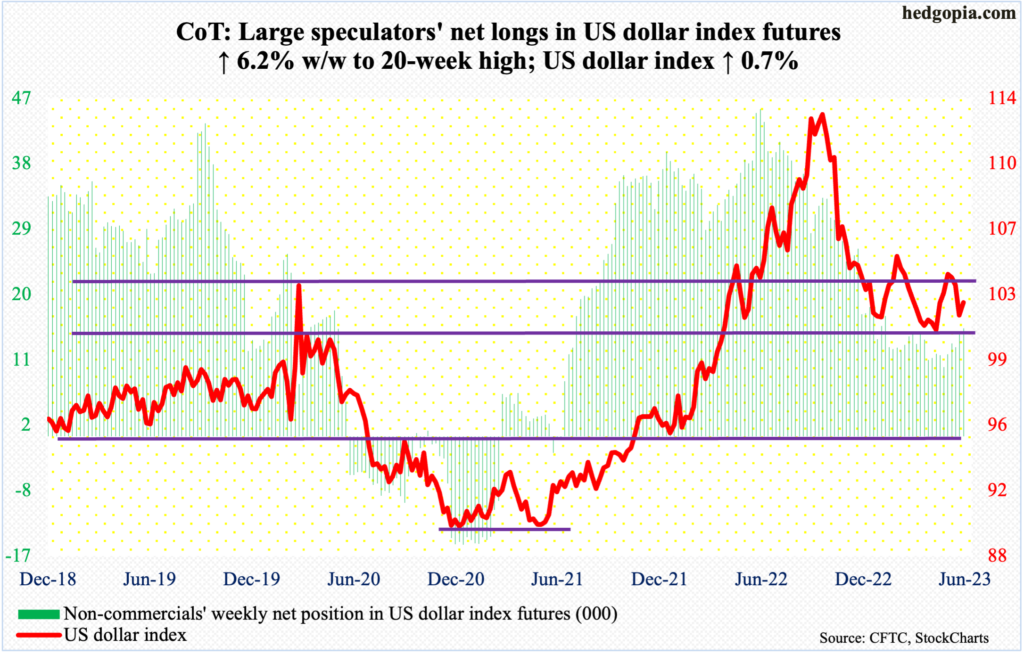
Horizontal support at 100-101 goes back eight years. Last week, selling stopped at 101.58. This week, the US dollar index ticked 101.48 on Thursday before dollar bulls stepped in. They failed to hang on to Friday’s session high 102.79 but managed to rally the index 0.7 percent this week to 102.54 – slightly past the 50-day at 102.40.
The daily is itching to rally. There is resistance at 103-104.
VIX: Currently net short 61.1k, down 6.4k.
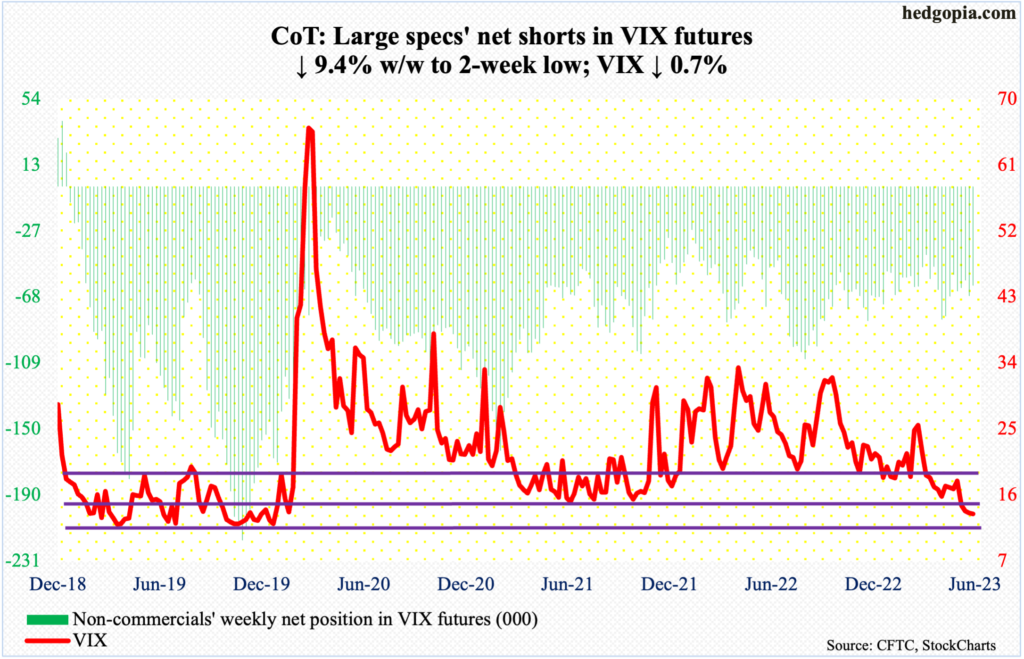
For the first time since January 2020, VIX broke 13, tagging 12.73 on Thursday and 12.88 on Friday. This also took place in a week in which the volatility index dropped 0.1 point to 13.44, going hand in hand with the S&P 500 directionally, which does not happen often. In general, the two tend to move in opposite directions.
In the meantime, heightened investor complacency is evident in several other options-related metrics. The 10-day moving average of the CBOE equity-only put-to-call ratio closed this week at 0.561, with Wednesday’s 0.550 the lowest since April last year.
Concurrently, the ratio of VIX to VXV closed this week at 0.797 – the first sub-0.80 reading since December 2021.
Thanks for reading!
