
Following futures positions of non-commercials are as of August 22, 2023.
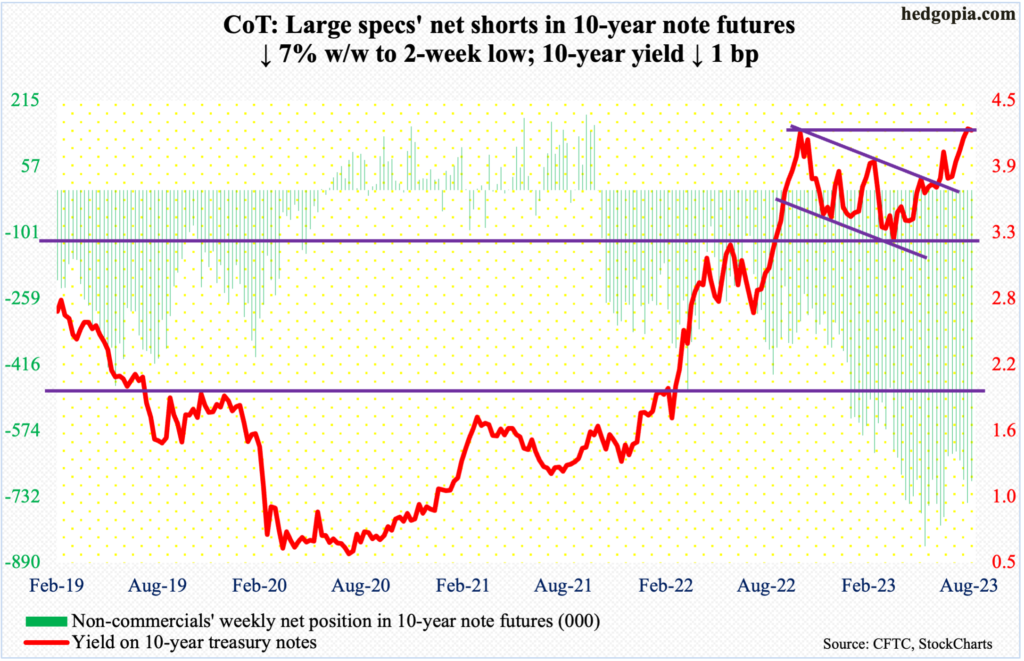
10-year note: Currently net short 694.9k, down 52k.
It was a yawner to say the least – Federal Reserve Chair Jerome Powell’s Friday speech at the annual Jackson Hole conference, that is. He hardly said anything he had not said before, saying the central bank stands ready to raise interest rates further if needed.
The fed funds rate was raised in July to a range of 525 basis points to 550 basis points, up from zero to 25 basis points in March last year. The FOMC meets on September 19-20.
In the futures market, traders treated Powell’s speech as slightly hawkish as they have now given a slight edge to a 25-basis-point hike in November to a range of 550 basis points to 575 basis points, followed by a cut next January, ending 2024 between 425 basis points and 450 basis points.
Powell, and other FOMC members, on the other hand, have been resolutely saying they expect to leave interest rates elevated for some time. Right now, the Fed remains committed to its inflation mandate; post-Covid, it only had jobs – its other mandate – in focus.
“The message is the same: It is the Fed’s job to bring inflation down to our two percent goal, and we will do so,” Powell said. This rightly poured cold water on many economists’ call for raising the threshold higher. They want easy money for as long as possible. Thus far, Powell has shown the tenacity to say no – thankfully.
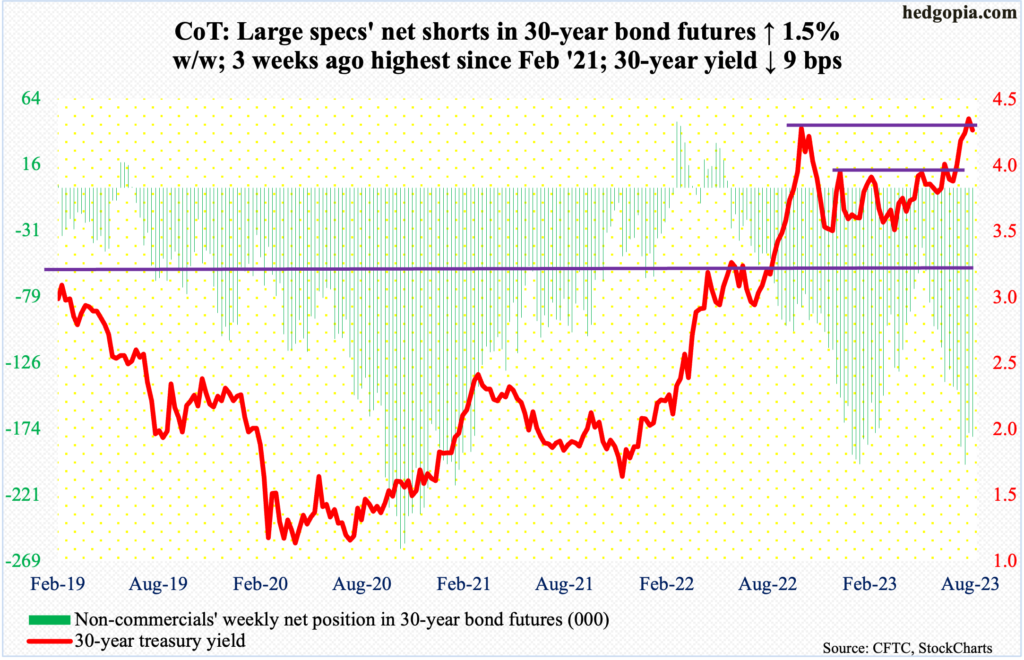
30-year bond: Currently net short 179.5k, up 2.7k.
Major US economic releases for next week are as follows.
The S&P Case-Shiller home price index (June) and JOLTs job openings (July) are due out Tuesday.
In May, US home prices nationally dropped 0.5 percent year-over-year. This was the second straight monthly decline after prices rose for 131 months in a row.
Non-farm job openings fell 34,000 month-over-month to 9.6 million. Openings peaked in March last year at 12 million.
Wednesday brings GDP (2Q23, second estimate) and corporate profits (2Q23).
The first estimate showed real GDP expanded 2.4 percent in 2Q.
Corporate profits adjusted for inventory valuation and capital consumption decreased 1.8 percent y/y in 1Q23 to a seasonally adjusted annual rate of $2.82 trillion. Profits reached a record high $3 trillion in 2Q22.
Personal income/spending (July) is scheduled for Thursday. In the 12 months to June, headline and core PCE (personal consumption expenditures) increased three percent and 4.1 percent respectively. They peaked last year at seven percent (June) and 5.4 percent (February), in that order.
Payroll (August) and the ISM manufacturing index (August) are on tap for Friday.
In both June and July, the economy created under 200,000 non-farm jobs, for an average monthly total of 258,000 in the first seven months this year, versus the monthly average last year of 399,000 and 606,000 before that.
July manufacturing activity rose four-tenths of a percentage point m/m to 46.4 percent. This was the ninth month in succession the ISM index has remained under 50 percent.
WTI crude oil: Currently net long 255k, down 11.3k.
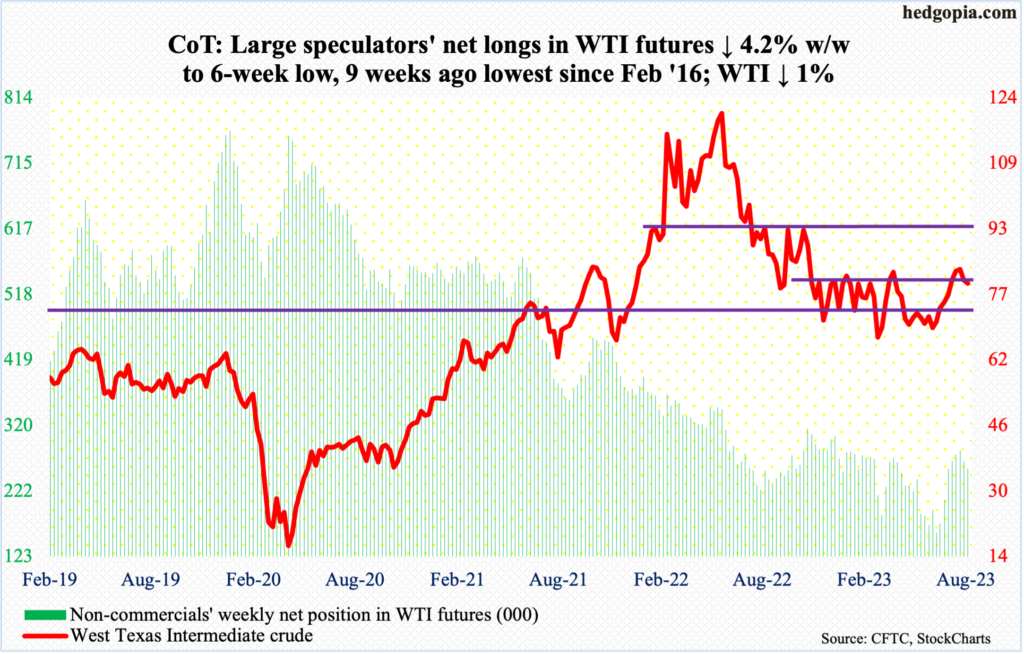
West Texas Intermediate crude ($79.83/barrel) shed one percent this week to push further into an eight-month range between $71-$72 and $81-$82. That said, oil bulls deserve kudos for stepping up in time to stop the drop from getting worse. Intraday Thursday, the crude was down to $77.59, but reversed higher to close at $79.05, followed by more gains on Friday.
WTI remains above both the 50- and 200-day moving averages – respectively $76.68 and $76.33 – which incidentally completed a golden cross this week.
As things stand, there is room for the daily to move higher.
In the meantime, as per the EIA, US crude production in the week to August 18 increased 100,000 barrels per day week-over-week to 12.8 million b/d, which is the highest since March 27, 2020. Crude imports decreased 225,000 b/d to 6.9 mb/d. As did crude stocks, which dropped 6.1 million barrels to 433.5 million barrels. Stocks of gasoline and distillates, however, grew – respectively up 1.5 million barrels and 945,000 barrels to 217.6 million barrels and 116.7 million barrels. Refinery utilization inched lower two-tenths of a percentage point to 94.5 percent.
E-mini S&P 500: Currently net short 133.5k, up 15.1k.
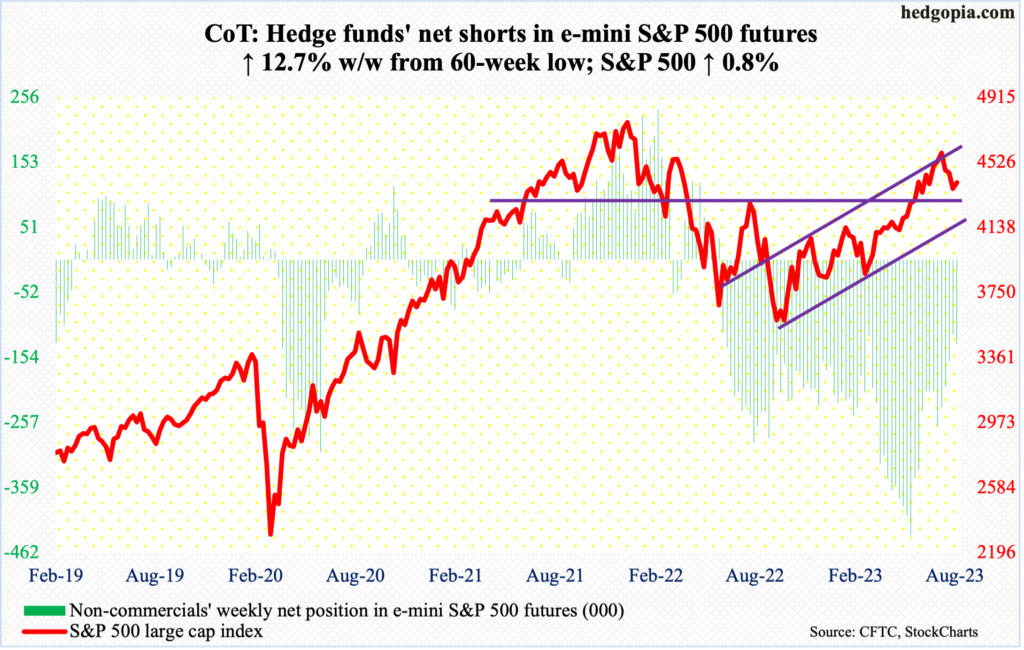
Both bulls and bears were active this week. The relief rally that was expected to unfold materialized, but also met with selling pressure where it was expected to (more on this here).
Last Friday’s intraday low of 4335 was as good as a successful breakout retest at 4320s. This week began with a green Monday. By Thursday, the S&P 500 tagged 4458 but only to reverse hard to end the session with a massive bearish engulfing candle. On July 27 when the large cap index touched 4607 before reversing, a similar candle formed.
There is horizontal resistance at 4450s, which also coincides with the 50-day at 4460. There is room to rally on the daily. But for real momentum to begin, 4450s need to convincingly give way.
Bulls can no longer rely on potential tailwind from short-covering. Non-commercials added a bit to net shorts in e-mini S&P 500 futures, but the prior week was at a 60-week low. Short interest on SPY (SPDR S&P 500 ETF) is the same way (chart here).
Euro: Currently net long 158.8k, down 1.1k.
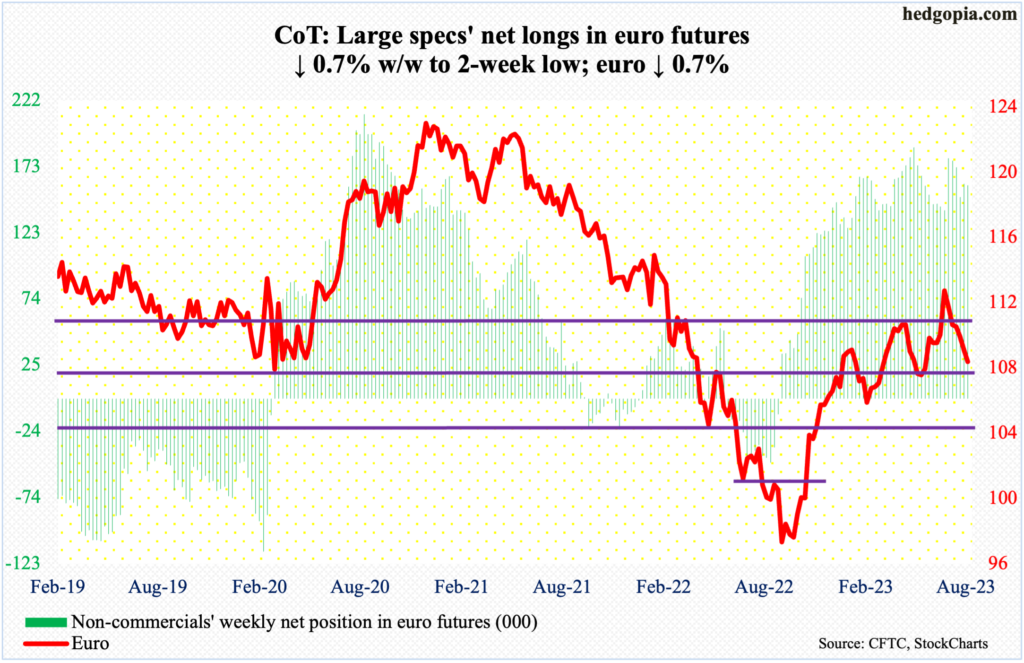
The monthly RSI is turning down from the median. Euro bulls are losing momentum. They rallied the currency from $0.9559 last September to $1.1270 on July 18 (this year). From that high, it has now dropped for six consecutive weeks.
This week, the euro ($1.0796) fell further away from $1.09-$1.10, which it had earlier broken out of six weeks ago.
The daily remains way oversold. Friday’s spinning top right on the 200-day ($1.0784) should give bulls some hope. Inability to defend the average makes the euro susceptible to at least a drop to the May 31st low of $1.0635.
Gold: Currently net long 101.9k, down 19.2k.
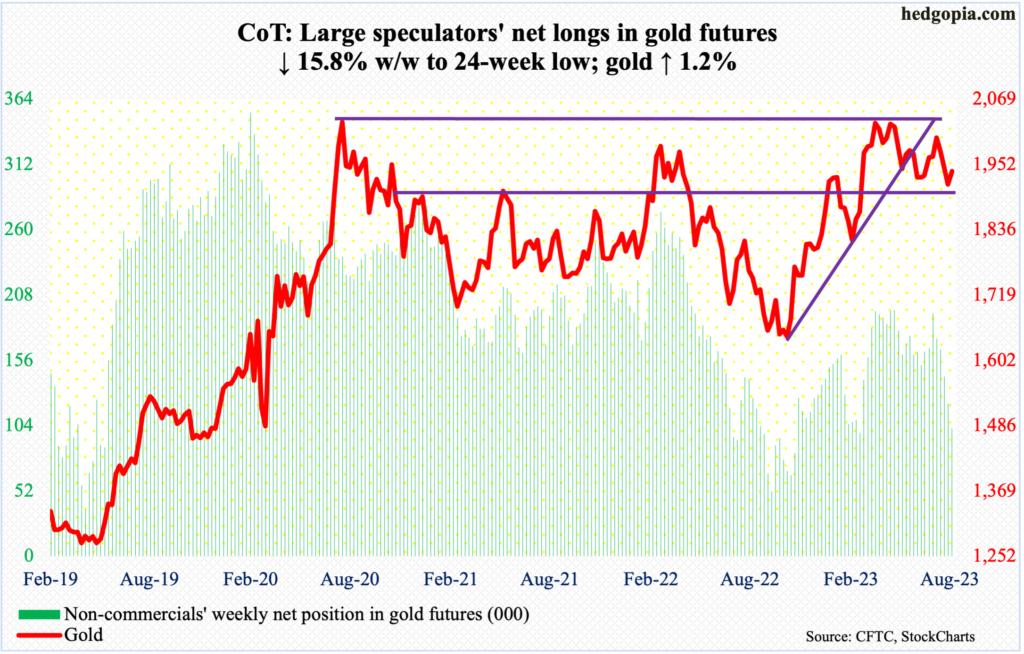
For the third month in a row, gold bears went after $1,920s and were denied. The metal opened this week with Monday’s intraday low of $1,914 and gold bugs were ready with bids. This was just above the 200-day ($1,916 currently; was lower on Monday as the average is rising).
Non-commercials are acting as if this has no sustaining power, with net longs in gold futures at a 24-week low. Indeed, in the last three sessions this week, gold drew offers at the 50-day ($1,950), ending the week at $1,940.
Bulls had a tremendous opportunity in May to break out, but gold headed lower after ticking $2,085 on the 4th. In the past, $2,089 was tagged in August 2020 – an all-time high – and $2,079 in March 2022.
Nasdaq 100 index (mini): Currently net long 13.8k, up 8.7k.
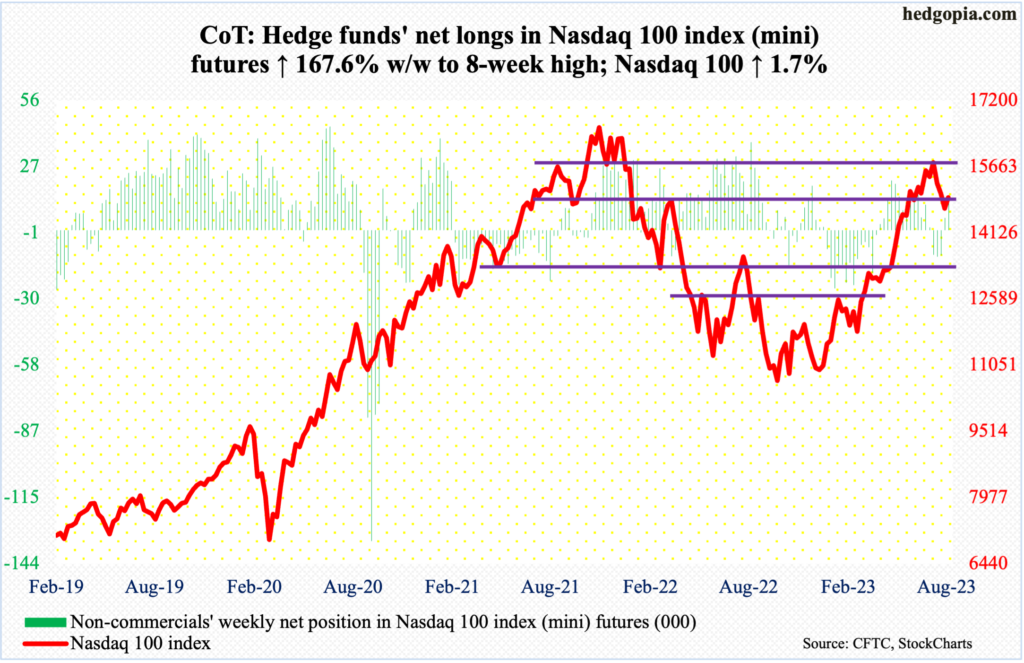
The Nasdaq 100 (14942) rallied 1.7 percent this week. Nevertheless, it failed to keep all of its gains, having been up as much as four percent at Thursday’s high. Up 0.9 percent at one time, that session ended down 2.2 percent, forming a huge bearish engulfing candle, as it met with massive selling at 15200s lateral resistance, not to mention the 50-day at 15214.
Thursday’s earlier optimism followed by outright pessimism was a reflection on how Nvidia (NVDA) traded post-earnings, as the $1.1-trillion market cap company tagged a new high of $502.66 but only to end the session essentially unchanged at $471.63. With four sessions to go, August so far has produced a massive monthly spinning top. If it sticks – it likely will – this would have come after three massively up months; last October, NVDA bottomed at $108.07. No matter how good the fundamentals, this smells of out-and-out euphoria. If history is guide, this hardly ends well.
Russell 2000 mini-index: Currently net short 61.8k, down 9.5k.
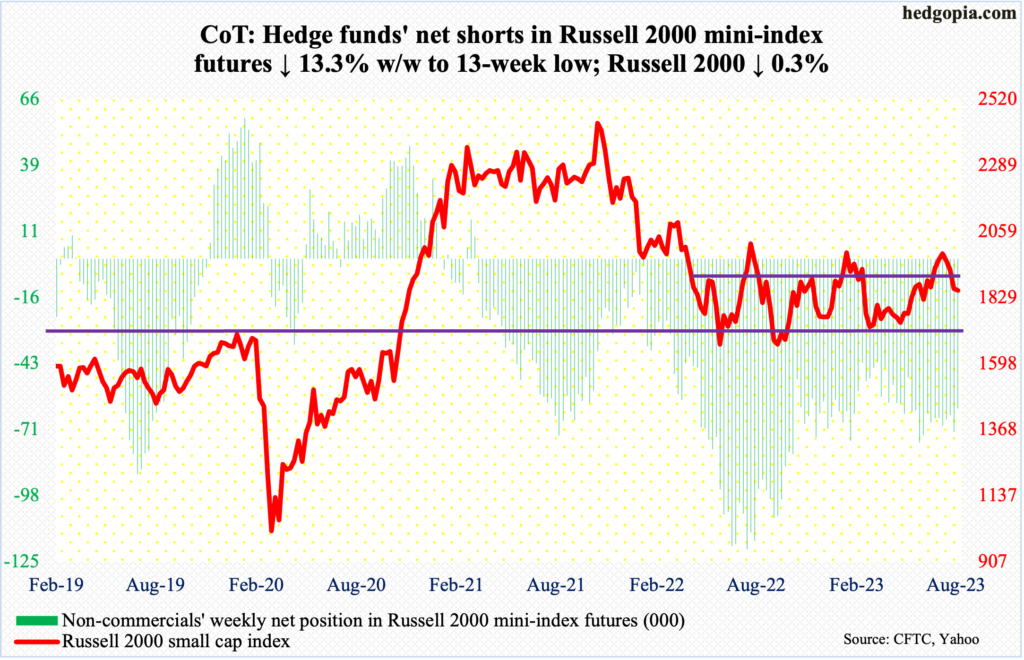
Unlike the S&P 500 and the Nasdaq 100, the Russell 2000 was unable to put up an up week, down 0.3 percent to 1854. Wednesday’s high (1873) came about well before resistance at 1900, as did Friday’s low (1832), which was made well before support at 1800.
The Russell 2000 had been rangebound between 1700 and 1900 since January last year. A breakout occurred on July 11 (this year). After that, the small cap index went on to rally to 2004, which was hit on July 31, but came up short of eclipsing the February (2023) high of 2007 – meaning no higher high. Since then, it has been under pressure, but 1800 has held firm.
It is in no-man’s land currently.
US Dollar Index: Currently net long 4.6k, down 402.
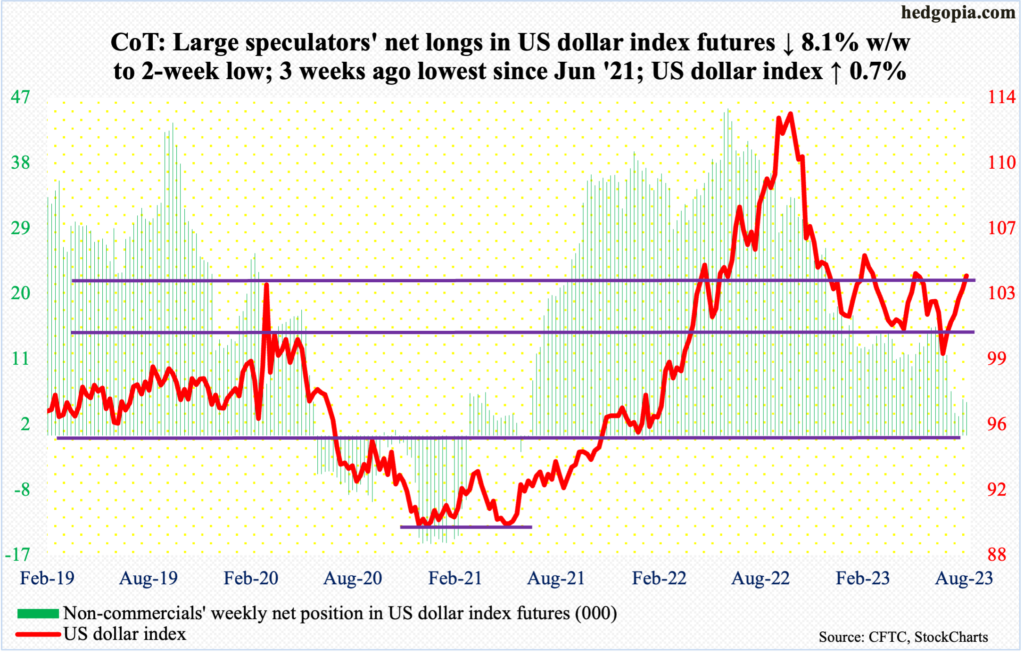
On May 31, the US dollar index ticked 104.61 before heading meaningfully lower, bottoming at 99.22 on July 18. Resistance at 103-104 goes back to at least December 2016.
Since that July low, the index has now rallied for six straight weeks, with this week adding 0.7 percent to 104.01. On Friday, it rose as high as 104.39 but dollar bulls were unable to hang on to the high, resulting in a long-legged doji. The candle probably contains a message, particularly because it showed up at the above-mentioned resistance. For now, the path of least resistance is down.
VIX: Currently net short 27.7k, up 1.7k.
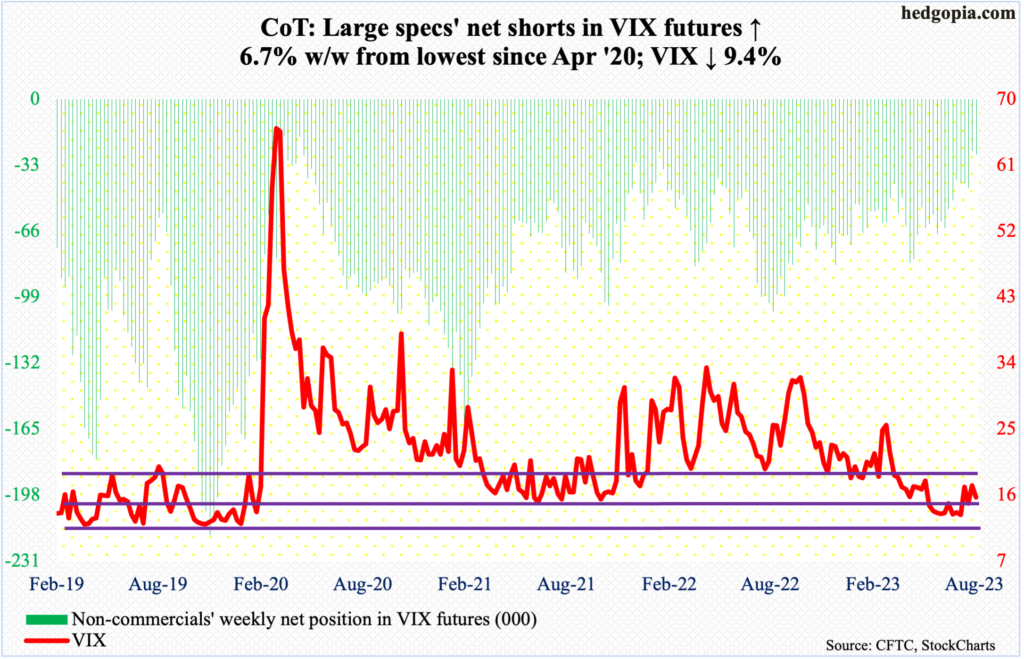
The daily RSI is at a crucial stage, closing Friday at 49.45. The metric broke above the median early this month, with VIX subsequently rallying as high as 18.88 by the 18th before coming under pressure. This week, it closed at 15.68.
A breach of the median will send the daily RSI back to where it had been for months – that is, sub-50. Should this come to pass, it will be good news for equity bulls and bad for volatility bulls, as VIX heads lower. This is near term.
Mid-to long-term, VIX’s monthly is just beginning to move up and has a long way to go on the upside.
Thanks for reading!
