
Following futures positions of non-commercials are as of December 5, 2023.
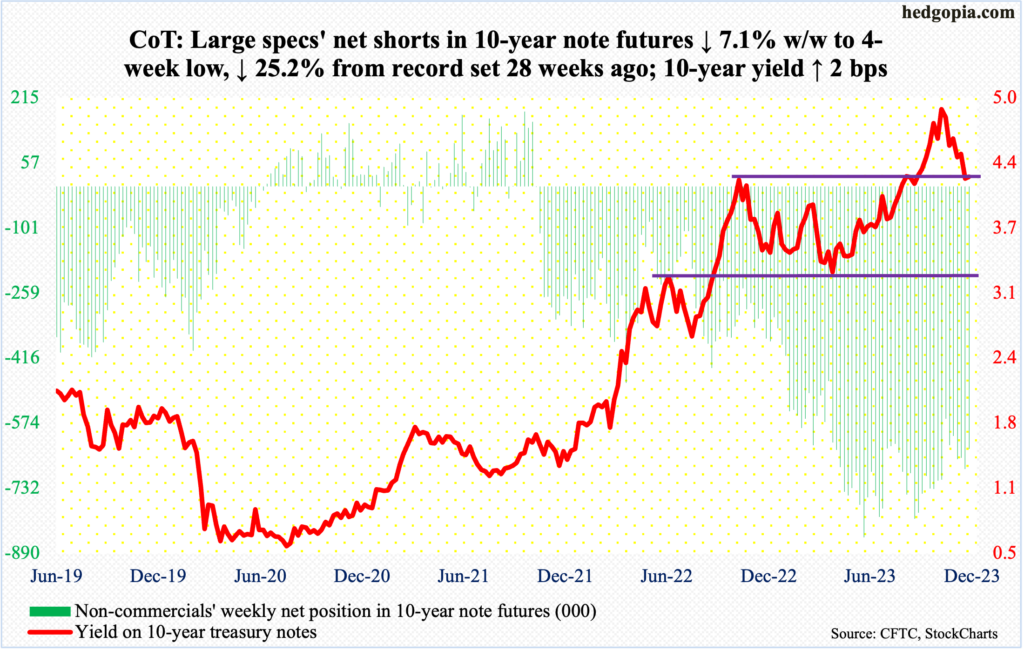
10-year note: Currently net short 636.5k, down 48.9k.
The FOMC meets next Tuesday-Wednesday. This will be the year’s last meeting. They are expected to do nothing. The last hike was in July to a range of 525 basis points to 550 basis points, up from zero to 25 basis points in March last year.
Markets are betting that a terminal rate has been reached. The Federal Reserve probably agrees with that, although it would not want to tacitly state that. The central bank fears that would further loosen financial conditions.
Since the late-October lows, equities have rallied big, adding trillions in paper wealth, which can potentially buoy up consumer sentiment/spending. This does not help the cause of a central bank that wants to bring inflation to its target of two percent.
November’s consumer price index is due out Tuesday. In October, core CPI rose four percent from a year ago. In that same month, core PCE (personal consumption expenditures), which is the Fed’s favorite, increased 3.5 percent year-over-year. The Fed would like the current disinflation trend to continue and is in no mood to acquiesce to futures traders’ demands for four to five 25-basis-point cuts by the end of next year. On Wednesday, it is almost certain Chair Jerome Powell will stick to this playbook. Any drop of a hint otherwise will lit another fire under risk assets – something he has not been a fan of lately.
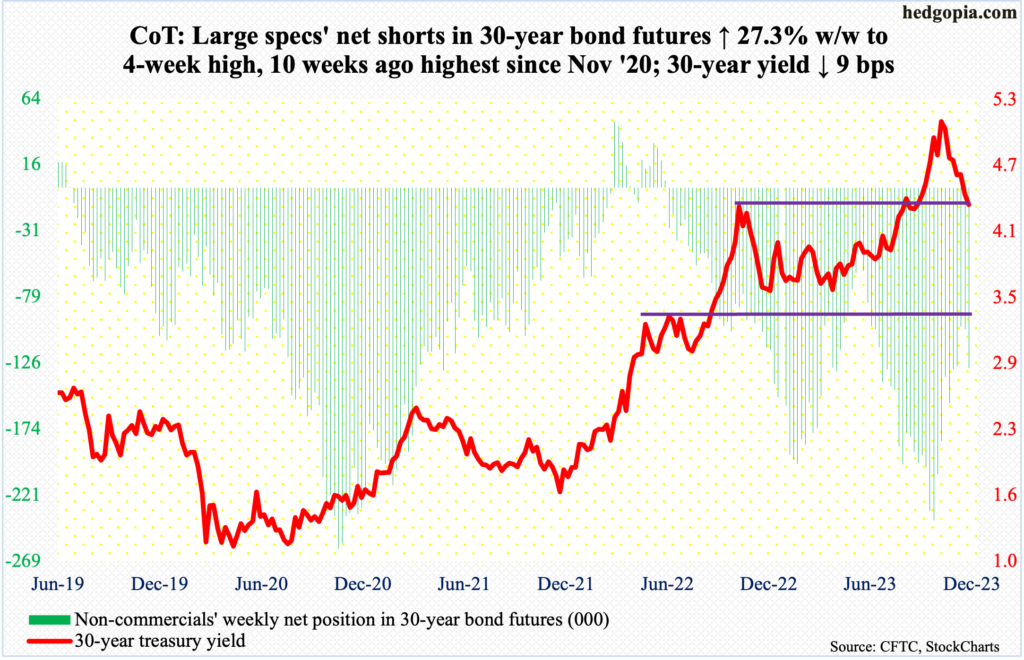
30-year bond: Currently net short 130.1k, up 27.9k.
Major US economic releases for next week are as follows.
The NFIB optimism index (November) and the consumer price index (November) are due out Tuesday.
Small-business optimism edged lower one-tenth of a point in October to 90.7. April’s 89 was the lowest since January 2013.
In the 12 months to October, headline and core CPI increased 3.2 percent and four percent respectively. They peaked last year at 9.1 percent (June) and 6.6 percent (September), in that order.
The producer price index (November) is scheduled for Wednesday. From a year ago, headline and core wholesale prices in October rose 1.3 percent and 2.9 percent respectively.
Retail sales (November) will be out Thursday. October sales inched lower 0.1 percent month-over-month to a seasonally adjusted annual rate of $705 billion. September’s $705.7 billion was a record.
Friday brings industrial production (November). In October, capacity utilization decreased 0.7 percent m/m to 78.9 percent. The cycle high 80.8 percent was posted in September last year.
WTI crude oil: Currently net long 170k, down 3.8k.
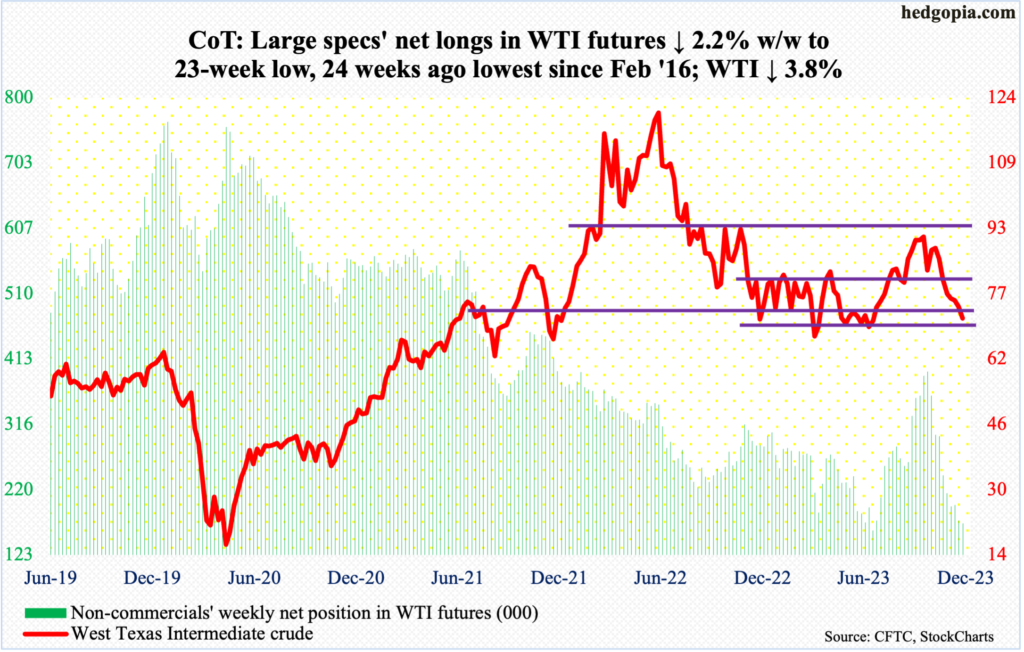
West Texas Intermediate crude is now down seven weeks in a row, down 3.8 percent this week to $71.23/barrel. Earlier, it ticked $95.03 on September 28th and reversed lower. It began to rally from $67.05 in June. Bids showed up this week just before testing that low.
In Thursday’s long-legged doji session, the crude touched $68.80 before reversing higher to close at $69.34. By then, it had decisively breached a one-year range between $71-$72 and $81-$82. But Friday’s 2.7-percent jump pushed it back into the range.
The daily is oversold and seems to want to rally. For that to come true, oil bulls need to reclaim the November 16th low of $72.37 first.
In the meantime, as per the EIA, US crude production in the week to December 1st dropped 100,000 barrels per day week-over-week to 13.1 million b/d. Before this, output remained unchanged at record 13.2 mb/d for eight weeks in a row. Crude imports increased 1.7 mb/d to 7.5 mb/d. As did stocks of gasoline and distillates, which respectively grew 5.4 million barrels and 1.3 million barrels to 223.6 million barrels and 112 million barrels. Crude inventory, on the other hand, fell 4.6 million barrels to 445 million barrels. Refinery utilization was up seven-tenths of a percentage point to 90.5 percent.
E-mini S&P 500: Currently net short 47.3k, down 17.8k.
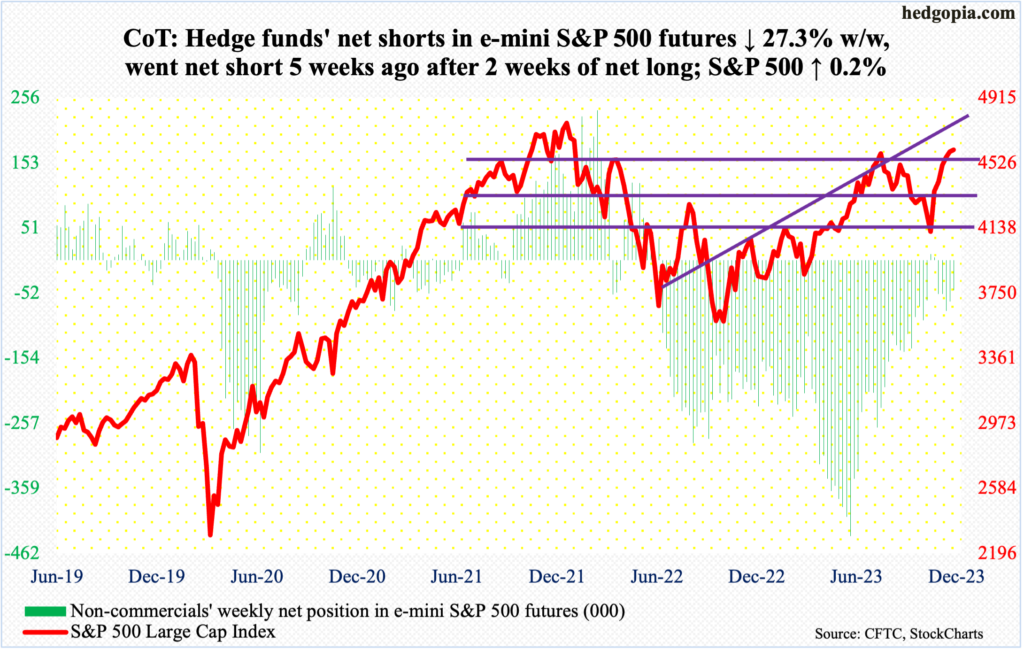
Equity bulls spent a lot of currency this week for a meagre 0.2-percent gain in the S&P 500. Nevertheless, it did ensure them six up weeks in a row. The bears had a decent opening early on but were unable to latch on to it. By Wednesday’s low, the large cap index was down one percent for the week; this was frittered away, as the bulls put their foot down in the remaining two sessions, to end the week at 4604, which is less than three points from the July high. Between July 27th and October 27th, the S&P 500 lost 500-plus points.
In an FOMC week next week, it is probable the bulls will try to spin whatever is thrown at them to suit their long bias and force a breakout. The key thing is if any up move will have the staying power, given how overbought the technicals are.
Euro: Currently net long 152.4k, up 9.2k.
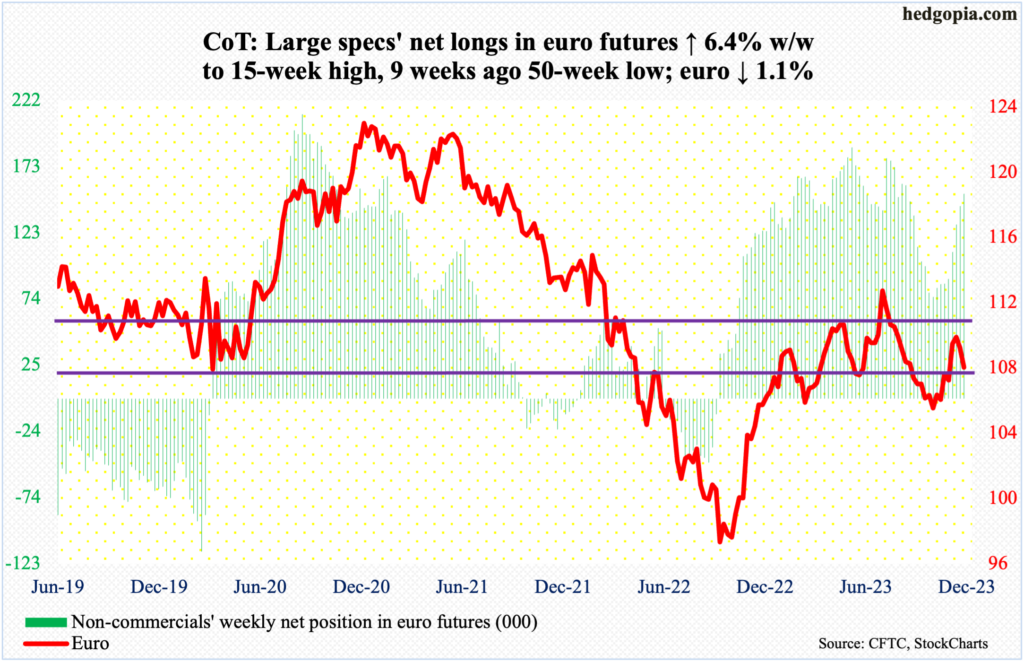
The euro suffered its second successive down week, down 1.1 percent to $1.0764. It has been under pressure since tagging $1.1011 on November 28th. Earlier, the currency bottomed at $1.0448 on October 3rd, having dropped from $1.1270 on July 18th.
The weekly wants to go much lower in due course, but should the daily prevail near-term, the euro can rally. It dropped as low as $1.0724 intraday Friday, which attracted bids. There is horizontal support at $1.07-$1.08. The 50-day – slightly rising – is at $1.0698.
Gold: Currently net long 203.5k, up 3.5k.
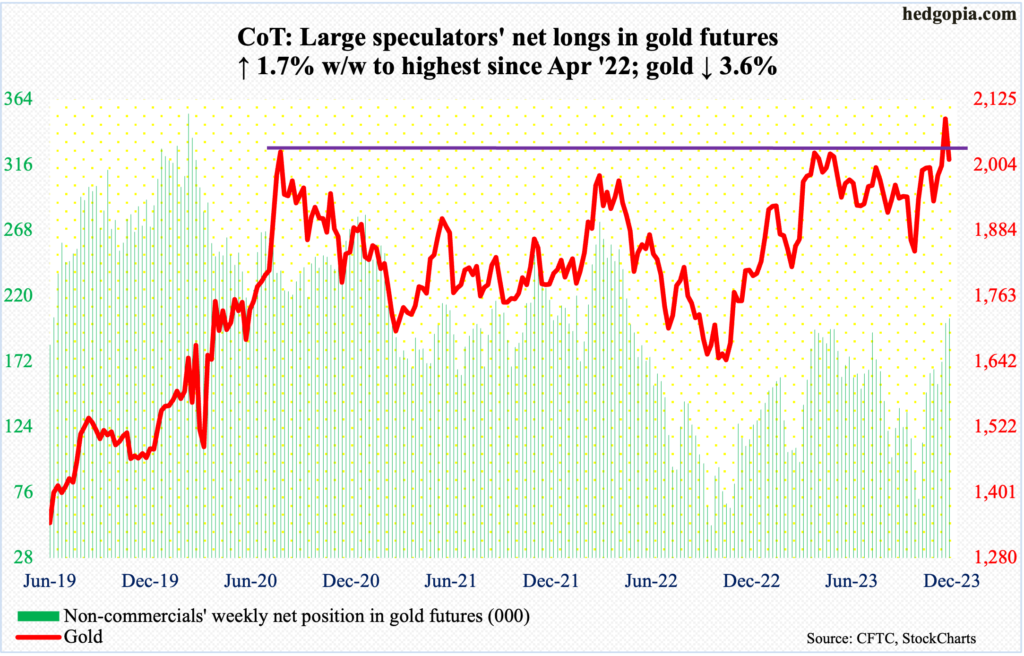
Gold bugs are probably not happy how the week evolved. The much-anticipated breakout at $2,080s did come about, but this was quickly followed by a nasty reversal.
The metal jumped 4.3 percent last week to $2,090 – a level of immense import. In August 2020, gold posted a new all-time high of $2,089 and retreated. The same thing happened in March last year when it printed $2,079 and in May this year when $2,085 was tagged.
Come Monday, gold began where it left off, rallying as high as $2,152 intraday, but only to then reverse to close at $2,042. That is a swing of $110 in a session! When it was all said and done, it finished the week at $2,015.
The reversal has potential to be a major one. For now, there was some buying interest Friday at lateral support of $2,010s, a breach – likely – of which will open the door to a test of the 50- and 200-day at $1,968 and $1,961 respectively.
In the meantime, non-commercials remain committed for now, with net longs highest since April last year. If gold fails to regain momentum soon, these traders can decide to move on.
Nasdaq 100 index (mini): Currently net long 8.4k, up 1.1k.
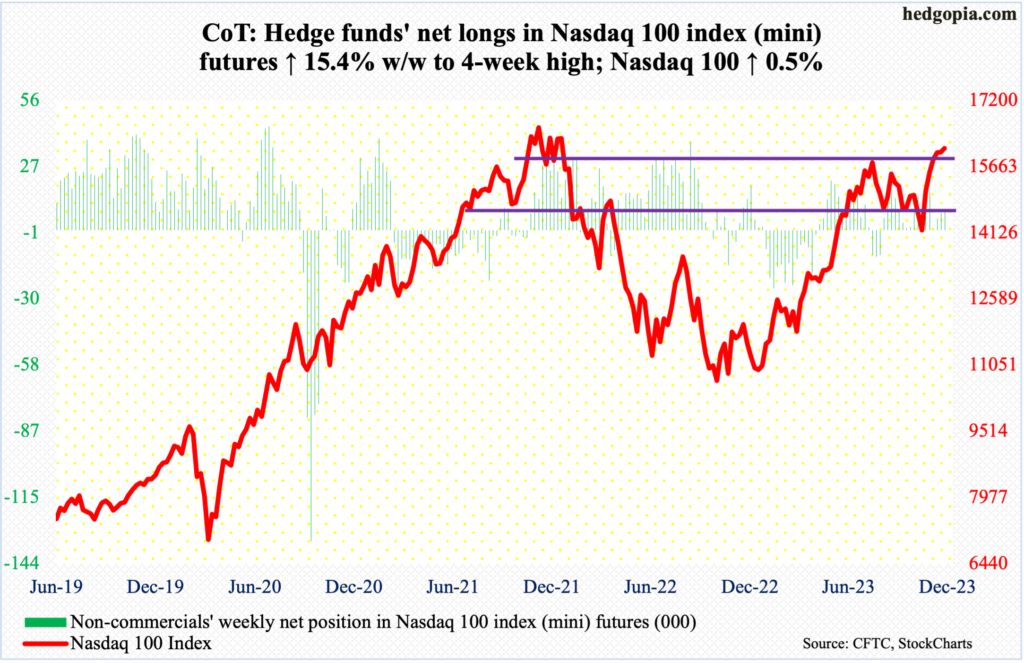
Tech bulls should be happy the Nasdaq 100 ended the week up 0.5 percent. At one time Monday, the index was down 1.9 percent. This followed last week’s weekly spinning top.
The tech-heavy index closed this week at 16085. In November 2021, it reached 16765 before proceeding to enter a bear market. Tech bulls would love to go after that high in a seasonally favorable period, but it is also the fact that the index is showing some signs of distribution after six up weeks in succession.
Russell 2000 mini-index: Currently net short 55.4k, down 64.
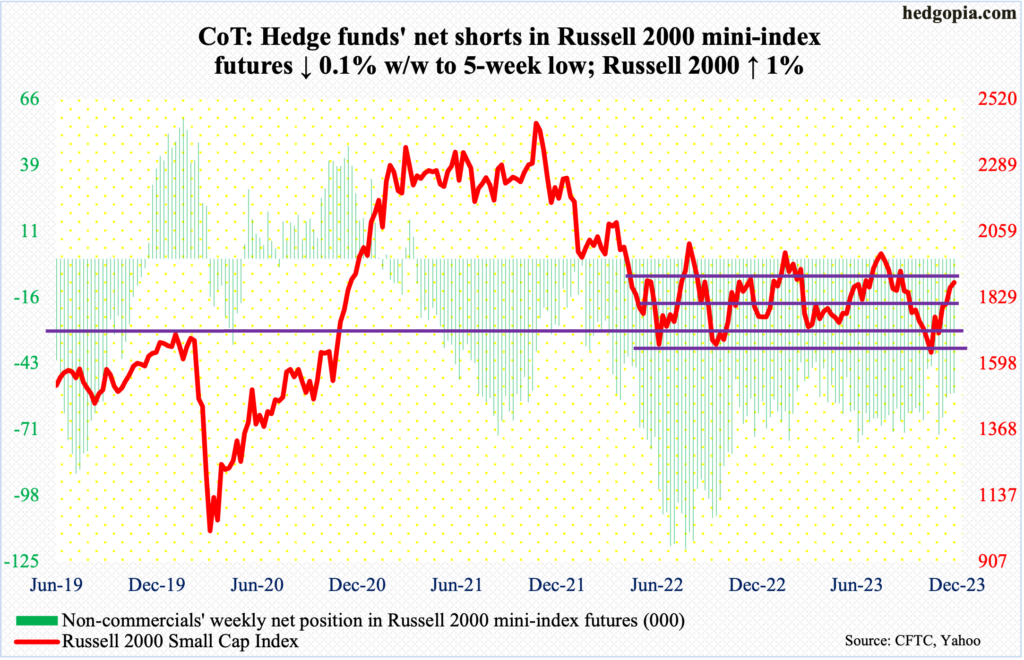
The Russell 2000 is inching closer to the top of a nearly two-year range. The small cap index has been stuck in a 200-point range between 1700 and 1900 since January last year. This week, it rallied one percent to close at 1881, having tagged 1889 intraday Wednesday.
The last time small-cap bulls meaningfully succeeded in rallying past 1900 was in July when it ended the month at 2004 and then went the other direction. Before this, the Russell 2000 peaked at 2007 early February and at 2017 in August last year.
A sustained breakout is not going to be easy – particularly not when there are immense questions as to if the current momentum in the economy will carry through to 2024. The way small-caps are acting, that will be a tall order.
US Dollar Index: Currently net long 19.9k, up 857.
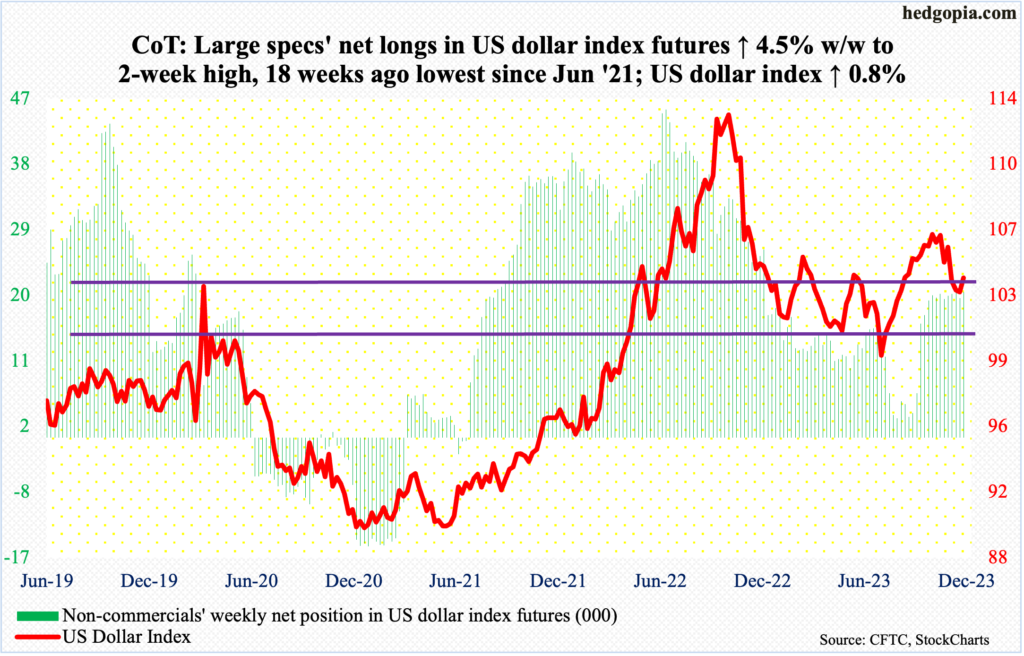
The US dollar index rallied 0.8 percent but at 103.09 is yet to recapture horizontal resistance at 103-104, which goes back to at least December 2016.
Right here and now, dollar bulls should be given the benefit of the doubt. This week, they succeeded in reclaiming the 200-day (103.40). The 50-day is at 105.07.
At 48.73, the daily RSI remains just under the median and has been there since early November. Gold needs to reclaim 50 for momentum to begin to build.
VIX: Currently net short 56.8k, up 9.2k.
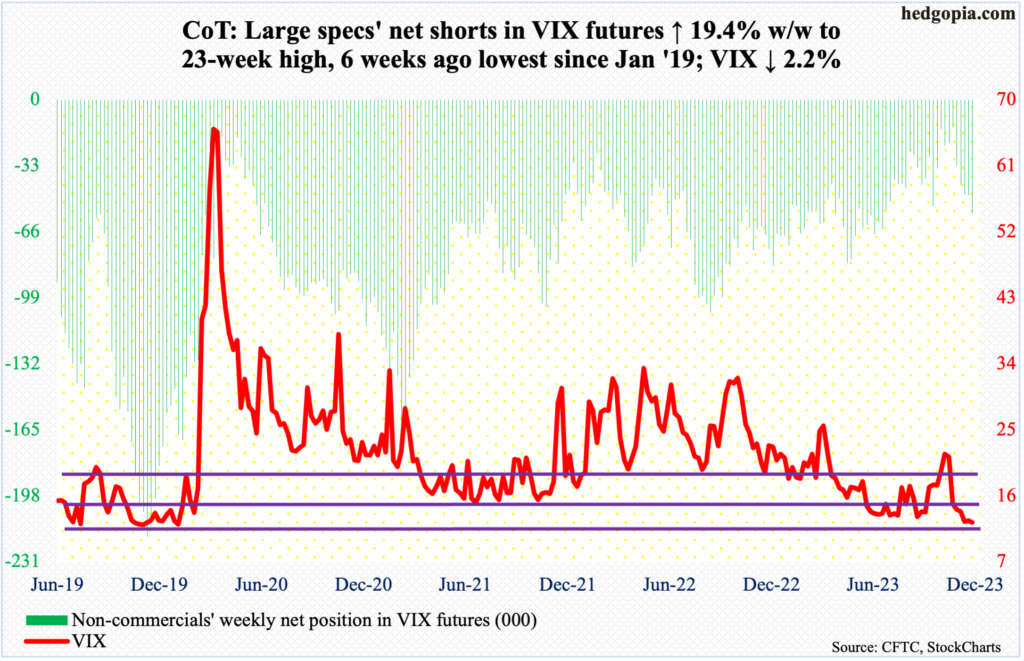
The 20-day repeatedly came in the way of rally attempts in four of the five sessions. In the end, VIX gave back 0.28 point to 12.35, closing at the low. This was the lowest print since January 2020.
Prior to a rally in the volatility index in September and October, it routinely found support at 13, or just south of it, in June through September. That support has been slightly breached. At this point, the risk of VIX falling toward the next layer of support at 11-12 has risen somewhat.
In the meantime, in a show of the ongoing investor complacency, the CBOE equity-only put-to-call ratio has been in the 0.50s for six sessions in a row – and in seven of the last eight sessions. In the early sessions next week, the 10-day ratio likely begins to look seriously extended.
Thanks for reading!
