
Following futures positions of non-commercials are as of December 19, 2023.
10-year note: Currently net short 687.6k, up 130.6k.
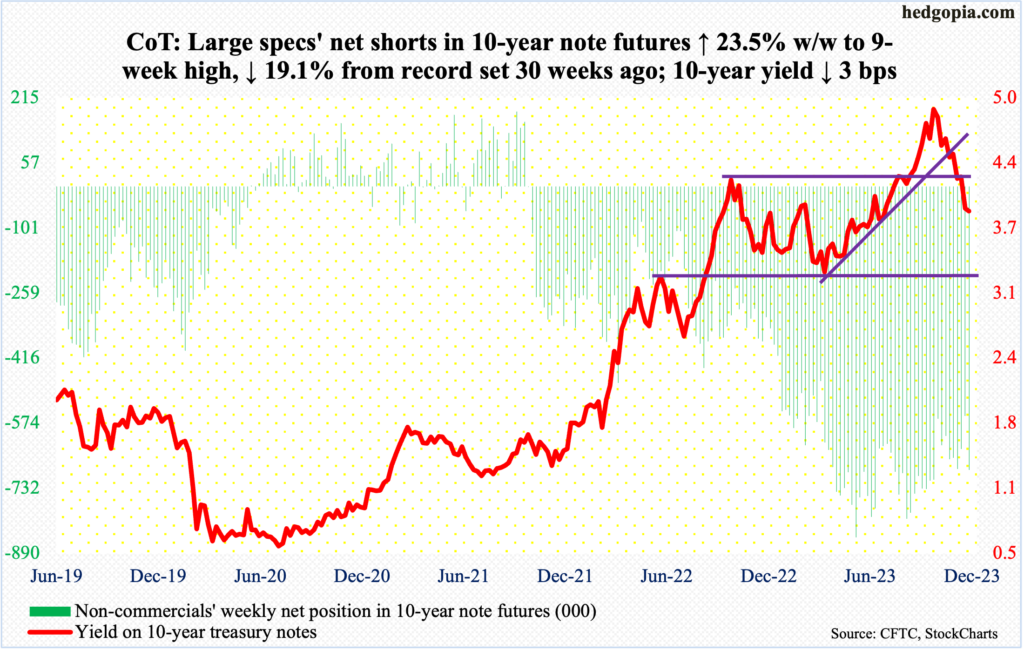
In the last week of 2022, non-commercials were net short 344,209 contracts in 10-year note futures. This week, they held 687,572 contracts, up 130,641 from the prior week – the prior week being a week in which the Fed unexpectedly made a dovish turn, and the 10-year gave back 32 basis points. Evidently, these traders took that as an opportunity to add to their holdings.
It just feels like non-commercials are in a mood to pick up pennies in front of a steamroller. Hindsight is always 20/20, but they had a great opportunity to cover when the 10-year hit five percent in October, having rallied from 3.25 percent in April (and 2.53 percent in August last year and 1.13 percent in August before that). Non-commercials have been net short since October 2021. So, directionally, they have nailed the trade, as yields headed higher.
But in this business it is also possible to overstay your welcome. The 10-year genuinely acts like it has peaked in the current cycle. From five percent on October 23rd, yields hurriedly dropped to 3.83 percent this Thursday, closing out the week at 3.9 percent. Incidentally, the 10-year is just about flat for the year, having ended 2022 at 3.88 percent.
For now, the daily – deeply oversold – is trying to stabilize just under the 200-day moving average (4.03 percent). Immediate resistance lies at 4.1 percent. Non-commercials must be hoping the level gets taken out – so they get a chance to cover at higher yields.
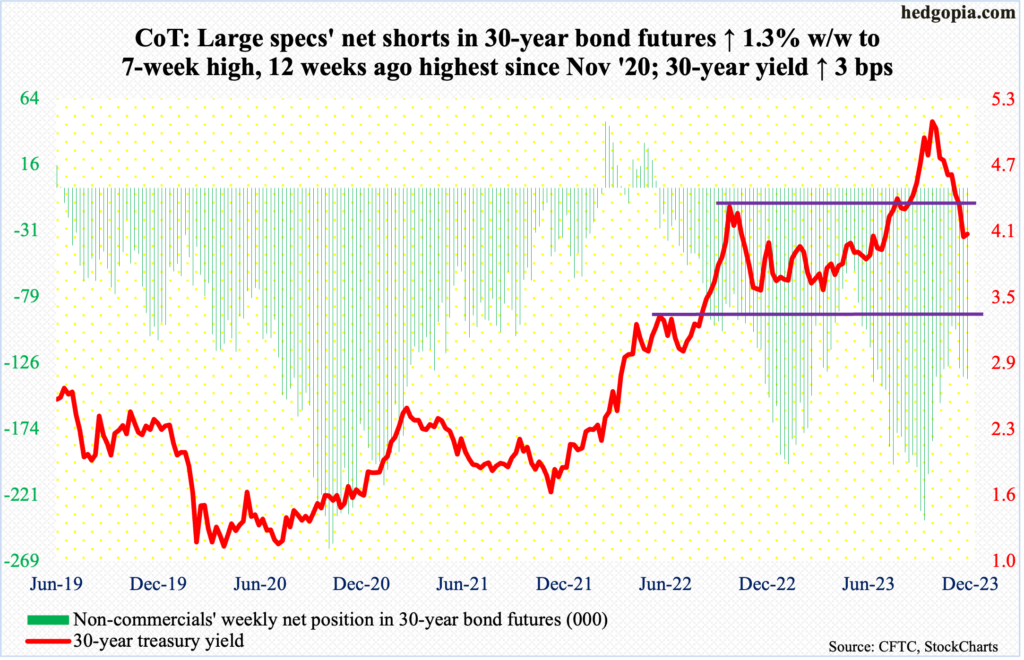
30-year bond: Currently net short 138k, up 1.7k.
Major US economic releases for next week are as follows. Markets are closed Monday for observance of Christmas. Happy Holidays!
On Tuesday, the S&P Case-Shiller Home Price Index (October) is due out. Nationally, home prices in September rose 0.3 percent month-over-month and 3.9 percent year-over-year. This was the third consecutive increase y/y after three months of decline from April through June. Earlier, prices shot up at a record 20.8 percent in March last year.
WTI crude oil: Currently net long 190.4k, up 28.2k.
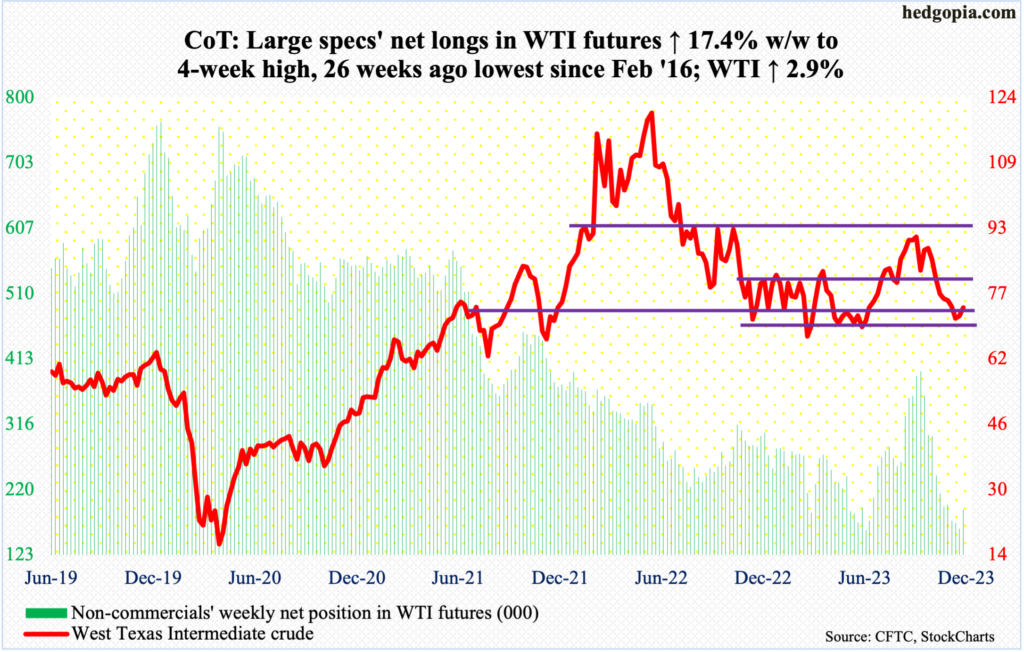
After sliding lower all along the daily lower Bollinger band for several sessions, West Texas Intermediate crude stopped going down on the 13th at $67.71. Earlier, it peaked at $95.03 on September 28th, having begun to rally in June at $67.05. So, the June low was defended.
This week, the crude rallied 2.9 percent to $73.89/barrel – its second straight up week. The one-year range between $71-$72 and $81-$82 was breached intraweek in the prior two weeks but saved by close.
The weekly is itching to rally, but the daily may not be willing to go along just yet. At best, WTI has a shot at the 200- and 50-day ($77.67 and $77.91 respectively).
In the meantime, as per the EIA, US crude production in the week to December 15th set a record, up 200,000 barrels per day week-over-week to 13.3 million b/d. Crude imports increased as well, up 233,000 b/d to 6.8 mb/d. As did stocks of crude, gasoline, and distillates, which respectively rose 2.9 million barrels, 2.7 million barrels and 1.5 million barrels to 443.7 million barrels, 226.7 million barrels and 115 million barrels, in that order. Refinery utilization was up 2.2 percentage points to 92.4 percent.
E-mini S&P 500: Currently net short 195.4k, up 130.3k.
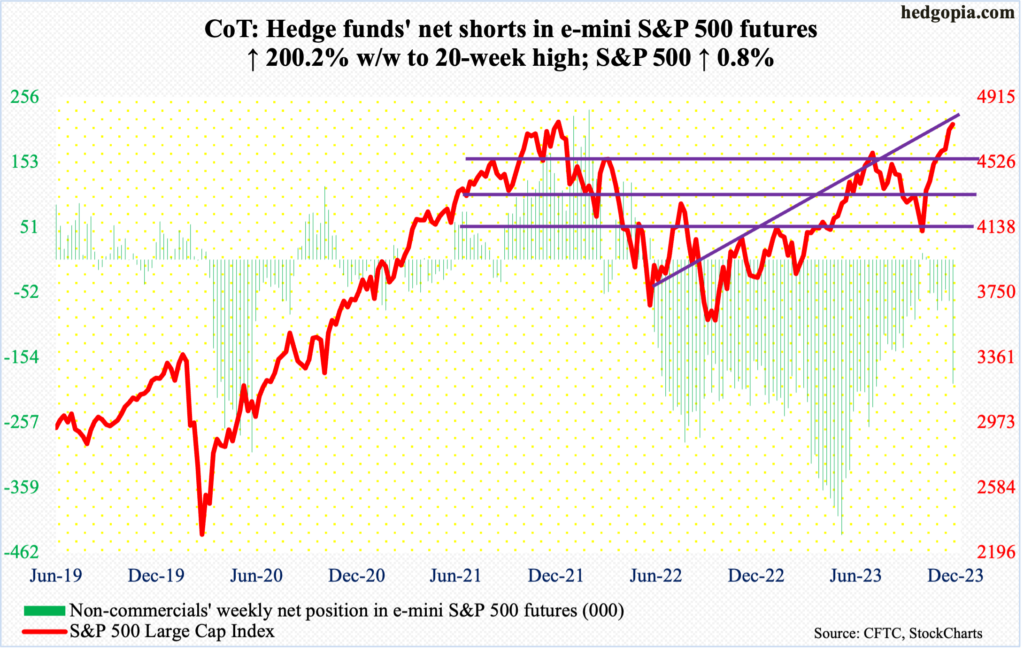
Non-commercials are using the Fed pivot rally as an opportunity to add to net shorts in e-mini S&P 500 futures. On the 12th – the day before the conclusion of the FOMC meeting last week – the large cap index closed at 4644. Come the 13th, Jerome Powell, Fed chair, sounded way more dovish than expected, igniting a fierce rally in risk assets. The S&P 500 closed this week at 4755, having ticked 4778 on Wednesday. Non-commercials are not buying it. Their holdings of net shorts this week jumped 200 percent from the prior week to a 20-week high.
Amidst this, the index is merely 64 points from the record high 4819 posted in January last year. This week, it rallied 0.8 percent – its eighth consecutive up week. Sentiment is too giddy (more on this here). There is complacency in the air, with some subtle signs of distribution. Wednesday’s 1.5-percent decline came out of nowhere. Friday’s spinning top was the second time in seven sessions this candle showed up. As things stand, risk-reward odds are better for contrarians.
Euro: Currently net long 114.6k, down 32.7k.
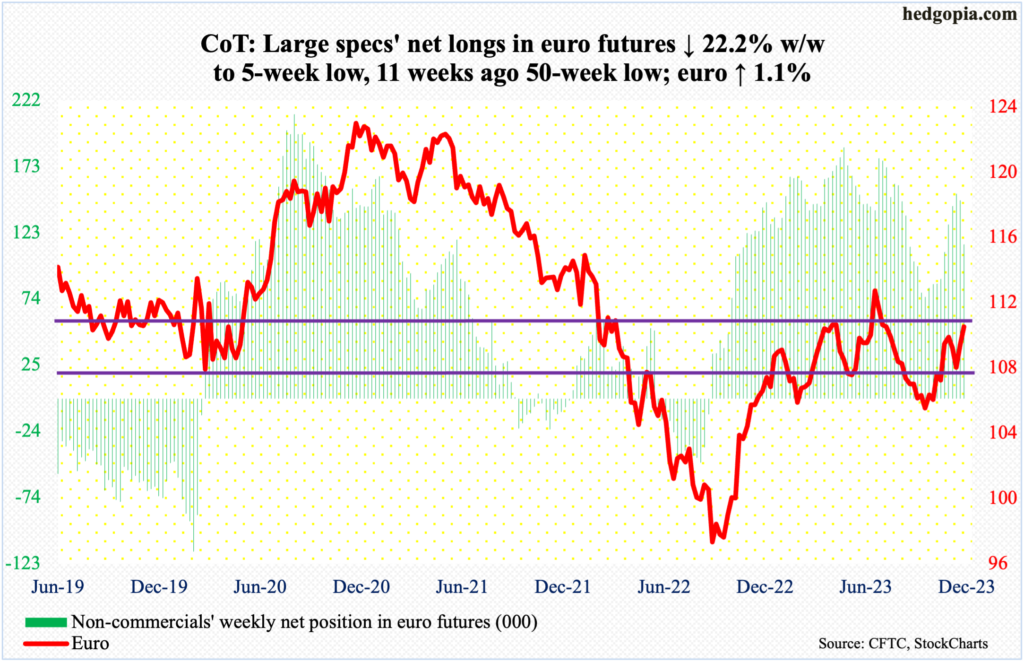
Friday’s intraday high of $1.1042 was the highest print since August 10th, but the euro failed to hang on to it, closing at $1.1011, up 1.1 percent for the week. This is an area – $1.10-$1.11 – where selling pressure has intensified in the past.
Even last week, euro bulls went after $1.10 with an intraday high of $1.1011 on Thursday but were rejected. The currency had been under pressure since tagging $1.1011 on November 28th. A takeout of this level opens the door toward the July high of $1.1270.
Gold: Currently net long 201.3k, up 13.1k.
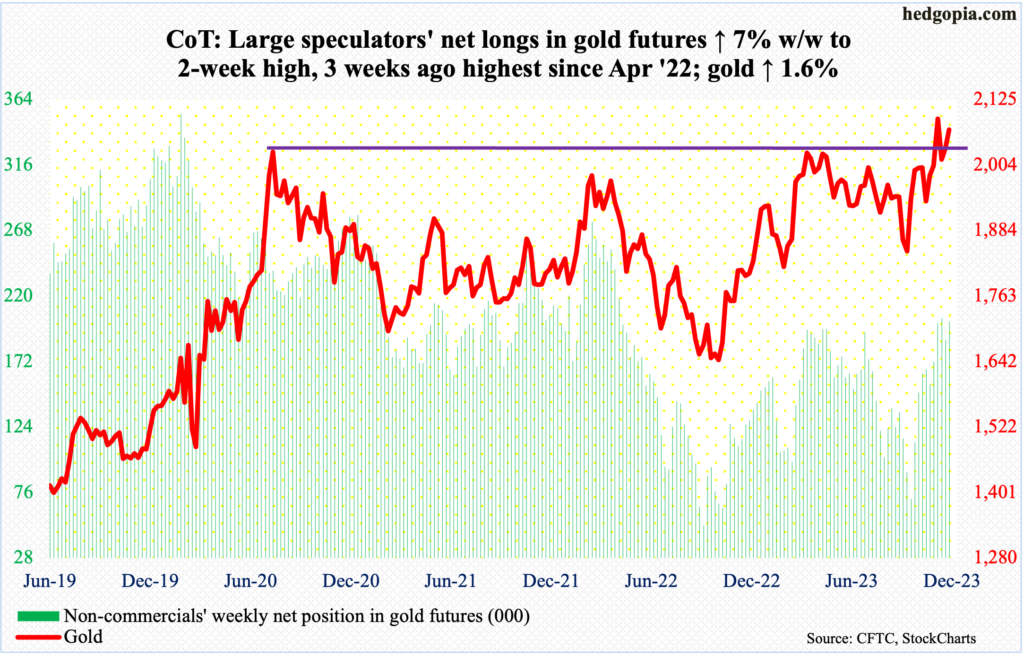
Three weeks ago, no sooner did gold break out of $2,080s than it quickly met with a nasty reversal. This level has a lot of memory attached to it. In August 2020, the metal posted a new all-time high of $2,089 and retreated. This occurred again in March last year when it printed $2,079 and in May this year when $2,085 was tagged.
After the 4th reversal, gold stabilized just above the rising 50-day with a tag of $1,988 on the 13th, rallying back above $2,000 in the very next session. Yet, come Friday this week, as soon as the yellow metal rallied to $2,083, offers overwhelmed bids, closing the session/week at $2,069/ounce.
So, $2,080s it is for the bugs – a make-or-break.
Nasdaq 100 index (mini): Currently net long 22.2k, up 14.1k.
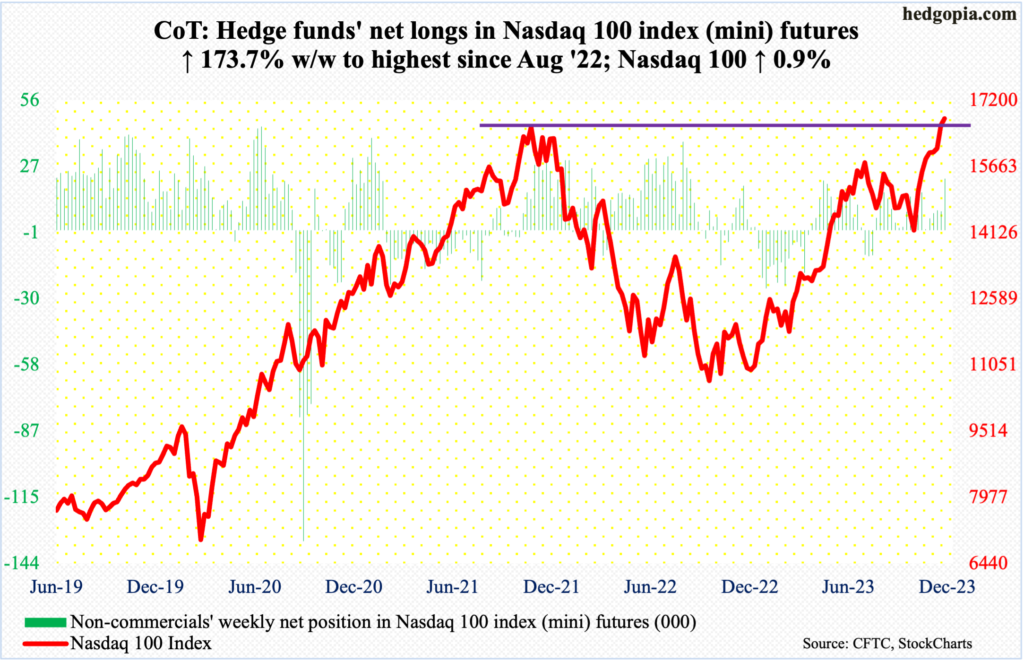
The Nasdaq 100 squeaked by the November 2021 high of 16765 this week, tagging 16861 on Wednesday. Back then, the index soon retreated, resulting in a spinning top month, followed by a dragonfly doji December and a breakdown January. The index would not bottom until October last year when it troughed at 14441. The rally from that low really began in March this year.
What a rally it has been! For the year, the tech-heavy index is on pace to surging 53.4 percent, making a round trip in just over two years. The question going forward is if tech bulls will be able to digest these gains or begin to regurgitate as the new year begins. The problem with the ongoing rally is that a decent amount of the gains has come in the last eight weeks – all positive – when sellers on balance go on strike. Seasonality can only go so far. Longs are sitting on tons of gains and could be itching to lock them in, but not doing so this year to defer taxes. The resultant nervousness was witnessed Wednesday – the day the new high was reached – when the index suddenly sold off 1.5 percent.
In the event of a drawdown, nearest support lies at 16100s.
Russell 2000 mini-index: Currently net short 30k, down 20.6k.
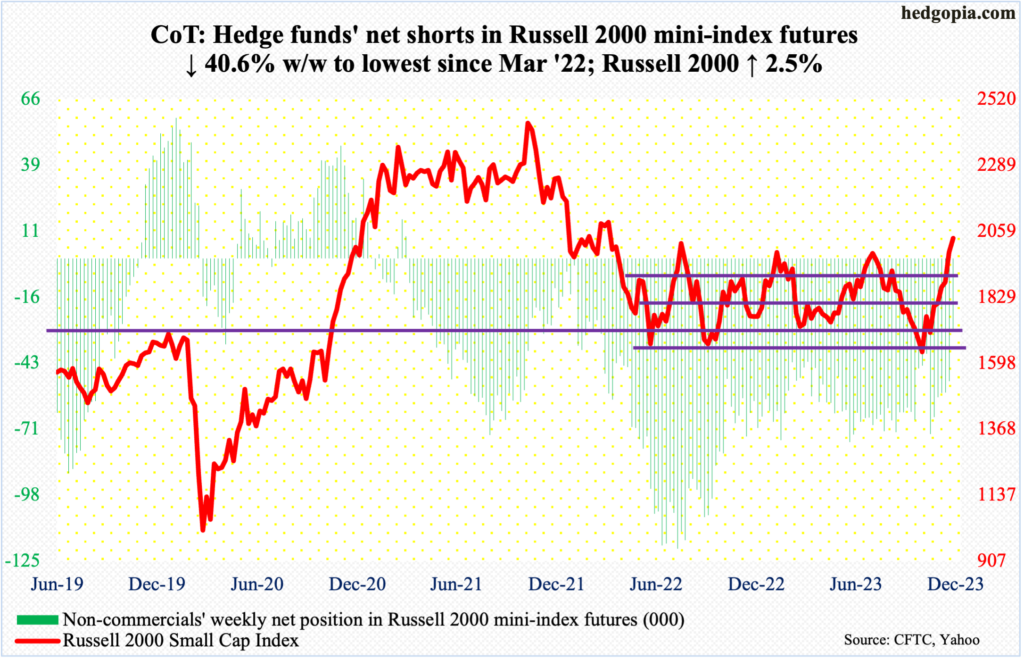
In the wake of last week’s Fed pivot-induced range breakout, the Russell 2000 had a volatile week, with a high of 2042 on Friday and a low of 1981 on Monday. Last week, the small cap index broke out of a 200-point range between 1900 and 1700, which had been in place since January last year. The measured-move target is 2100. For that to happen, small-cap bulls first need to convincingly take care of the August 2022 high of 2030.
The Russell 2000 peaked at 2459 in November 2021, then bottoming in June last year at 1642. After that, 1900 was reclaimed at least three times – only to then rally just north of 2000 and then retreat. This happened this year in February (2007) and July (2004) and in August last year (2030). The index has surpassed the first two highs and is attempting to reclaim the third one. This week, it closed at 2034. Next week is crucial – particularly considering several members have warned markets post-FOMC to water down their aggressive rate-cut hopes for next year (more on this here).
US Dollar Index: Currently net long 3.9k, down 13.7k.
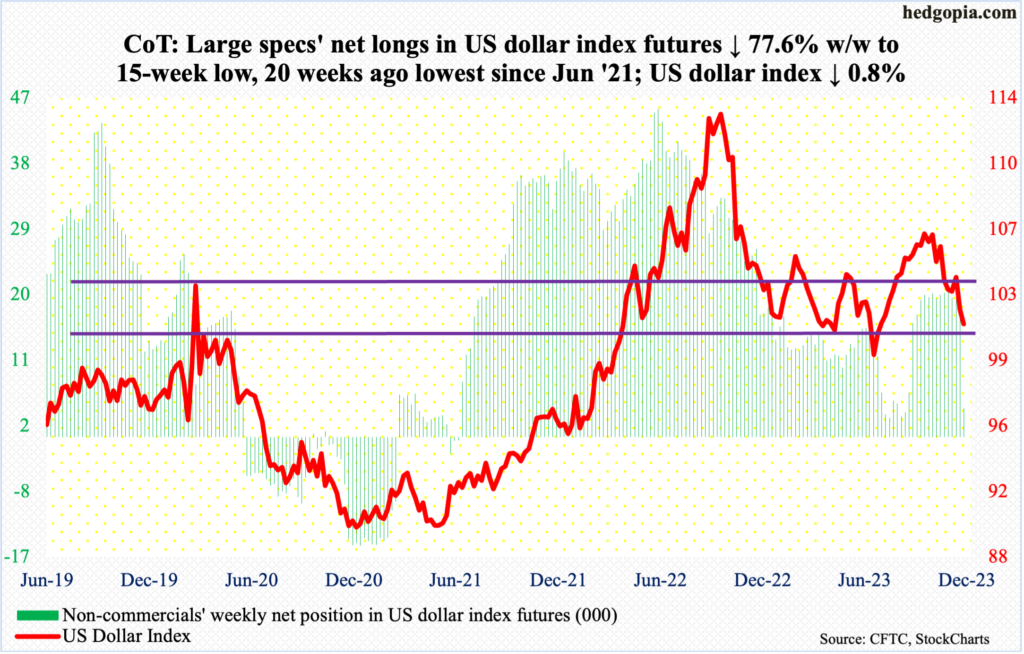
The US dollar index is at/approaching crucial support. It peaked early October at 107.05 and began to really come under pressure early November. Last Wednesday – post-Fed pivot – it sliced through horizontal support at 103-104 as well as the 200-day. This Friday, it fell as low as 101.07, closing at 101.34, down 0.8 percent for the week. Dollar bulls’ inability to defend this level will make the index vulnerable to a test of the July lows at 99.20s – at least.
VIX: Currently net short 30.2k, down 16.1k.
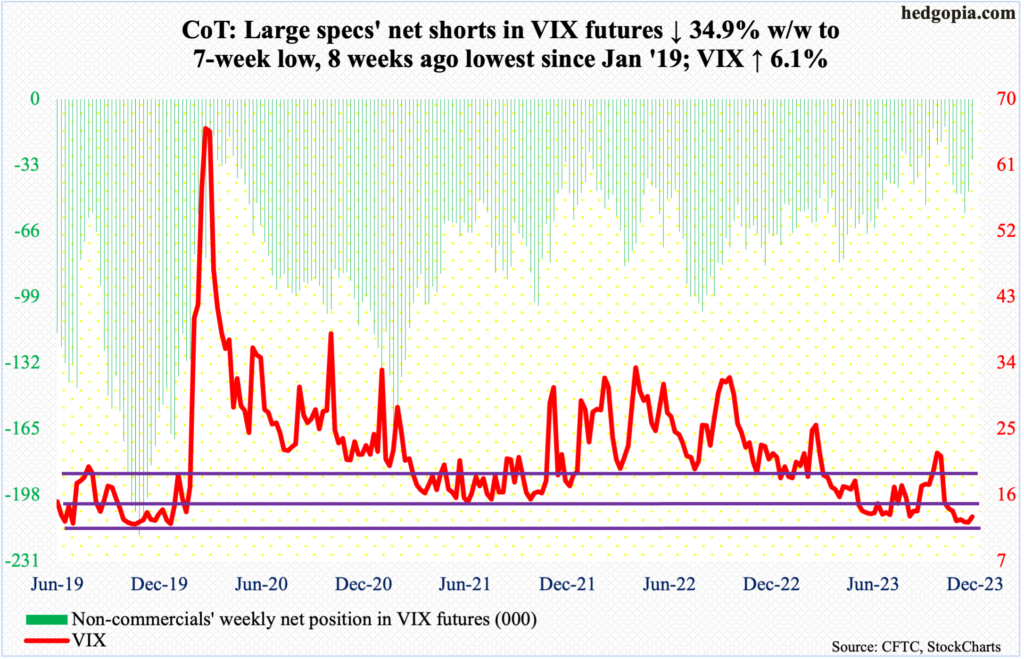
VIX, up 0.75 points w/w to 13.03, went hand in hand with the S&P 500 this week. This does not happen very often. By doing so, the volatility index refused to lose 12 on a sustained basis.
Last week, for three sessions from Tuesday through Thursday, VIX ticked the 11 handle intraday but only to finish north of 12. This week, the weekly low of 12.29 was set on Wednesday, with a high of 14.49 on Thursday. This has been the hallmark of volatility bulls for a while now – inability to hang on to gains, that is.
As things stand, equity bulls are calling all the shots, with signs of complacency all around. The CBOE equity-only put-to-call ratio went sub-0.50 on Friday, with a reading of 0.498. Before that, in 13 of 15 sessions, the ratio produced readings of 0.50s, with the lone exception of 1.16 on the 13th (FOMC day) and 0.61 on the 19th. This is froth territory!
Thanks for reading!
