
Following futures positions of non-commercials are as of January 9, 2024.
10-year note: Currently net short 787k, down 45.6k.
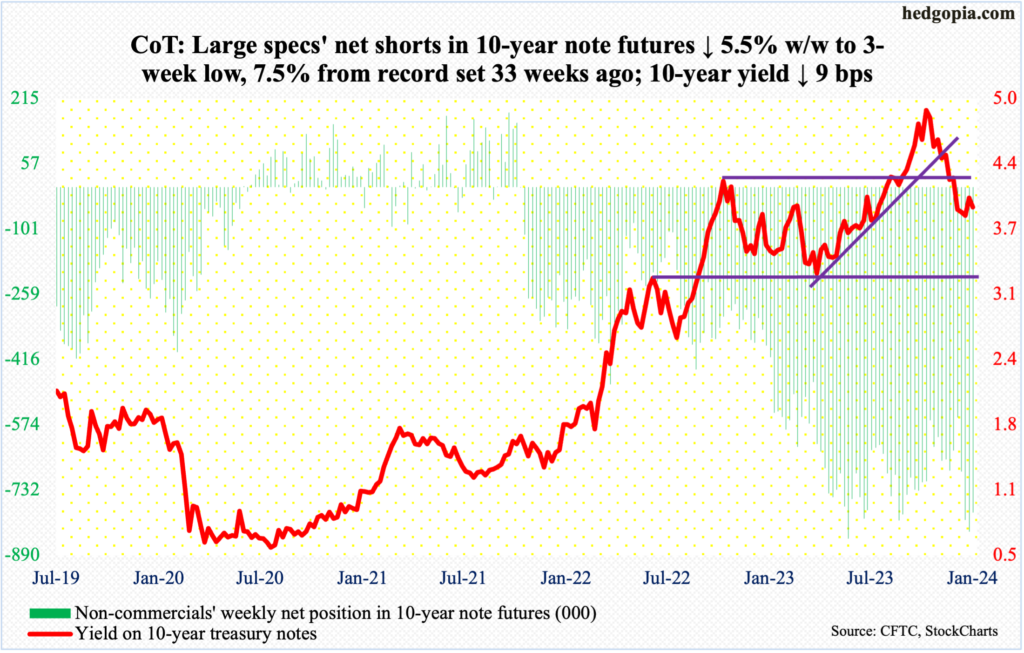
The 200-day moving average (4.06 percent), which coincides with horizontal resistance at 4.1 percent, is standing like a rock. Since this level was lost on the 13th last month post-FOMC dovish pivot, there have been several takeout attempts – particularly the last six sessions – but to no avail. This week, the 10-year treasury yield shed nine basis points to 3.95 percent.
Either driven by the inability of yields to push through the said resistance or just because they are holding massive net shorts in 10-year note futures, non-commercials this week cut their holdings by 45,643 contracts to 787,020. In the week to May 30th last year, they were net short a record 850,421 contracts.
The 10-year rate peaked at five percent (4.997 percent) on October 23rd. Last April, these notes were yielding 3.25 percent (and 2.53 percent in August 2022 and 1.13 percent in August 2021). Yields ticked 3.79 percent on December 27th, before rallying a tad.
It is important to remember that on December 12, the day before the Fed made the dovish pivot, the 10-year closed at 4.21 percent. Unless inflation makes a strong comeback and non-commercials get vindicated, 4.2s are likely to be treated as a spot where bond bulls would be interested in putting capital to work. If and when non-commercials agree with this thesis and decide to cut their bearish exposure, then there is a long way to go before they will be done.
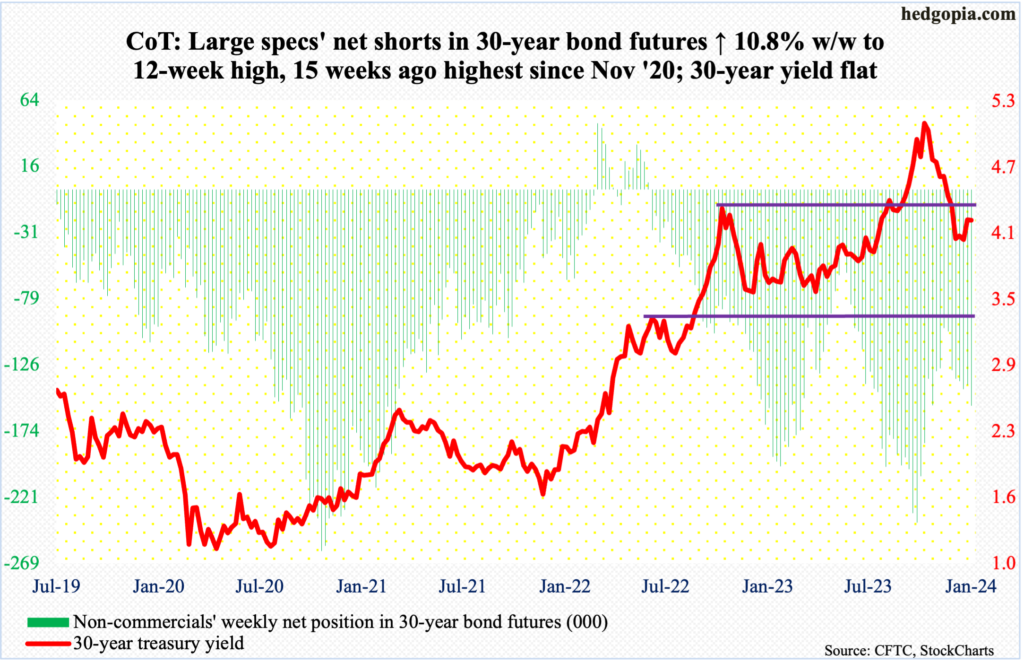
30-year bond: Currently net short 155.8k, up 15.1k.
Major US economic releases for next week are as follows. Markets are closed Monday for observance of Martin Luther King, Jr. holiday!
Retail sales (December), industrial production/capacity utilization (December) and the NAHB housing market index (January) are scheduled for Wednesday.
Retail sales grew 0.3 percent month-over-month in November to a seasonally adjusted annual rate of $705.7 billion. This was a new record.
Capacity utilization in November inched up 0.1 percent m/m to 78.8 percent. The cycle high 80.8 percent was reached in September 2022.
Homebuilder optimism in December rose three points m/m to 37. The December 2022 low of 31 was the lowest since April 2020.
Housing starts (December) are due out Thursday. Starts jumped 14.8 percent m/m in November to 1.56 million – a six-month high.
Friday brings existing home sales (December) and the University of Michigan’s consumer sentiment index (January, preliminary).
In November, sales of existing homes increased 0.8 percent m/m to 3.82 million (SAAR) – a two-month high.
Consumer sentiment jumped 8.4 points m/m in December to 69.7 – a five-month high. Sentiment hit a record low 50 in June 2022.
WTI crude oil: Currently net long 182.7k, up 11.8k.
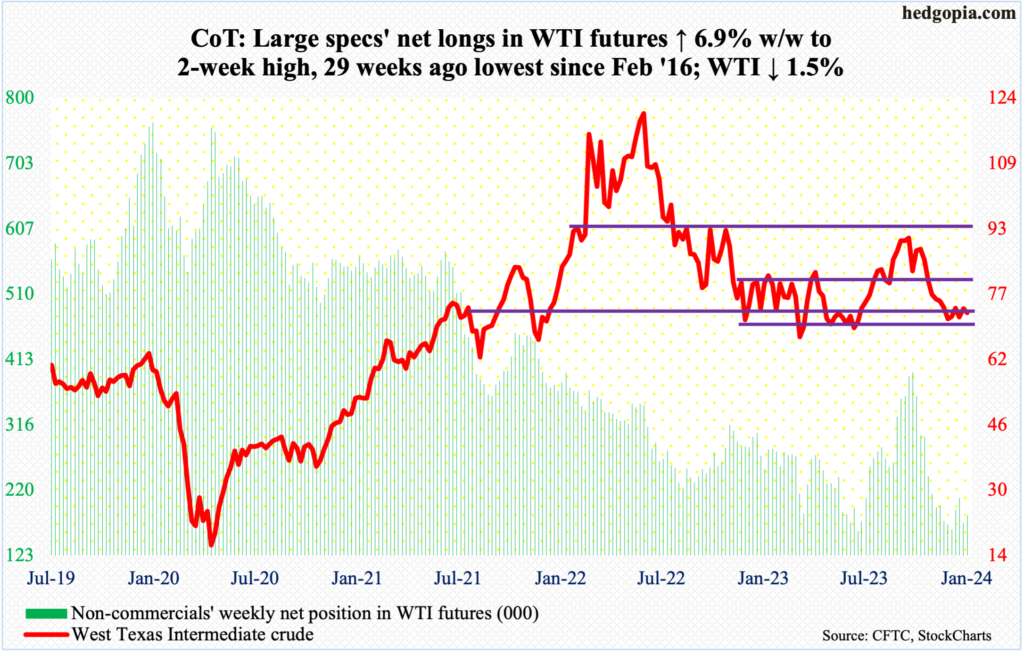
West Texas Intermediate crude continues to tread water. Intraday Monday, it dropped to $70.13, breaching the 13-month range between $71-$72 and $81-$82. Oil bulls soon showed up to defend that support. By Friday, the crude rallied as high as $75.32, but the bulls failed to hang on to it, closing the session/week at $72.68/barrel, rejected at the 50-day ($74.35) and the daily upper Bollinger band ($75.23). So, the back-and-forth continues, with both bulls and bears struggling to exert control.
Earlier, WTI peaked last September at $95.03, having rallied from last June’s low of $67.05. Oil bulls deserve the benefit of the doubt insomuch as the price remains above this level.
In the meantime, as per the EIA, US crude production in the week to January 5th was unchanged week-over-week at 13.2 million barrels per day; output set a record at 13.3 mb/d before that. Crude imports decreased 654,000 b/d to 6.2 mb/d. Stocks of crude, gasoline, and distillates all grew – respectively up 1.3 million barrels, eight million barrels and 6.5 million barrels to 432.4 million barrels, 245 million barrels and 132.4 million barrels. Refinery utilization was down six-tenths of a percentage point to 92.9 percent.
E-mini S&P 500: Currently net short 117k, down 97k.
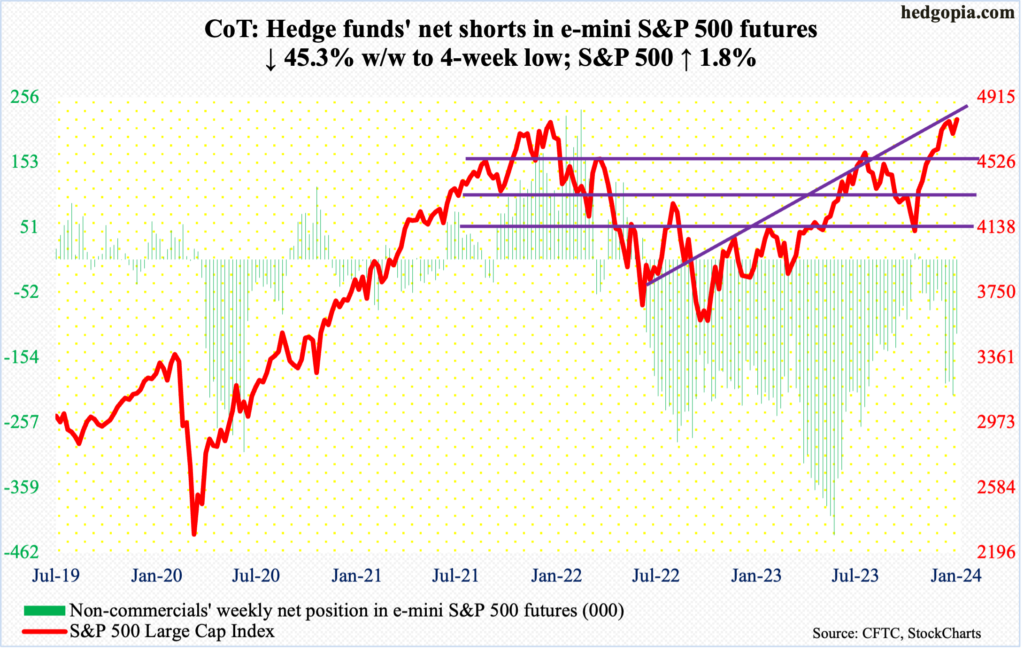
Equity bulls began the week rallying the S&P 500 1.4 percent. It is possible non-commercials contributed to this as their holdings of net shorts went down 45.3 percent in the latest week (as of Tuesday).
By the time the week was over, the cash added 1.8 percent to 4784, more than reversing last week’s loss of 1.5 percent. The large cap index is now within spitting distance of the January 2022 peak of 4819. As a matter of fact, the index rallied to 4802 intraday Friday, but most of the session’s gains was given away by close.
For two weeks now, the S&P 500 has found it tough to break through 4800, but it continues to hang out in the neighborhood. A breakout is probably imminent, as the 4Q23 earnings season picks up steam. The question is, if any strength will be used as an opportunity to lock in gains. At the end of October, the index bottomed at 4104.
The July 2023 high of 4607 was taken out just before the December 13th Fed-pivot rally. In the event of downward pressure, this price point can act as a magnet.
Euro: Currently net long 118.9k, down 599.
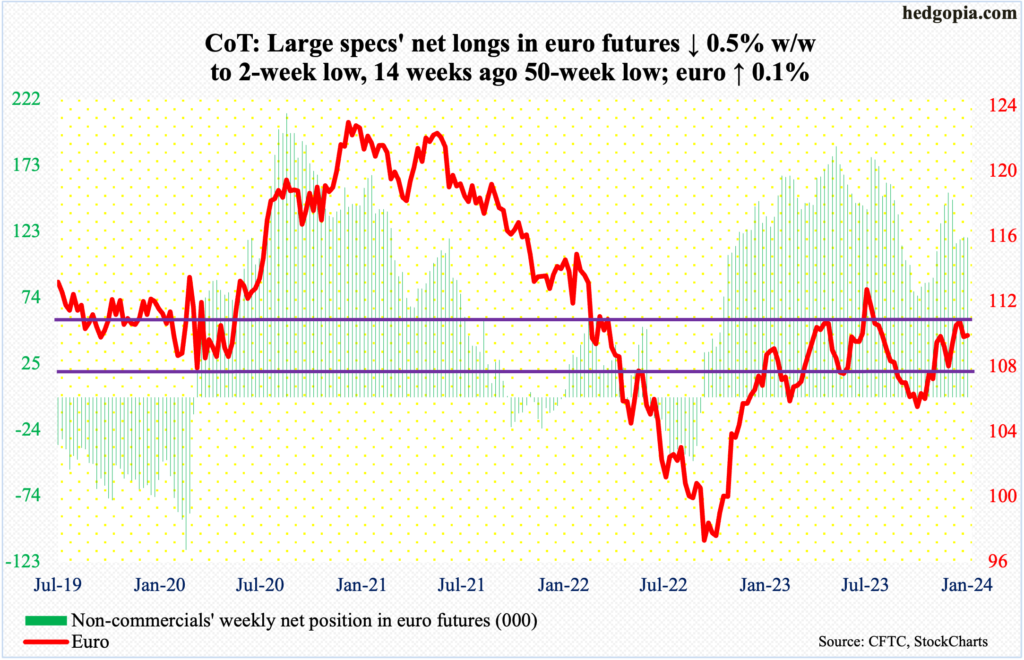
The euro tried to rally, touching $1.10 on Thursday, but again the bulls failed to keep the gains. In the end, the currency appreciated 0.1 percent this week to $1.0951, forming a weekly spinning top. This followed last week’s spinning top and a shooting star before that.
On December 27th, the euro tagged $1.1125, which marked the end of the rally that began on October 3rd at $1.0448. Before that, it came under pressure last July after ticking $1.1270.
Near-term notwithstanding, the weekly has room to go lower mid-term.
Gold: Currently net long 188.6k, down 19k.
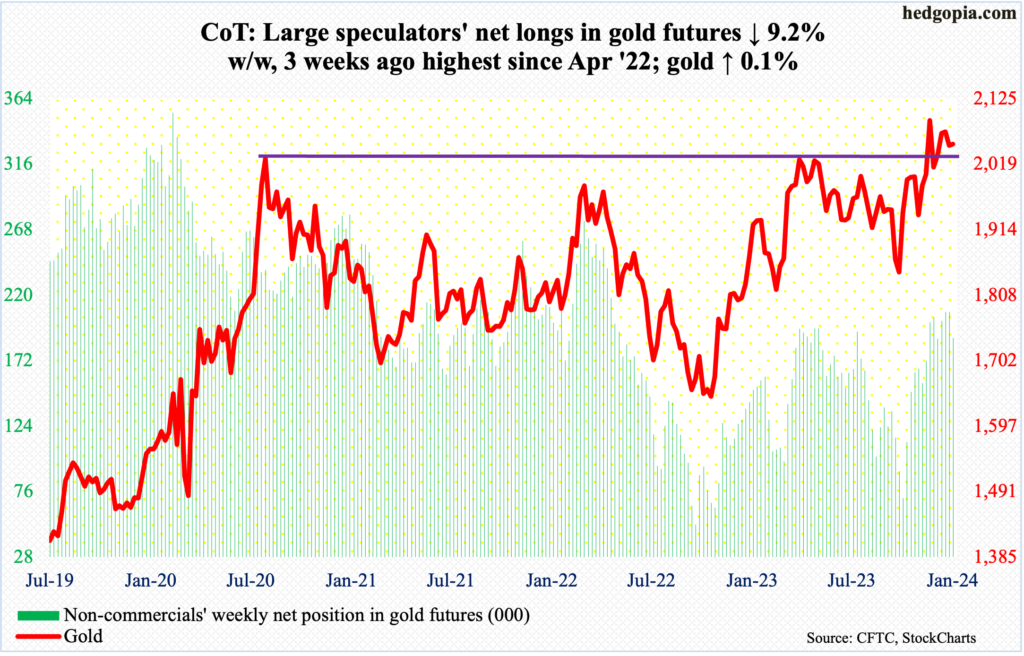
Gold bugs defended the 50-day ($2,023) this week. This follows rejection late last month at $2,080s. The daily is now in oversold territory, raising the odds the bulls will regroup to launch another attack. This has proven to be an important price point.
In August 2020, the metal posted a new all-time high of $2,089 and retreated. The reversal occurred again in March 2022 when it printed $2,079 and in May last year when $2,085 was tagged.
More recently, on December 4th, no sooner did gold break out of $2,080s than it quickly met with a nasty reversal, rising as high as $2,152 but only to close at $2,042. After that, bulls have gone after that several more times, but to no avail. Chances are they will meet the same fate near term, should they regroup and hammer on that ceiling.
It is looking more and more likely gold ($2,052/ounce) wants to head lower on the weekly.
Nasdaq 100 index (mini): Currently net long 36.8k, down 2.3k.
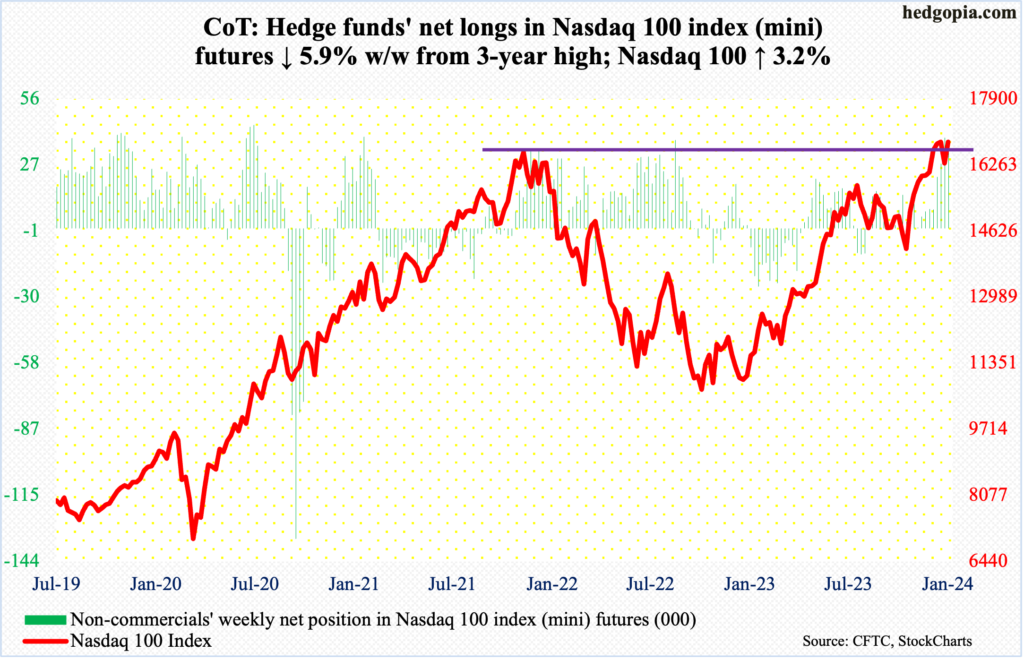
On December 28th, the Nasdaq 100 touched 16969 before heading lower. By then, the tech-heavy index had surpassed the November 2021 high of 16765. The minor selling that followed last month’s fresh high brought the index to 16249 by January 5th. After that, it has rallied in every session – five in total.
This week, the Nasdaq 100 jumped 3.2 percent to 16833, offsetting last week’s 3.1 percent decline. With this, the index is back at the December 28th high – just about. Tech bulls obviously are hoping for a breakout, even as non-commercials are staying with their net longs.
Should weakness develop as investors digest tech earnings (more on this here), nearest support lies at 16100s, with the sharply rising 50-day at 16123 and the July 2023 high at 15932.
Russell 2000 mini-index: Currently net long 21k, up 21.9k.
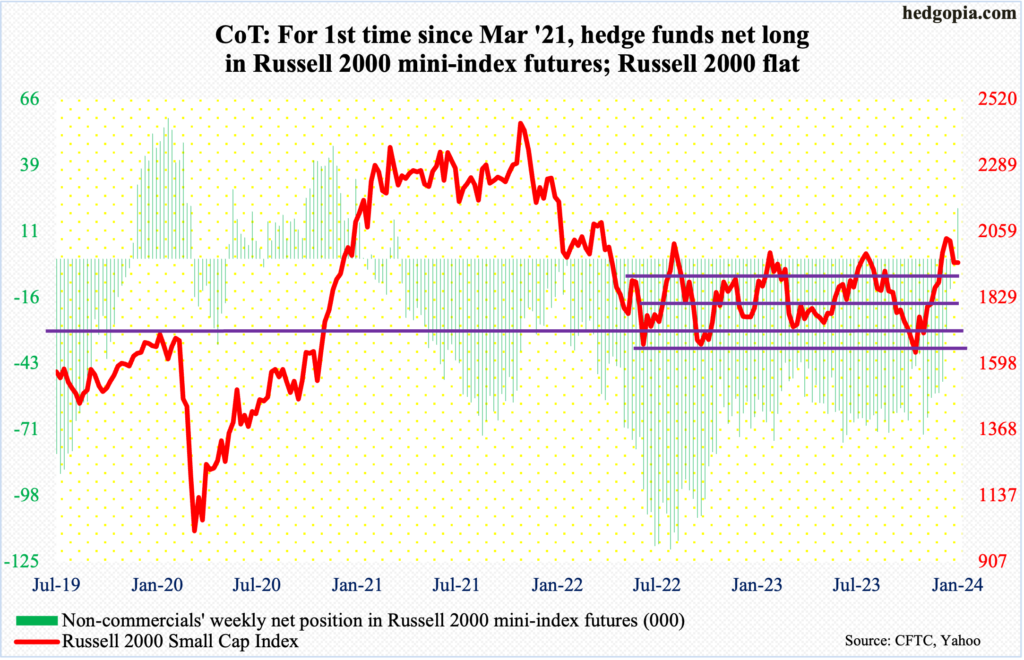
Having stayed net short uninterrupted for 146 weeks, non-commercials went net long Russell 2000 mini-index futures this week – the first time they have done so since March 2021.
Over exactly two months, the Russell 2000 went from 1634 (October 27th) to 2072 (December 27th). In the week to March 30, 2021, the index closed at 2196. So, directionally, these traders nailed it. Time will tell if they will be able to repeat the feat.
We know this much. The Russell 2000 did stage a potentially crucial breakout on December 13th – the day the FOMC made the dovish switch. The small cap index broke out of a 200-point range between 1900 and 1700, which had been in place since January last year. Even before that in October, 1640s, which was hit in 2022 in June and October, was defended. A measured-move target of the breakout stood at 2100, with the index rallying to 2072.
In due course, breakout retest at 1900 is the path of least resistance.
US Dollar Index: Currently net long 2.9k, up 487.
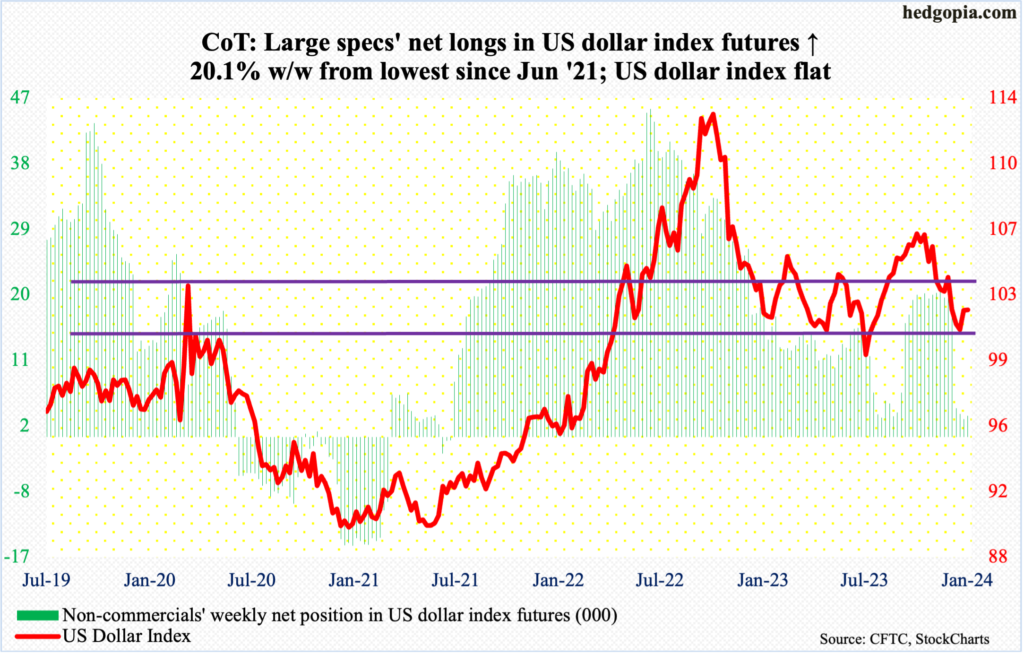
A fierce bull-bear duel is taking place at 100-101. In seven of the last eight sessions, the US dollar index was pushed under 102 intraday but only to close above. The sideways action follows a December 28th bottom at 100.32.
Earlier, the index peaked on October 3rd at 107.05 and began to really come under pressure early November. Post-Fed pivot on December 13th, it sliced through horizontal support at 103-104 as well as the 200-day. It remains under that average (103.21) as well as the 50-day (103.15), with a death cross completing on Friday.
The daily has room to come under pressure. But, provided 100-101 stays intact, the weekly favors the bulls.
VIX: Currently net short 44.2k, down 823.
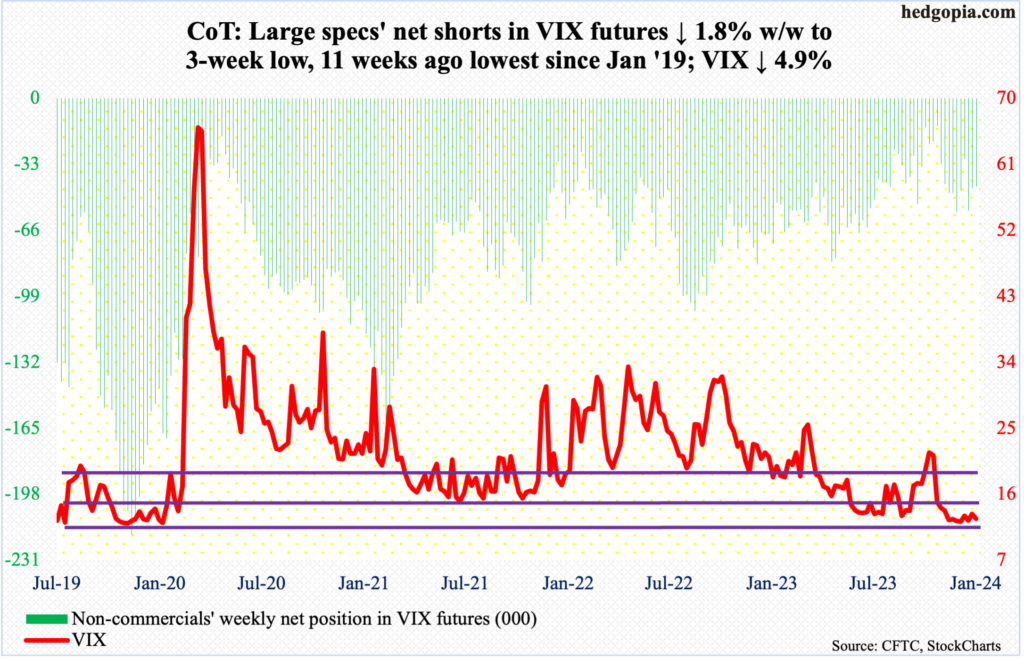
In six of the last eight weeks, including this week, VIX closed sub-13, with the other two closing just north of 13. The S&P 500 during the period rallied nearly 300 points. Volatility is holding its ground at 12-13, not falling apart. This is good news for volatility bulls. The problem for them is that any rally attempts are cut short quickly. This week’s high was set on Monday at 14.18. This was preceded by the preceding Friday’s weekly high of 14.58. This week, VIX closed at 12.70, with Thursday’s low of 12.35.
Amidst this, shorter-term averages are no longer dropping. They are flattish to slightly up. The 50-day is still dropping, with early signs of wanting to go sideways. These averages need to behave should the weekly begin to unwind its oversold condition.
Thanks for reading!
