
Following futures positions of non-commercials are as of January 16, 2024.
10-year note: Currently net short 889.4k, up 102.4k.
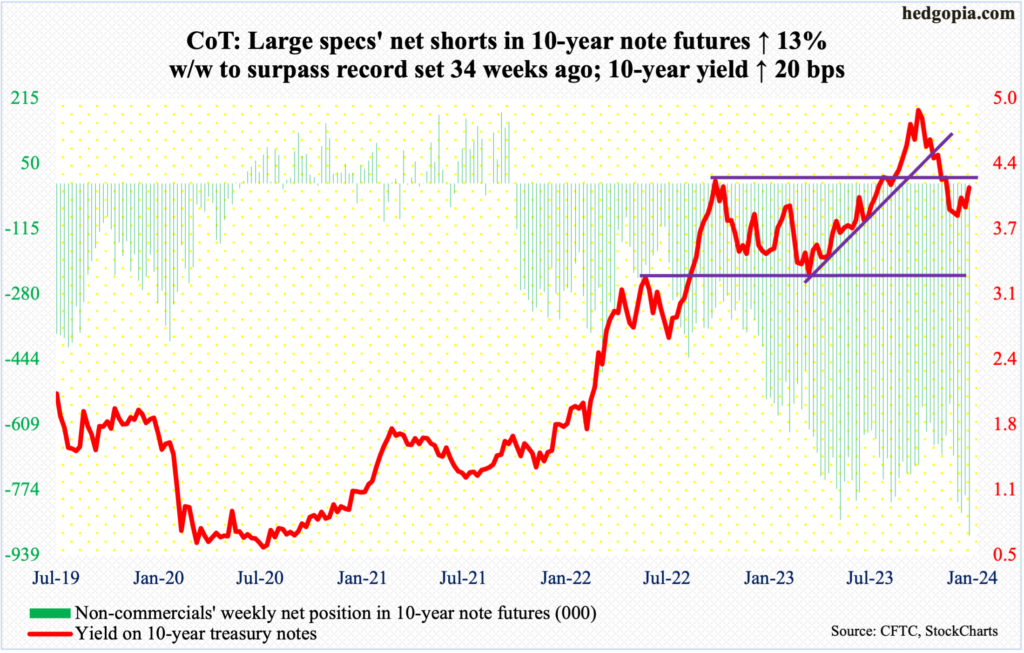
At an annualized $709.9 billion, December’s retail sales were strong, better than expected and set a record. January’s preliminary count showed the University of Michigan’s consumer sentiment index jumped 9.1 points from December – up 17.5 points from November. Both consumer spending and sentiment is buoyant. From last October’s bottom, US stocks have rallied big, with the S&P 500 up nearly 18 percent, adding trillions in wealth.
Consumer inflation is a lot lower from the four-decade highs of 2022 but remains above the Federal Reserve’s two percent goal. The central bank, after having raised the fed funds rate from a range of zero to 25 basis points to the current 525 basis points to 550 basis points since March 2022, aims to begin easing this year, but wants to make sure inflation does not resurge. At the December meeting, the FOMC dot plot suggested three 25-basis-point cuts this year. Markets habitually want more.
In the futures market, after this week’s solid economic numbers, traders no longer expect a cut in March. They nevertheless expect five cuts this year, ending 2024 between 400 basis points and 425 basis points. Until just recently, they were pricing in six cuts.
In the meantime, FOMC members keep reminding these traders that interest-rate cuts are hardly around the corner. This week, this included Mary Daly, San Francisco Fed president, Raphael Bostic, Atlanta Fed president, and Christopher Waller, one of seven governors who always vote. This year, both Daly and Bostic are voting members. Last week, John Williams, president of New York Fed, which has a permanent voting status, said it is still too soon to call for rate cuts as inflation remains above two percent.
The message to futures traders is clear, which is to ratchet their unrealistic expectations down. They are fighting a battle they cannot win with the Fed.
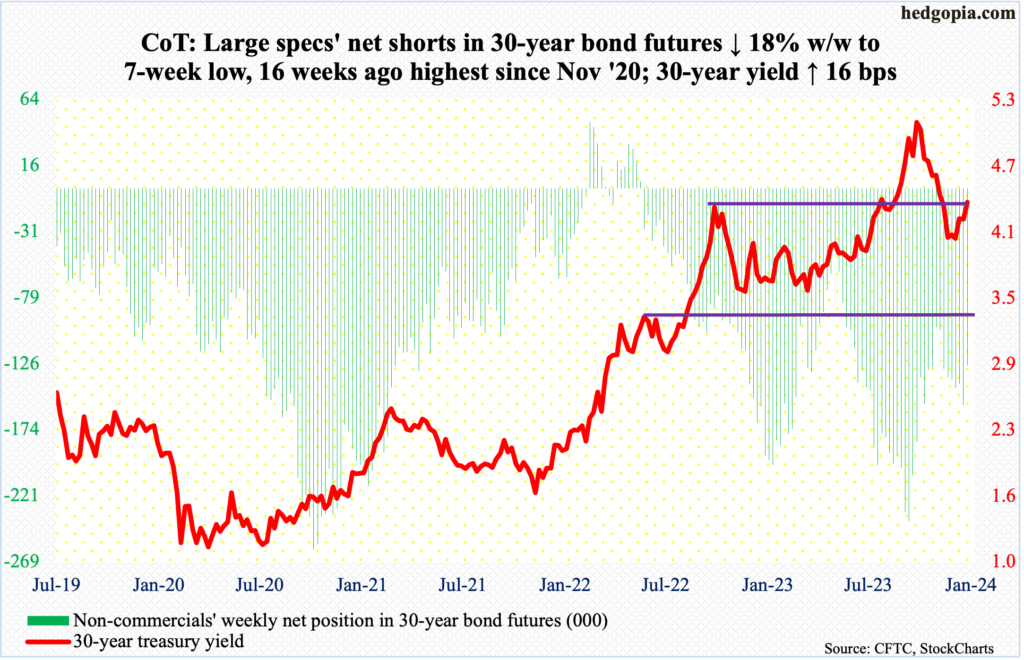
30-year bond: Currently net short 127.8k, down 28k.
Major US economic releases for next week are as follows.
On Thursday, GDP (4Q23, first estimate), durable goods orders (December) and new home sales (December) are on tap.
In the September quarter, real GDP expanded at an annual rate of 4.9 percent, which was the best showing in seven quarters. The Atlanta Fed’s GDPNow model is forecasting growth of 2.4 percent in the December quarter.
Orders for non-defense capital goods ex-aircraft – proxy for business capex plans – increased 0.8 percent month-over-month in November to a seasonally adjusted annual rate of $74 billion, which set a record.
November sales of new homes tumbled 12.2 percent m/m to 590,000 units (SAAR) – a one-year low. Last July’s 728,000 was the highest since February 2022.
Friday brings personal income/spending (December). In the 12 months to November, headline and core PCE (personal consumption expenditures) respectively rose 2.6 percent and 3.2 percent. They respectively peaked at four-decade highs in 2022 at 7.1 percent (June) and 5.6 percent (February). The Fed targets two percent on core PCE.
WTI crude oil: Currently net long 172.1k, down 10.6k.
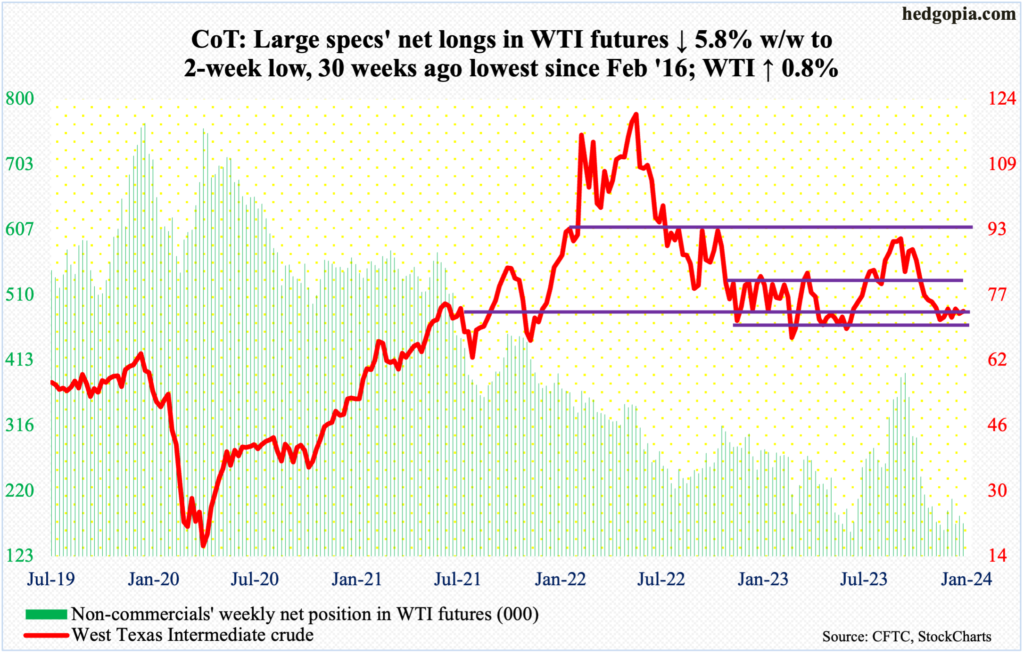
West Texas Intermediate crude produced a back-to-back weekly spinning top. The crude was up 0.8 percent this week to $73.25/barrel, having gone essentially sideways for seven weeks now, during which it spent most of its time around the low end of a 13-month range between $71-$72 and $81-$82.
Amidst this, the daily Bollinger bands are tightening. This tends to occur when the price is coiling to break – either up or down. Oil bulls should be given the benefit of the doubt as long as $67 holds. WTI peaked last September at $95.03, having rallied from last June’s low of $67.05. On December 13th, it ticked $67.71 intraday before bottoming.
In the meantime, as per the EIA, US crude production in the week to January 12th grew 100,000 barrels per day week-over-week to 13.3 million b/d, matching a record set in December. Crude imports increased 1.2 mb/d to 7.4 mb/d. Stocks of gasoline and distillates grew as well – respectively up 3.1 million barrels and 2.4 million barrels to 248.1 million barrels and 134.8 million barrels. Crude inventory, however, fell 2.5 million barrels to 429.9 million barrels. Refinery utilization was down three-tenths of a percentage point to 92.6 percent.
E-mini S&P 500: Currently net short 169.2k, up 52.2k.
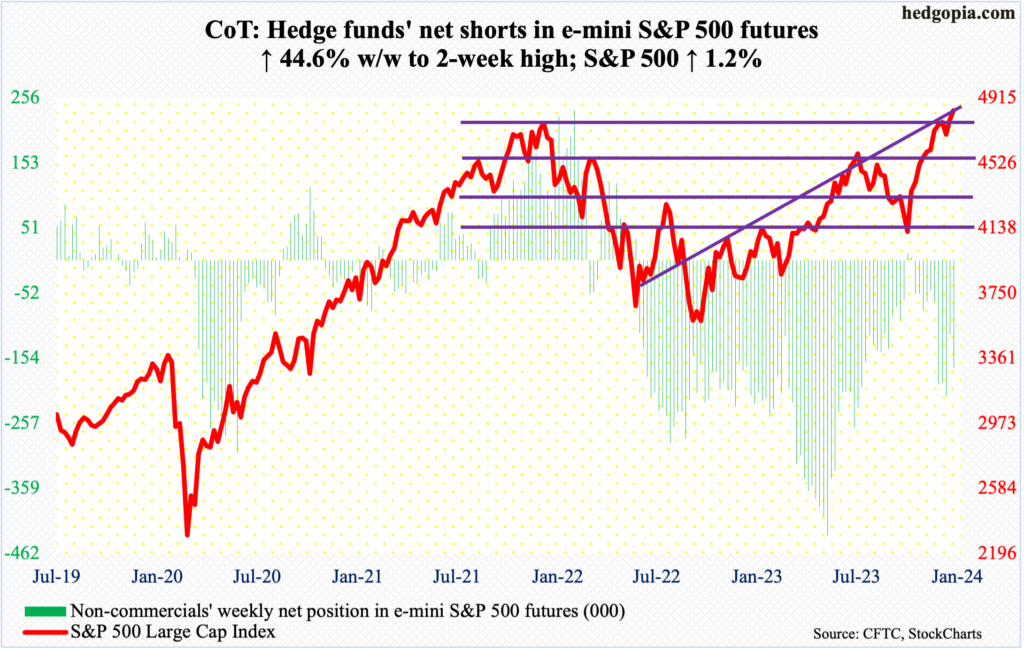
Finally, it broke free. The S&P 500 had been held down by 4800 since late December. Come Friday, not only did the large cap index take the level out but also broke out to a new high; ticking 4842 intraday, the session closed at 4840 – past the prior high of 4819 posted in January 2022.
This essentially completes a round trip that took two whole years. If the breakout is real, it has the potential to be significant. But it is too soon to conclude that, with tech leading the way and small-caps noticeably falling behind this week.
Nevertheless, equity bulls now have the S&P 500 joining the likes of the Dow Industrials and Nasdaq Composite/Nasdaq 100, which already posted new highs.
For now, more gains probably lie ahead.
Euro: Currently net long 104.1k, down 14.8k.
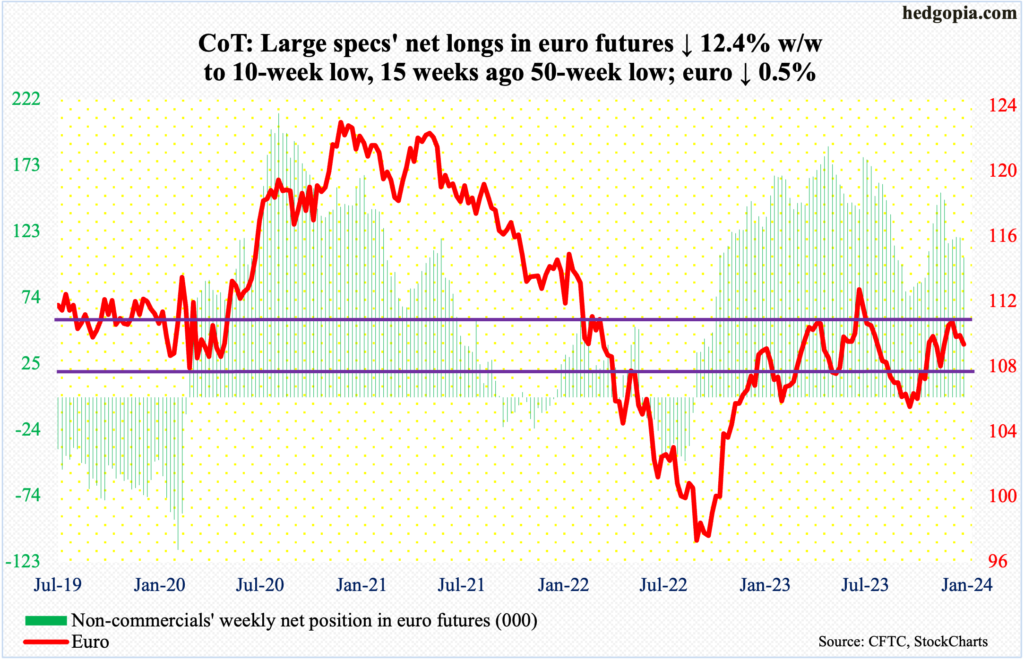
The euro, down 0.5 percent to $1.0897 this week, suffered its third consecutive weekly spinning top. Before that, the currency formed a shooting star on the weekly, which was when it tagged $1.1125 on December 27th, marking the end of the rally that began on October 3rd at $1.0448. Before that, it came under pressure last July after ticking $1.1270.
On both Wednesday and Thursday, the 200-day ($1.0849) was defended, ending Friday essentially at the 50-day ($1.0896). The daily is itching to rally.
Gold: Currently net long 179.9k, down 8.7k.
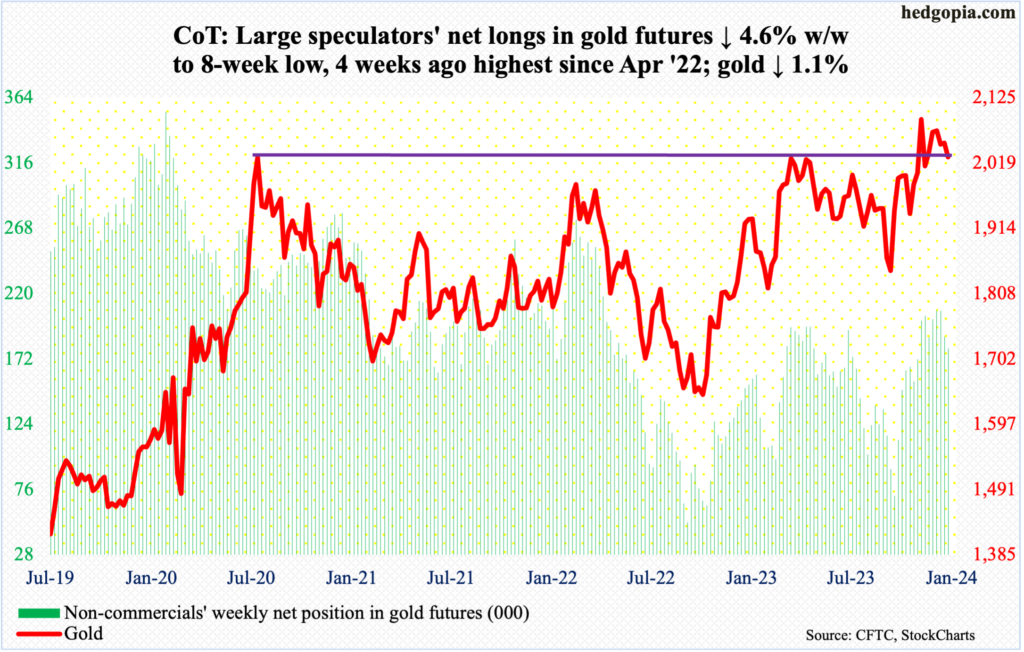
Non-commercials are beginning to cut down their net longs in gold futures. They held 207,718 contracts in the week to December 26th. This week, holdings stood at 179,893, which remains sizable.
Earlier, gold rose as high as $2,152 on December 4th but only to close at $2,042; the intraday reversal meant resistance at $2,080s held firm. This has proven to be an important price point. In August 2020, the metal posted a new all-time high of $2,089 and retreated. The reversal occurred again in March 2022 when it printed $2,079 and in May last year when $2,085 was tagged, followed by rejection late last month and early this month.
This week, the metal shed 1.1 percent to $2,029. The weekly has room to continue lower, although gold bugs can take advantage of the daily oversold conditions in the near term.
Nasdaq 100 index (mini): Currently net long 36.6k, down 205.
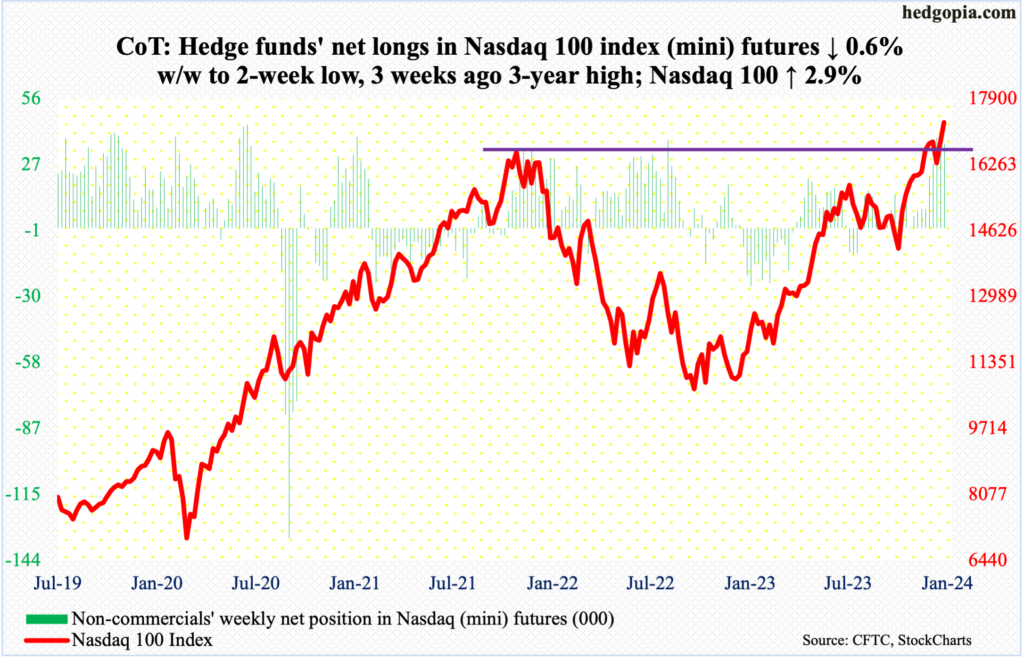
Tech enjoyed yet another powerful week propelled by semis, with SMH (VanEck Vectors Semiconductor ETF) surging 8.2 percent, even as the Nasdaq 100 jumped 2.9 percent. This is occurring as the major US tech outfits get ready to report their December quarter. Microsoft (MSFT), Apple (AAPL), Google owner Alphabet (GOOG), Amazon (AMZN), Facebook owner Meta (META) all report the week of 29th, which is the week after; Tesla (TSLA) reports on the 24th.
Ahead of this, having already surpassed the November 2021 high of 16765 on December 19th, the Nasdaq 100 pulled off a mini-breakout on Friday, posting a new intraday high of 17317, closing at 17314.
Earnings better come through. There is a lot already priced in. From last October’s low, the Nasdaq 100 is up 18.8 percent and an astounding 65.8 percent from the October 2022 low.
Russell 2000 mini-index: Currently net long 14.2k, down 6.8k.
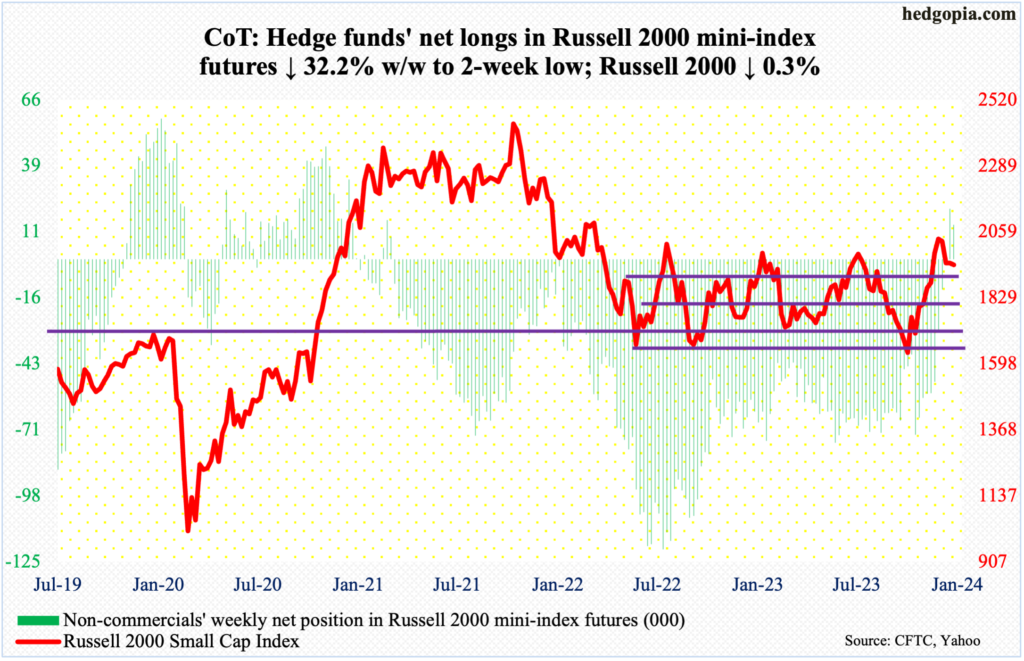
Small-caps continue to be a show-me story.
The Russell 2000 is nowhere near its all-time high of 2459 from November 2021. The small cap index caused a lot of excitement on December 13th when it broke out of a 200-point range between 1900 and 1700, which had been in place since January last year. A measured-move target of the breakout stood at 2100, with the index reaching 2072 on December 27th and pulling back. On both Wednesday and Thursday this week, 1900 was tested – so far successfully, with the index ending at 1944, down 0.3 percent for the week.
Last week, having stayed net short uninterrupted for 146 weeks, non-commercials switched to net long Russell 2000 mini-index futures. This week, they cut their exposure, although they remain net long.
US Dollar Index: Currently net long 1.3k, down 1.6k.
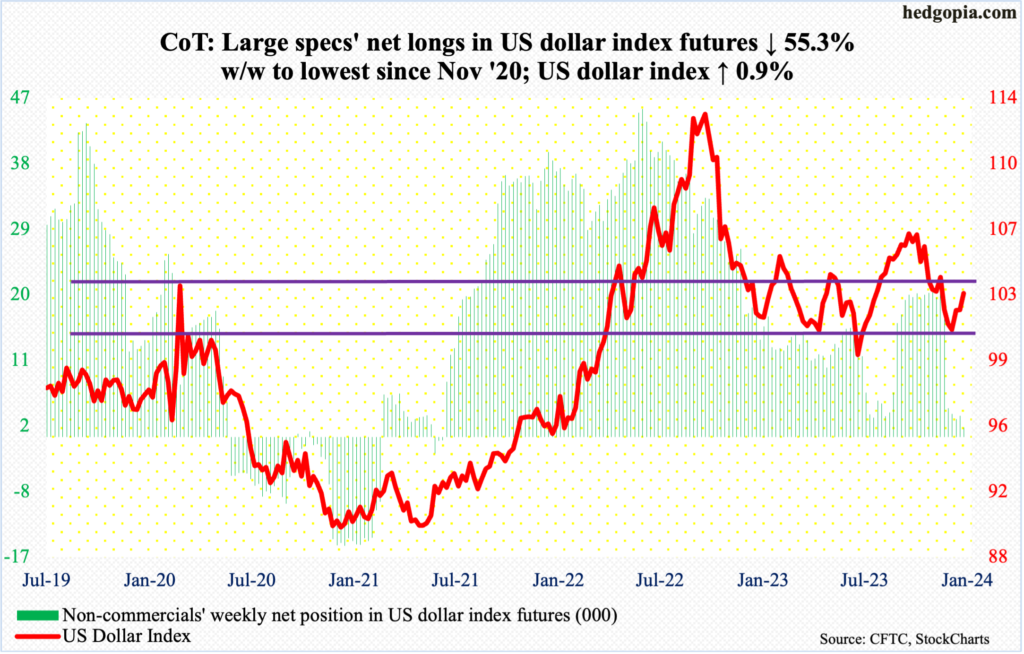
This week’s 0.9-percent rise was a third consecutive up week. Four weeks ago, the US dollar index bottomed at 100.32 on December 28th.
Before that, the index peaked on October 3rd at 107.05 and began to really come under pressure early November. Post-Fed pivot on December 13th, it sliced through horizontal support at 103-104 as well as the 200-day. It is currently trapped between the average (103.24) and the 50-day (102.93). throughout this week, the index went after the 200-day and was denied. Odds favor a breach of the 50-day in the sessions ahead.
VIX: Currently net short 43.8k, down 409.
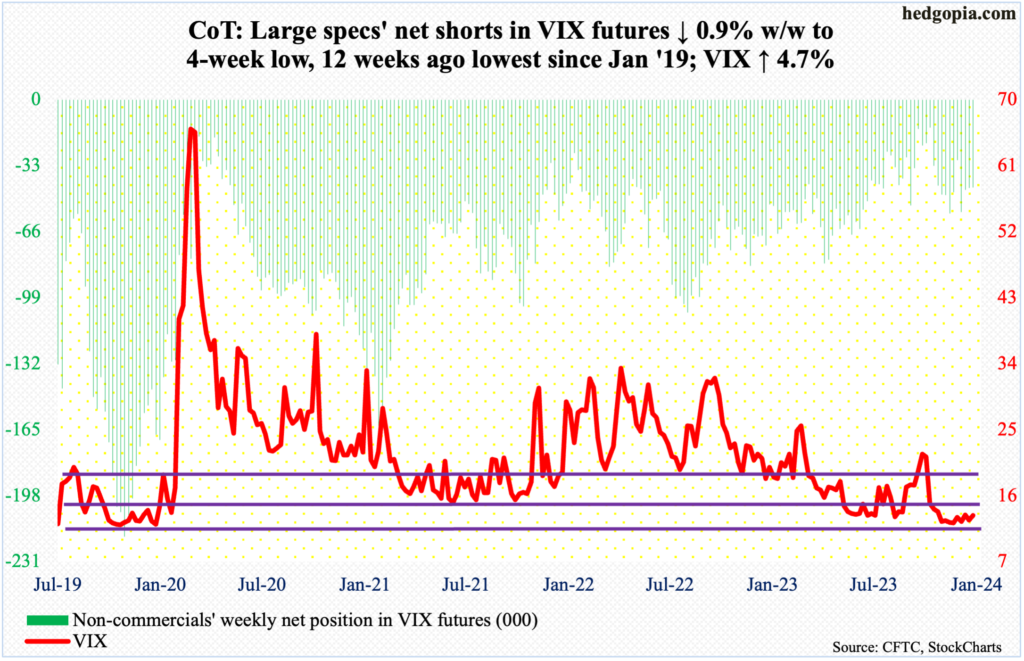
It was one of those weeks when both VIX and the S&P 500 went hand in hand. The volatility index added 0.60 points to 13.30 this week, while the S&P 500 rallied 1.2 percent.
Interestingly, since tagging 11.81 on December 12th, VIX has quietly made higher lows. From volatility bulls’ perspective, the problem is that they have been unable to hang on to the gains. This Wednesday, VIX rallied as high as 15.40 – just under the 200-day (15.45) – but only to then leave an upper wick on the candle.
In the sessions ahead, volatility is likely to compress.
Thanks for reading!
