
Following futures positions of non-commercials are as of March 26, 2024.
10-year note: Currently net short 578.3k, up 4.3k.
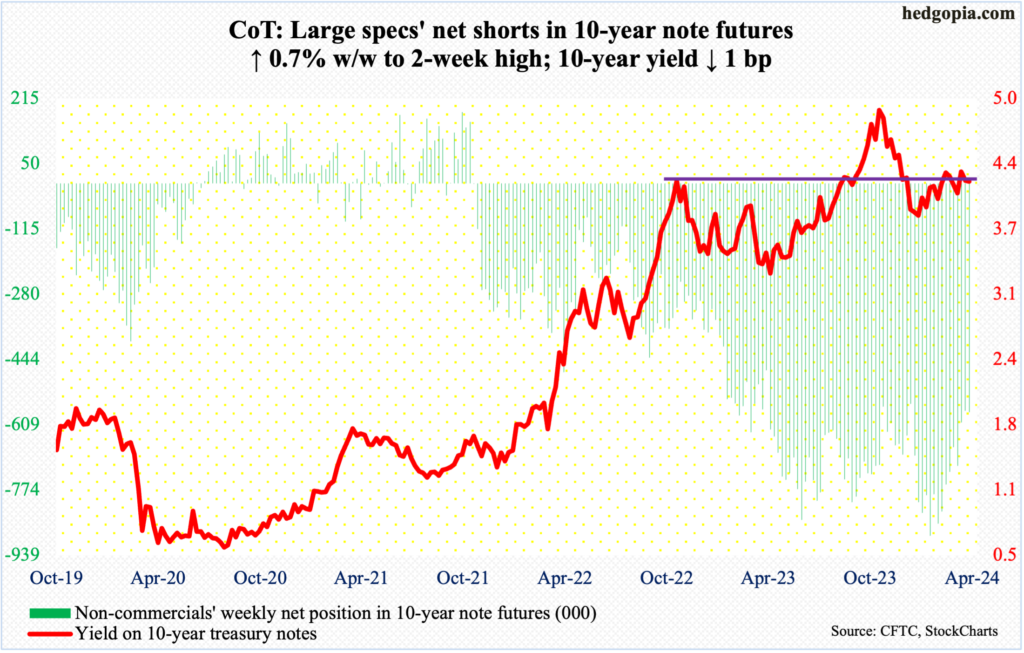
Well, looks like a battle of sorts is brewing within the FOMC.
Recent commentary from Federal Reserve Chair Jerome Powell has leaned dovish. And then there are policymakers such as Christopher Waller, governor, who on Wednesday said he is in no hurry to cut rates considering inflation was hot in the first two months of the year. Raphael Bostic, Atlanta Fed president, who votes this year, the week before said he only expects one cut this year.
February’s PCE (personal consumption expenditures) prince index was reported on Friday. Core PCE, which is the Fed’s preferred measure of consumer inflation, grew at an annual rate of 2.8 percent last month. Two years ago, it was growing at a four-decade high of 5.6 percent. Inflation is indeed falling, although with signs of stickiness in recent months. The central bank has a two percent objective.
In a speech on Friday – post-PCE – Powell said the FOMC members need to see further evidence before they would cut rates.
As things stand, futures traders have priced in the first cut of the cycle to take place in June, with two additional cuts by December. Until not too long ago, they were expecting six to seven cuts this year. As time went on, they were forced to adjust their expectations down and may not be done doing so.
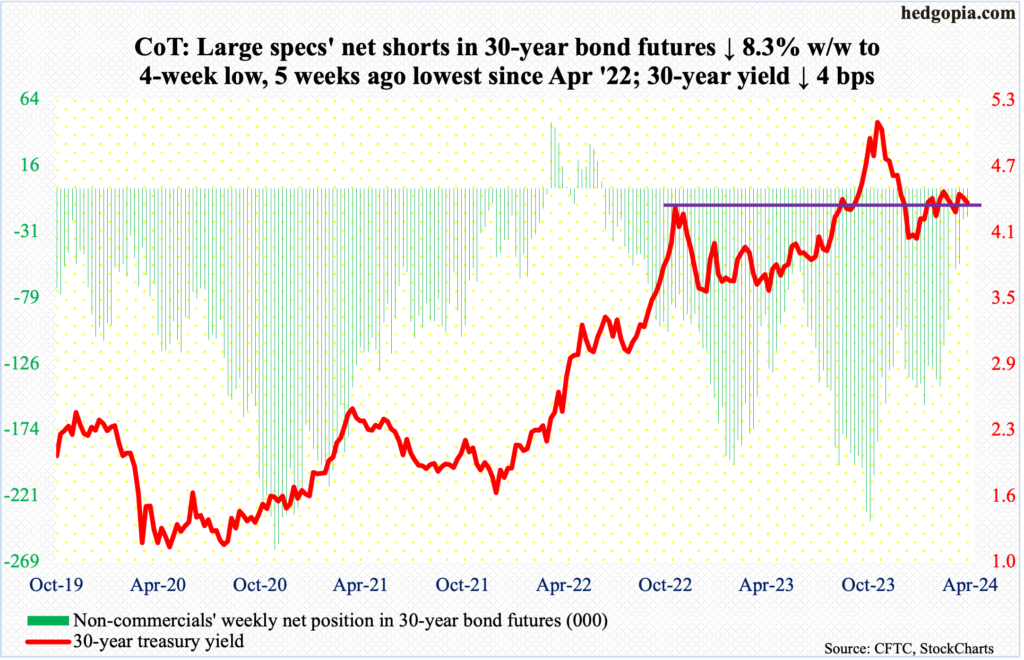
30-year bond: Currently net short 20.6k, down 1.9k.
Major US economic releases for next week are as follows.
The ISM manufacturing index (March) is scheduled for Monday. In February, manufacturing activity dropped 1.3 percentage points month-over-month to 47.8 percent. This was the 16th consecutive month of contraction.
Durable goods orders (February, revised) and JOLTs job openings (February) are due out Tuesday.
Orders for non-defense capital goods ex-aircraft – proxy for business capex plans – grew 0.6 percent m/m in February to a seasonally adjusted annual rate of $73.9 billion. The metric reached its all-time high of $74 billion last November.
Non-farm job openings edged lower 26,000 m/m in January to 8.9 million. Openings peaked in March 2022 at 12.2 million.
The ISM services index will be reported on Wednesday. Non-manufacturing activity fell eight-tenths of a percentage point m/m in February to 52.6 percent. After a sub-50 reading in December 2022, the economy has been in expansion mode for 14 consecutive months.
Friday brings payrolls (March). In February, the economy created 275,000 non-farm jobs, for a monthly average this year of 252,000, which is in line with the monthly average last year of 251,000 but much lower than the 2022 average of 377,000 and the 2021 average of 604,000.
WTI crude oil: Currently net long 322.5k, down 14.6k.
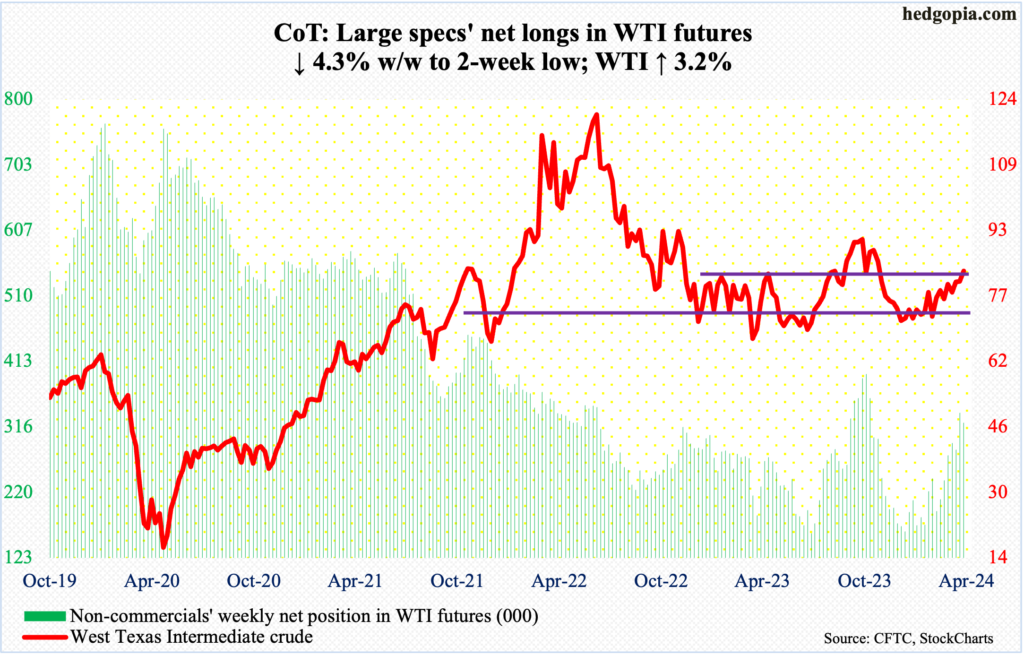
Bulls were in no mood to let last week’s potentially bearish weekly gravestone doji dictate things. The candle was not confirmed this week, as West Texas Intermediate crude jumped 3.2 percent to produce a weekly bullish marubozu, ending at $83.17/barrel, with the intra-week high of $83.21 just ahead of last week’s high of $83.12.
In the meantime, this is also the first time since last November that the crude decisively closed above the upper end of an 18-month range between $71-$72 and $81-$82.
WTI has come a long way since bottoming at $67.71 last December. Conditions are overbought, but, as things stand, oil bulls are back into the saddle.
In the meantime, as per the EIA, US crude production in the week to March 22nd was unchanged week-over-week at 13.1 million barrels per day; a month ago, output was at a record 13.3 mb/d. Crude imports increased 424,000 b/d to 6.7 mb/d. As did stocks of crude and gasoline, which respectively grew 3.2 million barrels and 1.3 million barrels to 448.2 million barrels and 232.1 million barrels. Distillate inventory, however, decreased 1.2 million barrels to 117.3 million barrels. Refinery utilization increased nine-tenths of a percentage point to 88.7 percent.
E-mini S&P 500: Currently net short 169.4k, down 24.7k.
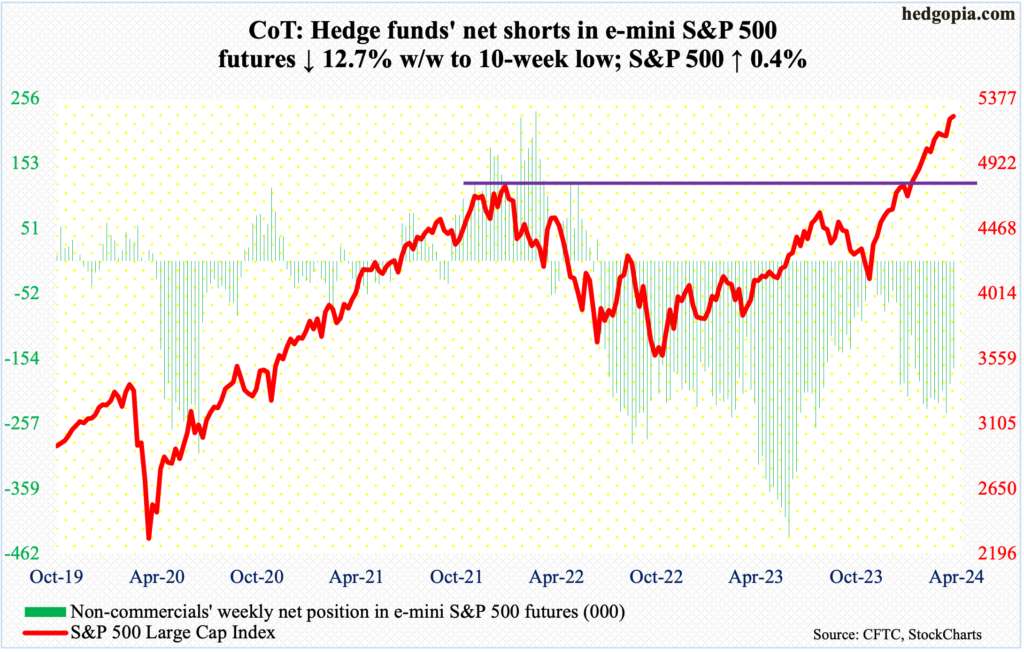
Yet another week and yet another high! Up 0.4 percent this week, Thursday saw the S&P 500 post a new intraday high of 5265, with a weekly close of 5254.
This follows equity bears’ inability last week to take advantage of back-to-back weekly candles with long upper shadows – one a spinning top and the other nearly a gravestone doji. These potentially bearish candles did not confirm as the bulls pressed on. A rising trend line from last October was also defended last week (more on this here).
The large cap index has now rallied in 18 of the last 22 weeks. From the low of last October through Thursday’s high, it added 28.3 percent. Not surprisingly, conditions are overbought. The last time the weekly RSI at 79 was as overbought was January 2020, when the index peaked the next month for a sharp five-week drop.
Euro: Currently net long 31.2k, down 17.1k.
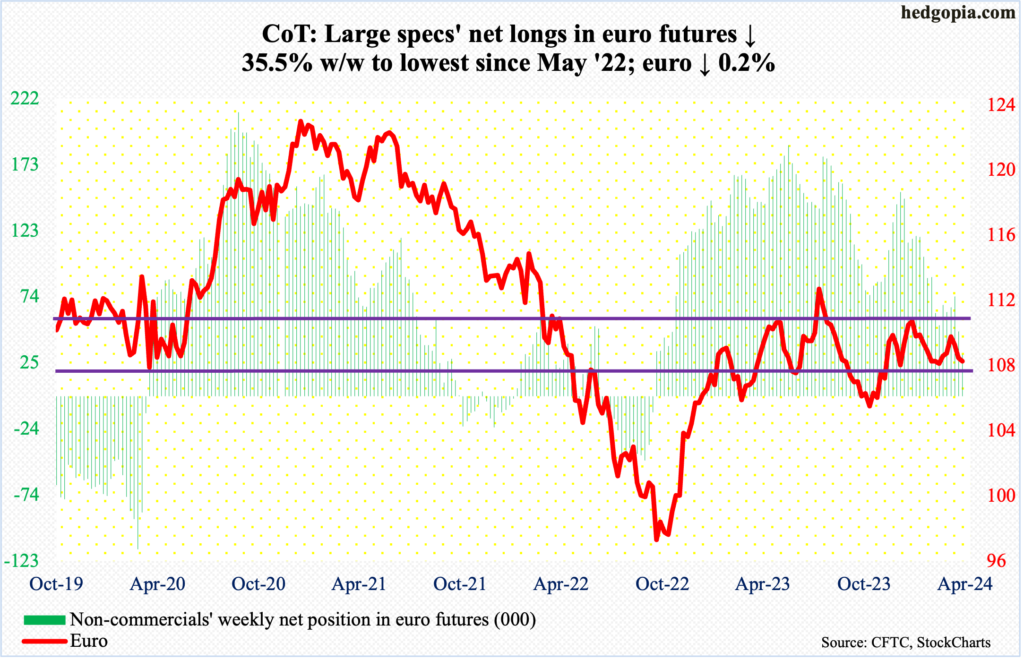
The euro suffered its third consecutive down week – down 0.2 percent this week to $1.0788. The currency has trended lower since ticking $1.0981 on March 8th. There is horizontal resistance at $1.10.
This week, euro bulls’ attempts to reclaim the 50- and 200-day moving averages ($1.0836 each, hence the risk of a death cross going forward) failed on Monday through Wednesday, with Thursday just about landing on the daily lower Bollinger band.
The daily is in oversold territory. The February 13th low of $1.0701 has gained in significance.
Gold: Currently net long 199.3k, down 2.3k.
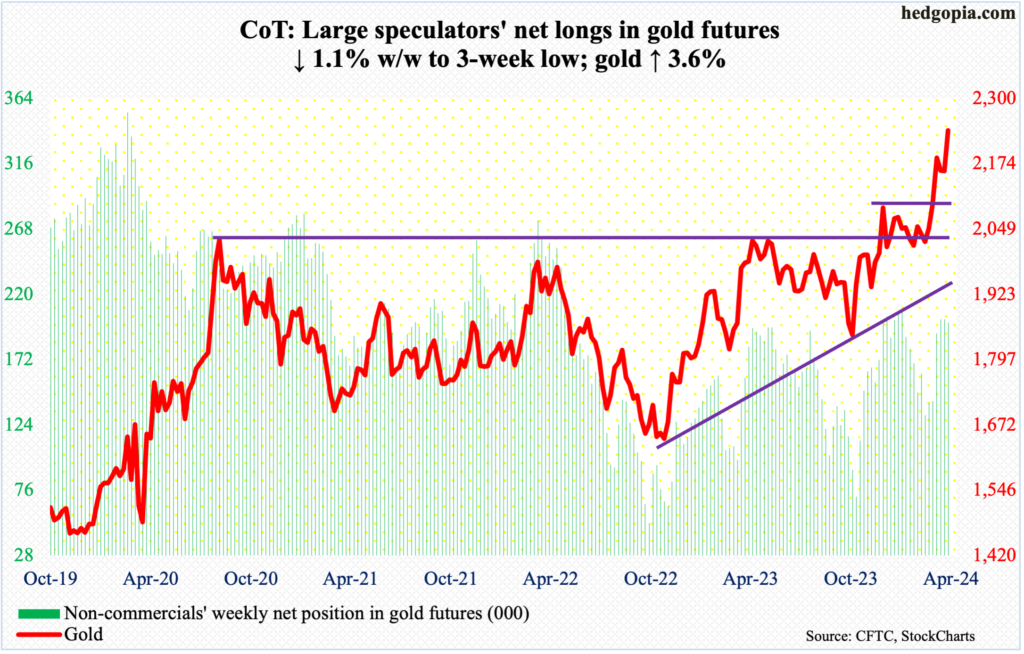
In a holiday-shortened week, gold rallied in all four sessions. By Friday, it surpassed the March 25th high of $2,225 to rally 3.6 percent for the week to $2,238, with the metal ticking $2,247/ounce. Last week’s potentially bearish gravestone doji has been negated.
Monday’s intraday low of $2,164 came just above horizontal support at $2,150s, which was the high from early December. The yellow metal has come a long way from last October when it bottomed at $1,824.
At some point, successful breakout retest at $2,080s is the path of least resistance – and probably healthy for gold bugs. Since August 2020, when $2,080s was hit the first time, rally attempts stopped at that price point several more times, including in March 2022 ($2,079), May last year ($2,085) and a few more times this year. The 50-day has now risen to $2,089.
Nasdaq (mini): Currently net short 7.1k, up 18.3k.
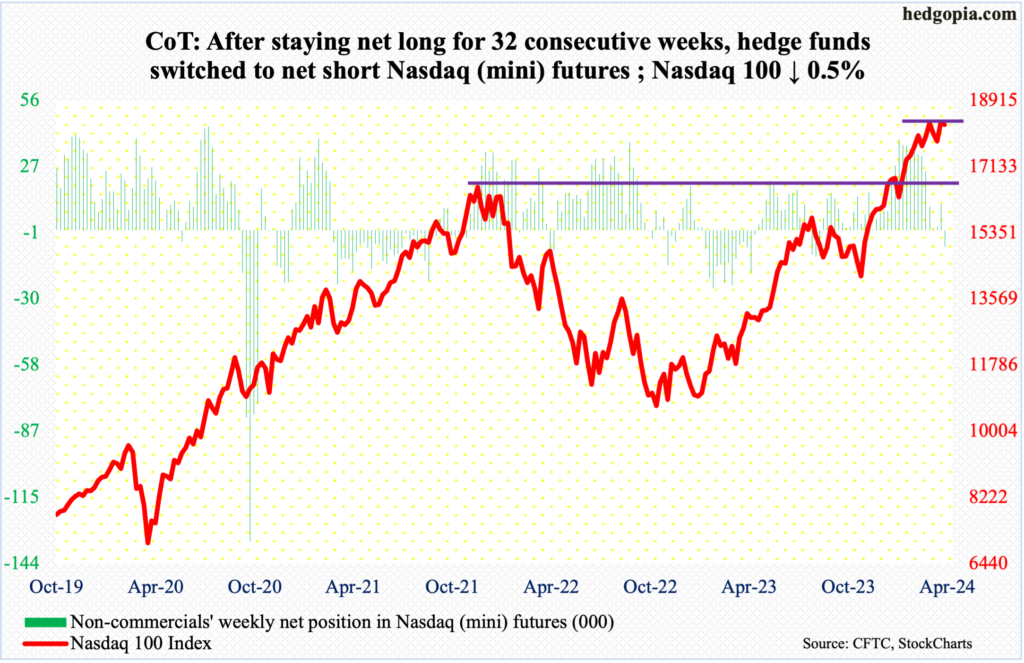
Non-commercials have switched to net short. They had been net long since last August. This comes on the heels of the Nasdaq 100 pretty much marking time in March. Yes, the tech-heavy index rallied 1.2 percent in March but began the month by tagging 18333 on the 1st. This week, it dropped 0.5 percent to 18254, with a new intraday high of 18465 on the 21st.
Immediately ahead, there is short-term horizontal support at 18000. Just underneath lies the 50-day (17835), which coincides with the daily lower Bollinger band (17824).
Russell 2000 mini-index: Currently net short 21.5k, up 8.1k.
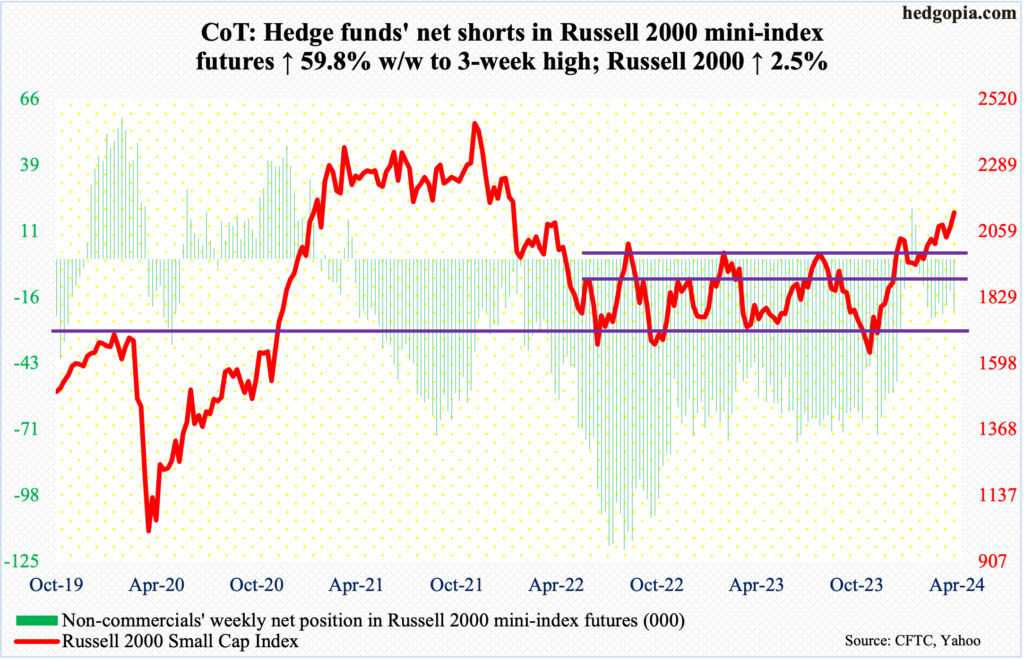
Bulls managed to pull off what they have had trouble achieving the past two years. The Russell 2000 closed the week above 2100, tagging 2135 on Thursday and ending at 2125, up 2.5 percent for the week. In March 2022, the index touched 2138 and headed lower. Small-cap bulls obviously hope things do not end similarly this time around.
In fact, horizontal resistance at 2100 goes back to January 2021. This level also represents a measured-move target of a 1700-1900 range breakout on December 13th. Closing above this level could potentially act as a morale-booster. In the end, it all boils down to flows. It remains to be seen if this week’s action helps draw in new funds.
US Dollar Index: Currently net short 629, up 1.3k.
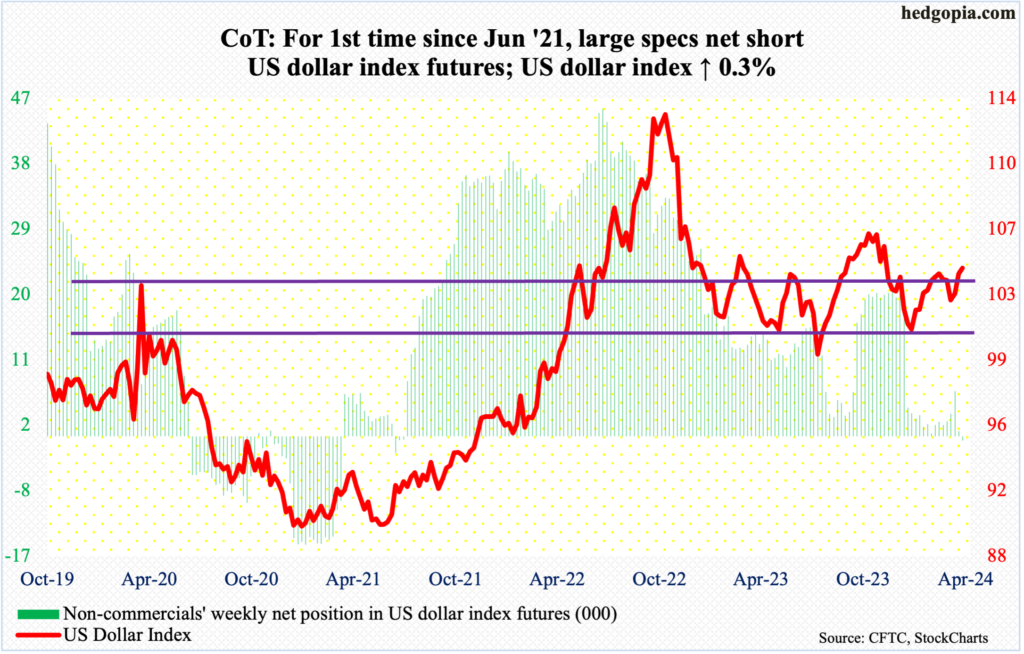
Up 0.3 percent this week, the US Dollar Index enjoyed its third consecutive up week. Earlier, it bottomed at 102.30 on March 8th. This week, dollar bulls failed to cling on to Friday’s intraday high of 104.67, closing at 104.49.
Resistance at 103-104 goes back to December 2016. Closing above this level should give the edge to the bulls. With that said, technical conditions are getting extended here.
In the meantime, for the first time since June 2021, non-commercials have switched to net short.
VIX: Currently net short 43.9k, down 888.
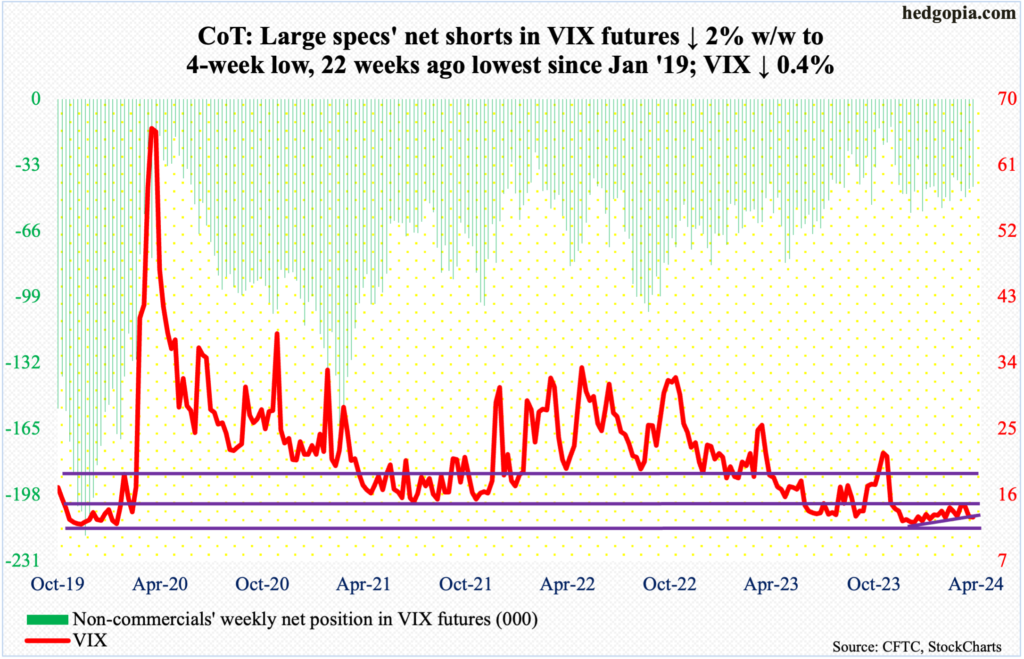
Last week, a rising trend line from December 12th when VIX bottomed at 11.81 was breached. This week, Monday’s rally attempt in which the volatility index touched 13.57 was faded, followed by the trend line providing resistance on Tuesday and Wednesday.
In the event volatility comes under more pressure in the sessions ahead, the March 21st bullish hammer during which VIX ticked 12.40 intraday is worth watching.
Thanks for reading!
