Following futures positions of non-commercials are as of May 7, 2024.
10-year note: Currently net short 481.6k, up 48.7k.

Non-commercials continued to add to net shorts in 10-year note futures. As of Tuesday, holdings closed at 481,620 contracts, up from 353,920 as of April 23rd. Earlier, net shorts peaked at 889,385 as of January 16th.
If these traders are positioning themselves for a rally in the 10-year yield, odds are in their favor in the near term.
The 10-year, after dropping to 4.42 percent on Tuesday, closed out the week at 4.50 percent – essentially unchanged for the week. The 50- and 200-day moving averages lie underneath at 4.40 percent and 4.33 percent respectively.
The rates touched five percent last October before dropping to 3.79 percent in December. In the subsequent rally, the 10-year ticked 4.74 percent on April 24th and headed south. Before last month’s high could be tested, there is short-term resistance at 4.57 percent.
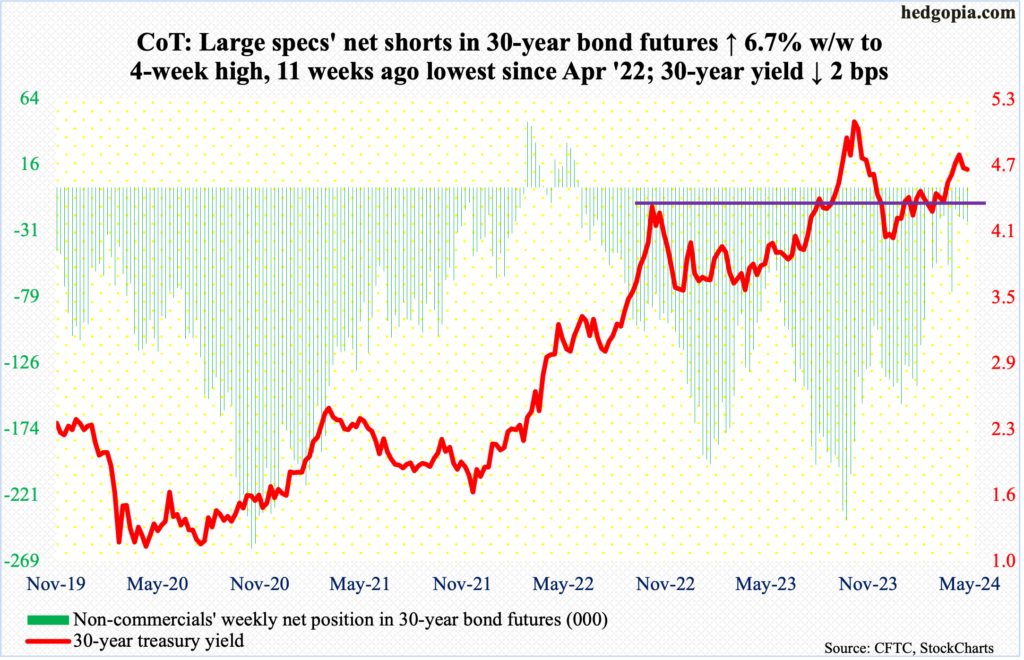
30-year bond: Currently net short 24.7k, up 1.6k.
Major US economic releases for next week are as follows.
The NFIB optimism index (April) and the producer price index (April) are due out Tuesday.
Small-business job openings were unchanged month-over-month in March at 37. This was a 38-month low.
Headline and core wholesale prices increased 2.1 percent and 2.8 percent year-over-year in March, with the former at an 11-month high and the latter matching last October’s reading.
Wednesday brings the consumer price index (April), retail sales (April) and the NAHB housing market index (May).
In the 12 months to March, headline and core CPI rose 3.48 percent and 3.80 percent respectively. They have come down from four-decade highs of 9.06 percent and 6.63 percent in June and September of 2022, in that order, but have gone sideways to up in recent months, with the headline registering 3.09 percent in January and the core 3.75 percent in February this year.
Retail sales firmed up 0.7 percent m/m in March to a seasonally adjusted annual rate of $709.6 billion – a new high.
Homebuilder optimism in April was unchanged m/m at 51, which is the highest reading since last July. In December 2022, optimism hit a low of 31.
Housing starts (April) and industrial production (April) are scheduled for Thursday.
March starts tumbled 14.7 percent m/m to 1.32 million units (SAAR) – a seven-month low.
Capacity utilization grew 0.3 percent m/m in March to 78.4 percent. After peaking at 80.8 percent in September 2022, utilization reached a 28-month low of 77.9 percent this January before rising.
WTI crude oil: Currently net long 214k, down 45.7k.
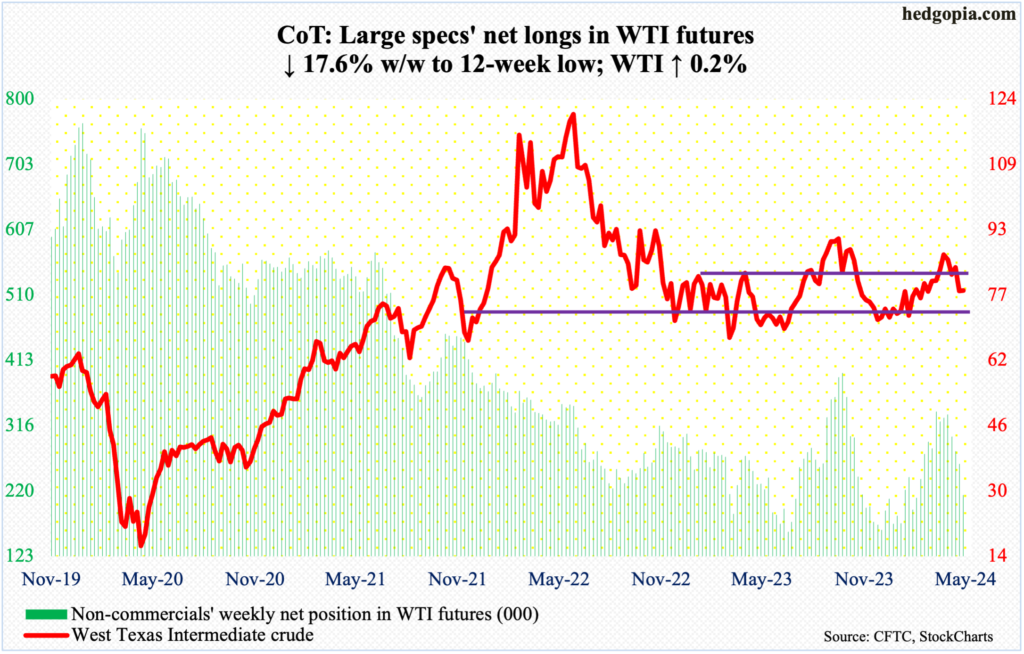
West Texas Intermediate crude rose 0.2 percent to $78.26/barrel this week, but oil bulls were on the defensive. The crude has been under pressure since tagging $87.67 on April 12th, having rallied from $67.71 last December.
This week, WTI dropped as low as $76.89 on Wednesday before bids showed up, but that was not enough to push it past the 200-day at $80.05, with the crude under the average for eight sessions now. The 50-day is above at $81.78.
Last week, the crude fell back into a well-established range between $71-$72 and $81-$82 that persisted for 19 months before the upper end gave way six weeks ago. This Friday, it rallied as high as $79.96 before sellers showed up.
If there is any consolation for the bulls, it is that Wednesday’s low successfully tested a rising trendline from last December’s low, for a weekly doji. That said, odds favor a breach ahead.
In the meantime, US crude production in the week to May 3rd was unchanged for nine consecutive weeks at 13.1 million barrels per day; 11 weeks ago, output was at a record 13.3 mb/d. Crude imports increased 197,000 b/d to seven mb/d. As did gasoline and distillate inventory, which respectively rose 915,000 barrels and 560,000 barrels to 228 million barrels and 116.4 million barrels. Crude stocks, however, dropped 1.4 million barrels to 459.5 million barrels. Refinery utilization rose one percentage point to 88.5 percent.
E-mini S&P 500: Currently net short 9.7k, up 52.8k.
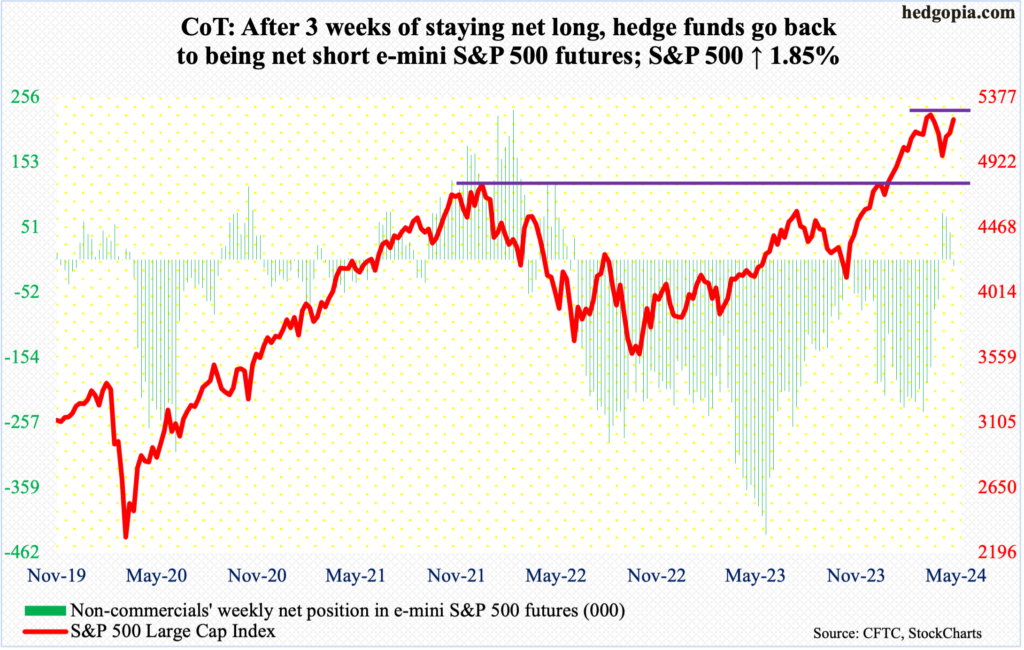
Equity bulls put up another week of strong show, with the S&P 500 rallying 1.9 percent to 5223. This was the third up week in a row. From the April 19th low of 4954 to Friday’s intraday high of 5240, the large cap index is up 5.8 percent, which just about offsets the 5.9-percent decline between last month’s low and the March 28th high of 5265. At Friday’s high, the index was less than 0.5 percent from the March peak.
Amidst this, signs of fatigue are showing up. Volume was anemic this week, and two of the five sessions ended in a doji. If non-commercials are to be believed, it will be a tough sled from here on. These traders, having switched to net long four weeks ago, are now net short e-mini S&P 500 futures.
Euro: Currently net long 4.6k, up 11.4k.
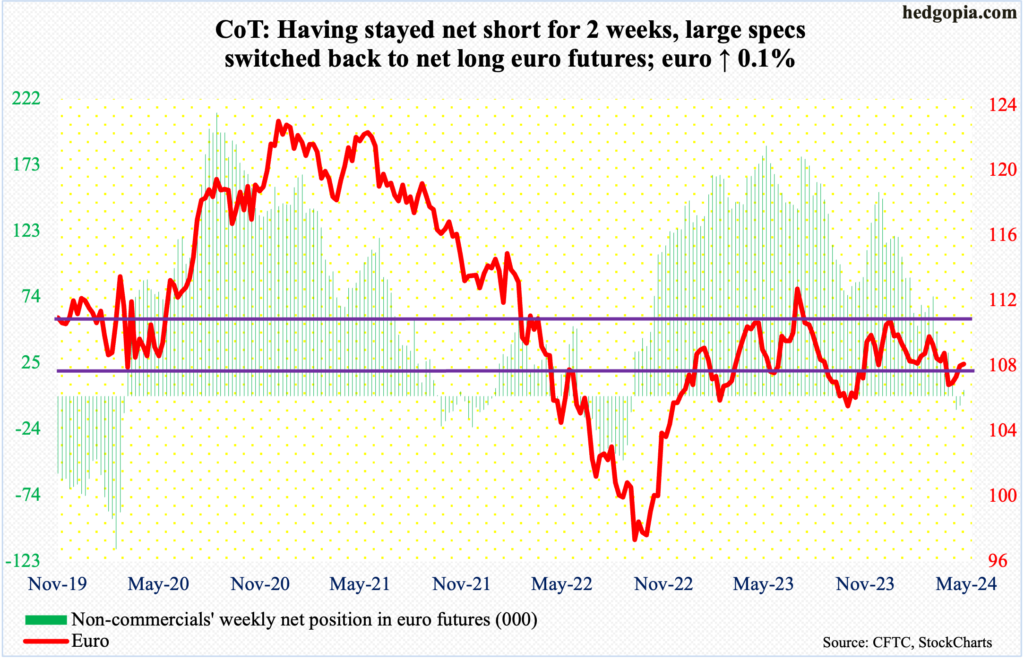
Euro bulls enjoyed their fourth up week in a row, although the week was only up 0.1 percent to $1.0772. The currency has trended higher since ticking $1.0601 on April 16th. Earlier, it came under pressure after tagging $1.0981 on March 8th. Even before that on December 27th, it retreated after touching $1.1125 and $1.1270 on July 18th. Trendline resistance from these highs lies at $1.09. Concurrently, a rising trend line from last October draws to $1.06. The resulting pennant – whichever way it breaks – will decide the next major trend.
Gold: Currently net long 199.6k, down 4.6k.
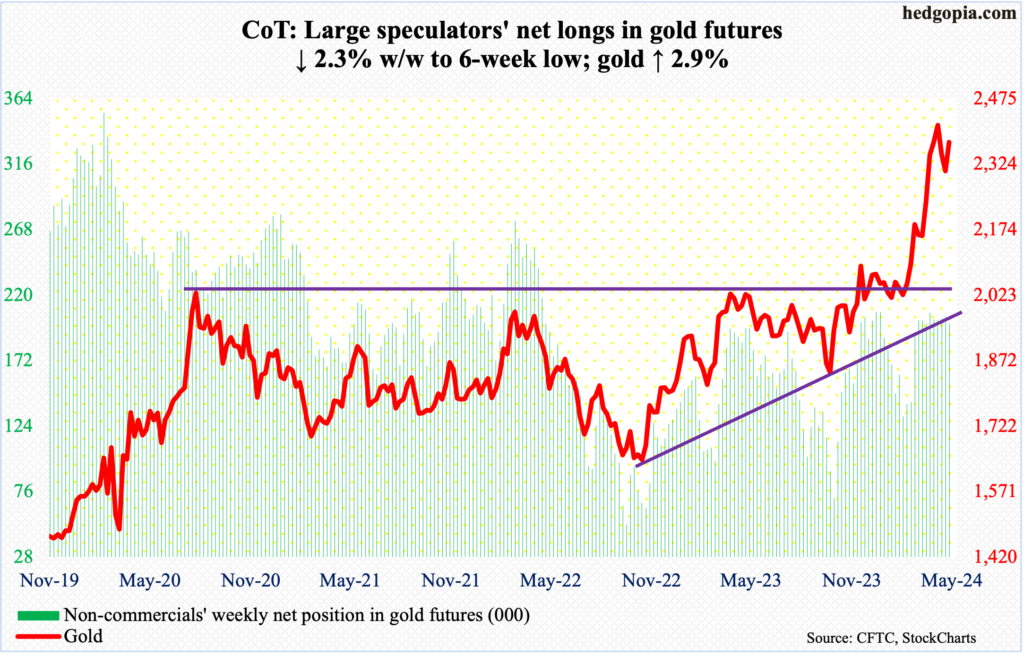
Last Friday, gold bugs showed up at $2,285 – well before testing horizontal support at $2,240s. They built on that this week, as the metal rallied 2.9 percent to $2,375/ounce. This comes after two weeks of decline.
On April 12th, gold printed a new intraday high of $2,449 but only to then reverse hard to close the session at $2,361. Friday’s intraday high of $2,385, in fact, kissed a falling trendline from that high. This resistance likely gives way in the sessions ahead.
Nasdaq (mini): Currently net long 4.4k, up 1.6k.
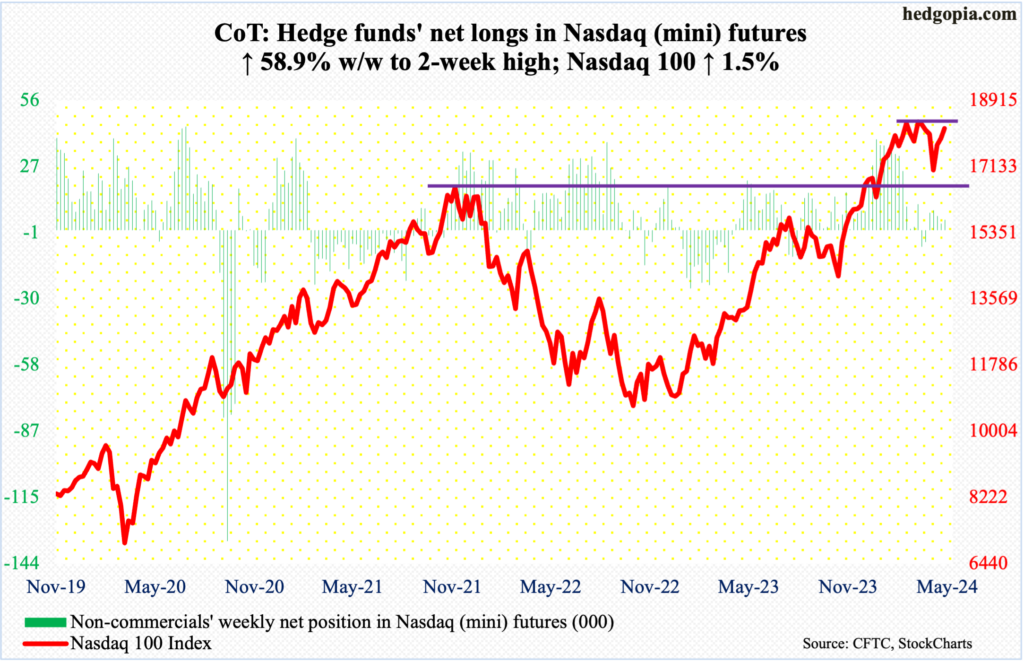
The Nasdaq 100 trudged higher 1.5 percent this week – its third consecutive up week. From the April 19th low of 16974 through Friday’s high of 18248, it rallied 7.5 percent. Before that, the tech-heavy index peaked at 18465 on March 21st, failing to sustainably break out of 18300s for seven weeks before rolling over; from that high through last month’s low, it swiftly gave back 8.1 percent.
Friday – a spinning top session – tech bulls could not quite muster strength enough to test 18300s. The index began the week with a rally past the 50-day on Monday, then struggled to keep up the momentum. The daily RSI is below 59. Ahead, bulls are likely to struggle to save the 50-day.
Russell 2000 mini-index: Currently net short 38k, down 2.3k.
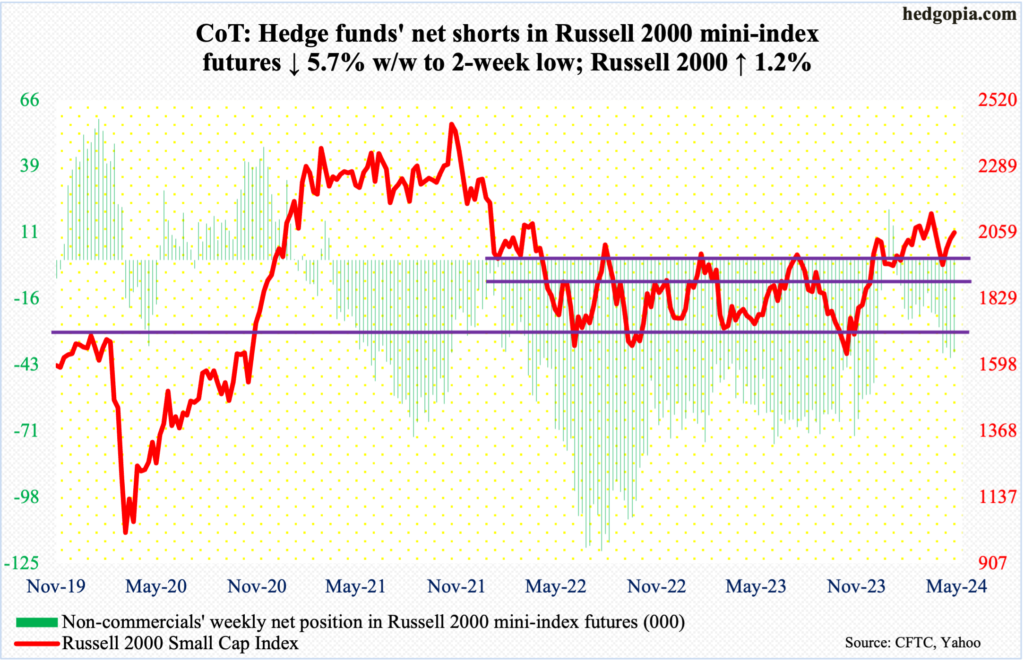
Small-cap bulls Friday came close to testing 2100, but no cigar. This is an important level.
The Russell 2000 peaked in November 2021 at 2459, subsequently reaching 1641 in June 2022, which was successfully tested in October of both 2022 and 2023. A 61.8-percent Fibonacci retracement of that drop comes to 2144. The small cap index lost 2100 in January 2022 and has since found stiff resistance at that price point, which also represents a measured-move price target post-breakout at 1900 last December. Before that, the index went back and forth between 1700 and 1900 going back to January 2022.
A decisive takeout of 2100 can give the bulls a much-needed fillip. Until then, they need to defend 2000 and most definitely 1900.
US Dollar Index: Currently net long 1.9k, up 1.9k.
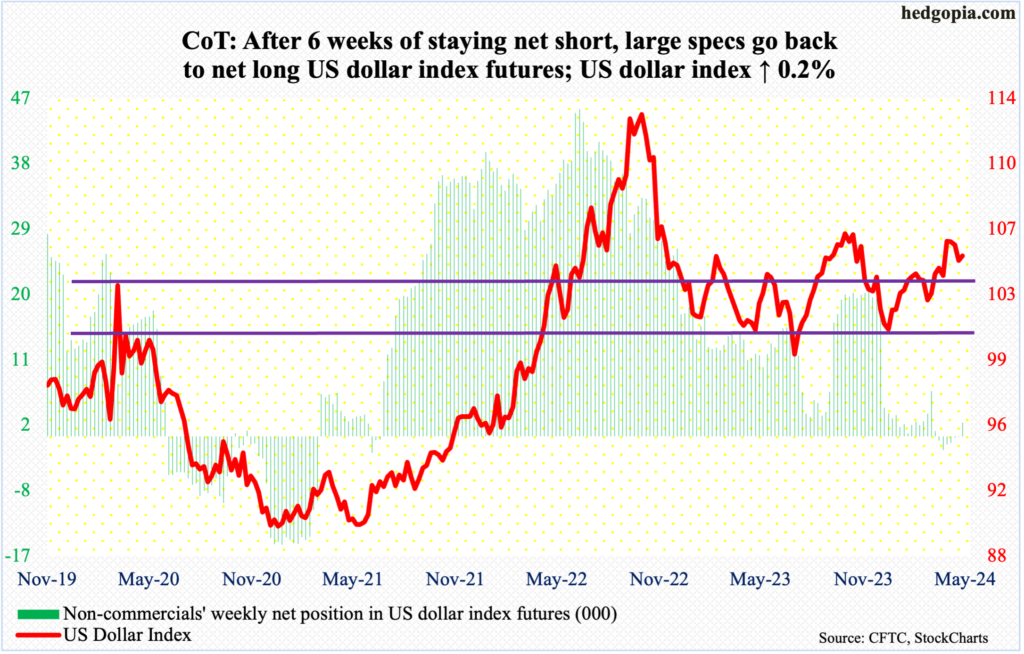
Last Friday, the 50-day (now 104.52) was successfully tested. Dollar bulls did build on that this week, but only slightly. The US dollar index rose 0.2 percent this week to 105.18, with an intra-week high of 105.64 on Thursday.
Last week, on May 1st, the index rallied as high as 106.38 but only to retreat. That was the fourth week in a row the index stalled just north of 106. So, for now, this is the area to beat as far as dollar bulls are concerned.
On the downside, breakout retest lies at 103-104, which goes back to December 2016 and was taken out four weeks ago; 104 also serves as trendline support from last December when the index bottomed at 100.32.
VIX: Currently net short 38.9k, up 16.4k.
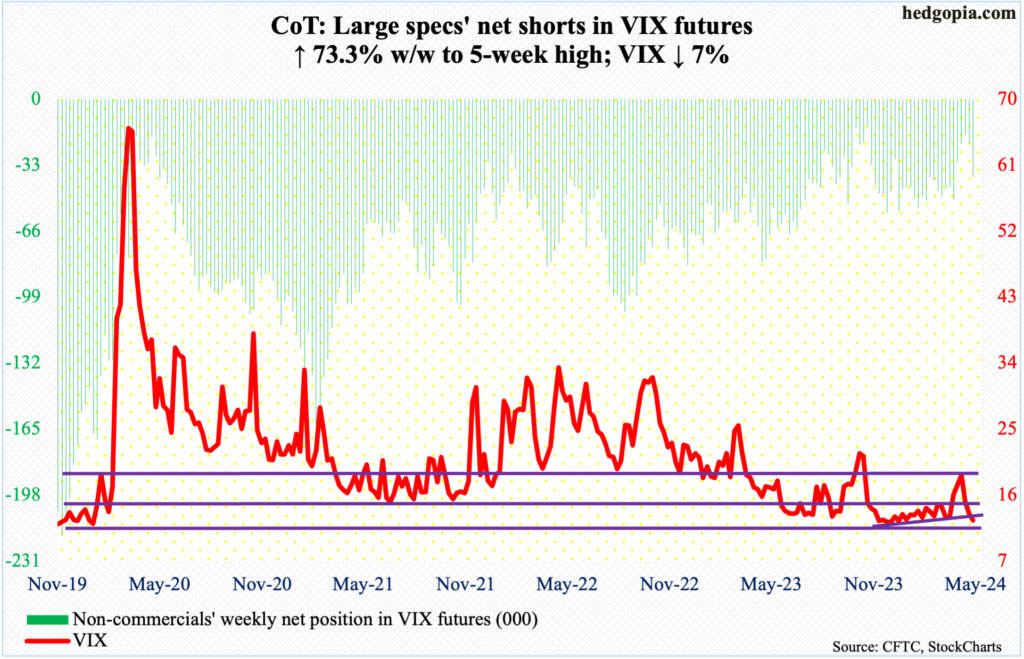
Volatility bulls better step up soon. VIX is perilously close to horizontal support at 12.30s. The volatility index yielded 0.94 points this week to 12.55. It is now down three weeks in a row. Four weeks ago – on April 19th – it tagged 21.36 and reversed.
Having lost nearly nine points over three weeks, VIX is oversold – way oversold. The daily in particular can rally.
Thanks for reading!

