Following futures positions of non-commercials are as of May 21, 2024.
10-year note: Currently net short 401k, up 53.2k.
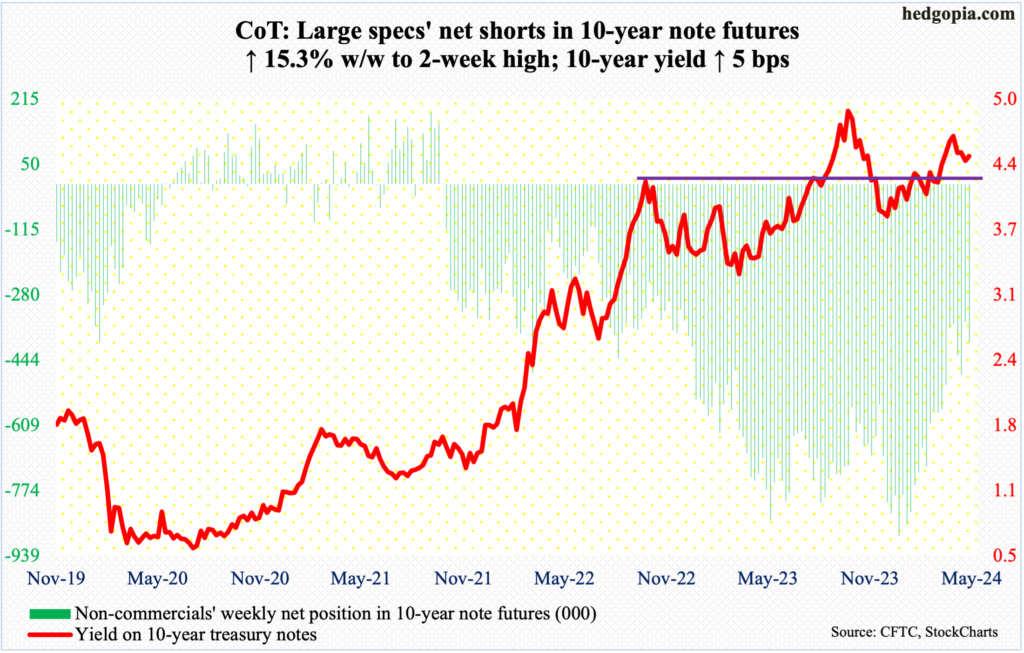
FOMC minutes for the April 30-May 1 meeting out Wednesday showed members were worried over slow progress on inflation. For the most part, after reaching four-decade highs in 2022, various inflation measures dropped meaningfully – until recent months when they seem to have stalled out.
At the last meeting, the fed funds rate was left unchanged at a range of 525 basis points to 550 basis points, with the last hike last July. The tightening cycle began in March 2022 when the benchmark rates were languishing between zero and 25 basis points. The next rate move is probably down, although the minutes showed members were willing to tighten more if the need be.
Futures traders have adjusted to the new reality. Early this year, they were pricing in six to seven 25-basis-point cuts this year. Now, this is down to just one. This new outlook is yet to get reflected in equities.
Last October, the major US equity indices bottomed and took off after Federal Reserve Chair Jerome Powell made a sharp dovish turn on December 13th. Back then, markets were convinced there would be six to seven cuts this year. This led to higher multiples and higher stock prices. Now that it is clear interest rates are barely going to drop this year, equities are taking their time to adjust to the new reality.
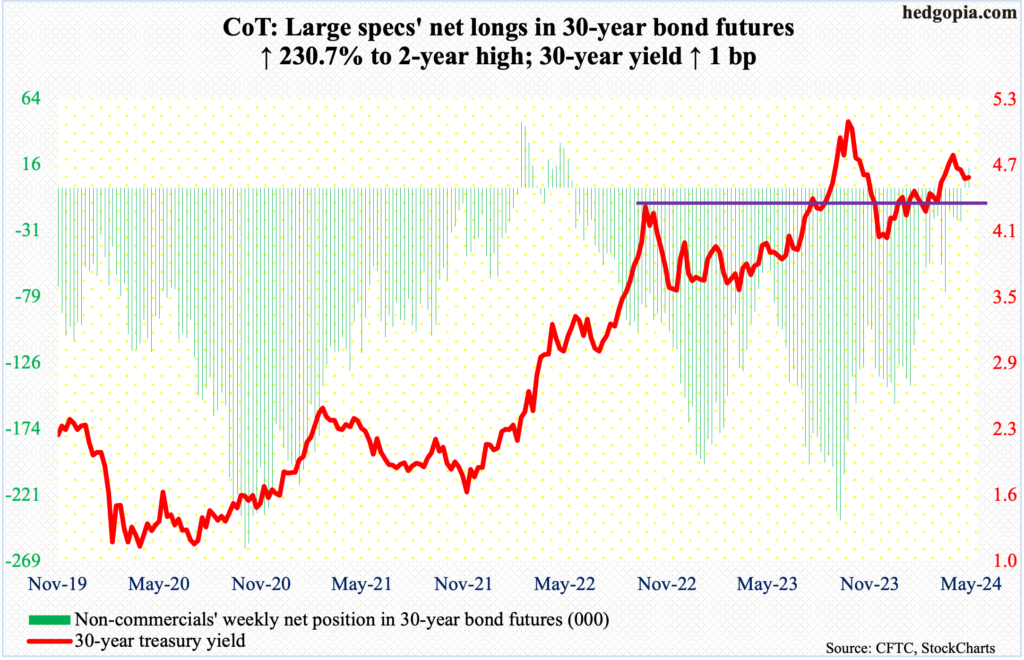
30-year bond: Currently net long 14.2k, up 9.9k.
Major US economic releases for next week are as follows. Markets are closed Monday for observance of Memorial Day!
The S&P Case-Shiller home price index (March) is due out Tuesday. Nationally in February, home prices appreciated 6.4 percent. Prices have been trending higher from negative territory which lasted for three months from April through June last year.
Thursday brings GDP (1Q24, 1st revision) and corporate profits (1Q24).
The first print showed real GDP grew 1.6 percent in the March quarter. Not counting the four negative quarters in between, this was the slowest quarterly growth rate in 21 quarters.
In 4Q23, corporate profits with inventory valuation and capital consumption adjustments increased 5.1 percent from a year ago to a seasonally adjusted annual rate of $3.4 trillion – a record.
On Friday, personal income/spending (April) is on dock. In the 12 months to March, headline and core PCE (personal consumption expenditures) increased 2.7 percent and 2.8 percent, in that order. They respectively peaked in 2022 at 7.1 percent and 5.6 percent in June and February.
WTI crude oil: Currently net long 255.3k, up 21.8k.
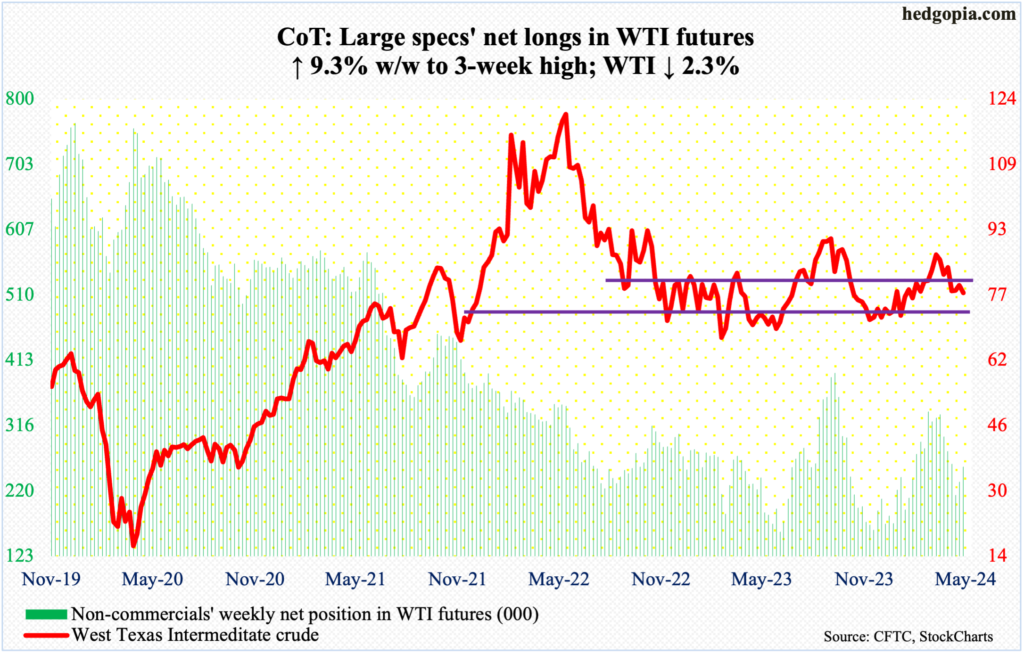
For the second consecutive week, a rising trendline from last December when West Texas Intermediate crude bottomed at $67.71 was breached intra-week but defended by the end of the week. The difference this time was that the crude ended the week right on it, with oil bulls buying Friday’s low of $76.15 to push the session up 1.1 percent to $77.72/barrel. With this, they also defended short-term horizontal support just south of $77.
The crude has faced difficulty at $80 for three weeks now. Back then, WTI fell back into a well-established range between $71-$72 and $81-$82 that persisted for 19 months before the upper end gave way a couple of months ago. Oil bulls need to at least charge toward the upper range sooner than later. Else, they risk a breach of the December trendline.
In the meantime, US crude production in the week to May 17th was unchanged for 11 consecutive weeks at 13.1 million barrels per day; 13 weeks ago, output was at a record 13.3 mb/d. Crude imports decreased 81,000 b/d to 6.7 mb/d. As did gasoline inventory, which dropped 945,000 barrels to 226.8 million barrels. Stocks of crude and distillates went the other way, up 1.8 million barrels and 379,000 barrels respectively to 458.8 million barrels and 116.7 million barrels. Refinery utilization increased 1.3 percentage points to 91.7 percent.
E-mini S&P 500: Currently net short 22.8k, down 2.5k.
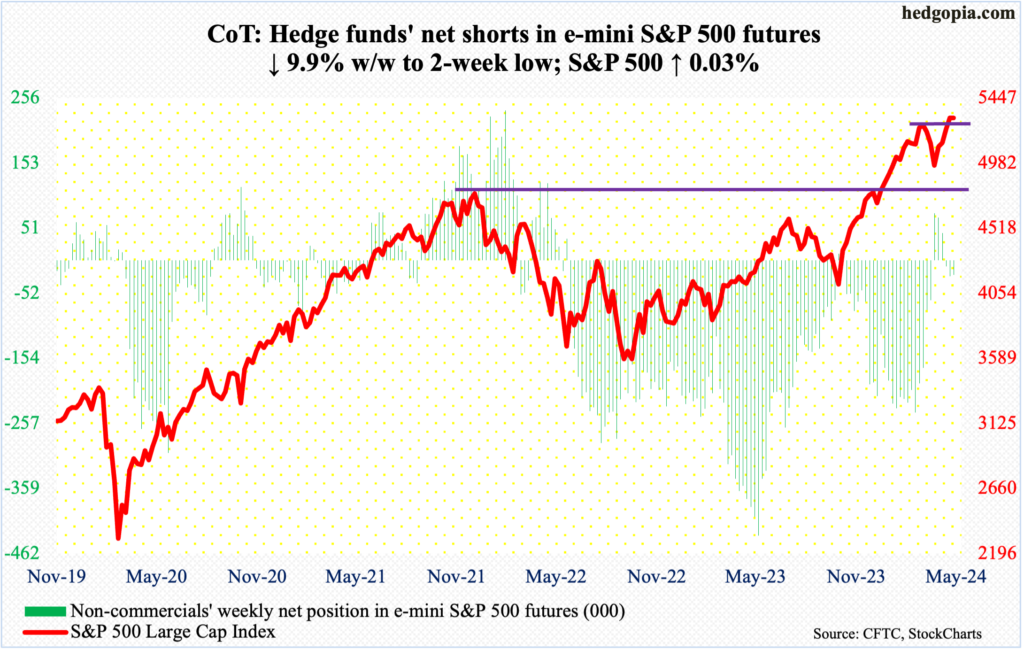
This was an interesting week, with equity bulls having romped for four preceding weeks. By Thursday, the S&P 500 was up 0.7 percent for the week at the session high and down 0.9 percent at the low; in the end, the index tagged a fresh high of 5342 but only to reverse to end near the session low. Friday’s 0.7-percent gain salvaged the week for the bulls.
For the week, the large cap index ended up 0.03 percent – essentially flat – to 5305, for a weekly doji. This, along with Thursday’s bearish engulfing candle, has opened the door for the bears; but they need to push the large cap index below 5260s to get any traction near term. This looks imminent in the sessions ahead.
Euro: Currently net long 41.5k, up 24.3k.
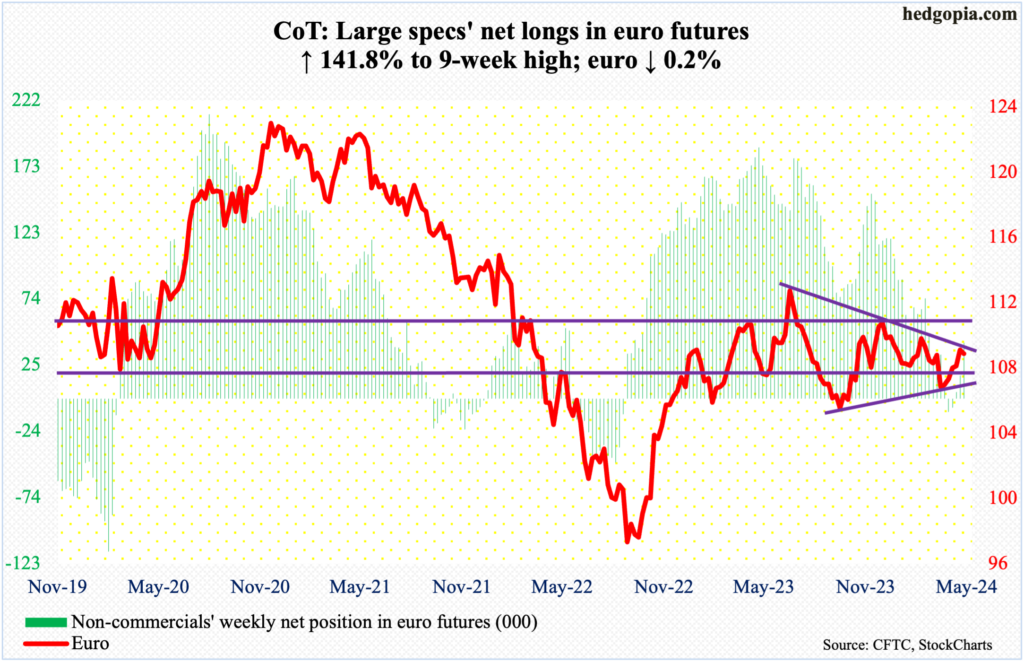
Last Wednesday’s high of $1.0886 just about kissed trendline resistance from last July when the euro tagged $1.1270. Concurrently, a rising trend line from last October draws to just north of $1.06. The resulting pennant – whichever way it breaks – will decide the next major trend.
This week, the currency fell 0.2 percent to $1.0847. This comes after five up weeks in a row. Earlier, it bottomed at $1.0601 on April 16th.
As things stand, trendline support from last October is in play.
Gold: Currently net long 229.8k, up 25.3k.
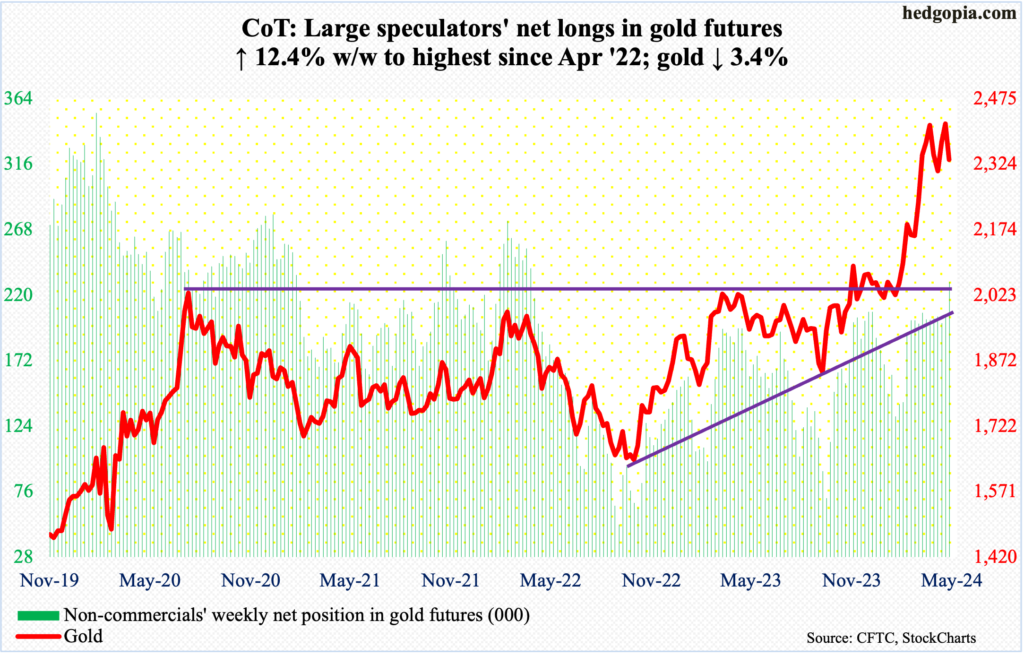
Non-commercials raised net longs in gold futures to the highest since April 2022. They were probably lured into the trade by the metal’s recent strength. This month, gold rallied from $2,285 on the 3rd to $2,454 on the 20th, with the latter a fresh record, surpassing the recent all-time high of $2,449 posted on April 12th.
However, gold bugs were unable to latch on to the 20th (this Monday) high. By the end of the week, the yellow metal gave back 3.4 percent to $2,335/ounce.
More weakness probably lies ahead, particularly if the bulls are unable to defend the 50-day moving average at $2,319. There is decent support at $2,240s.
Nasdaq (mini): Currently net long 4.7k, up 1.5k.
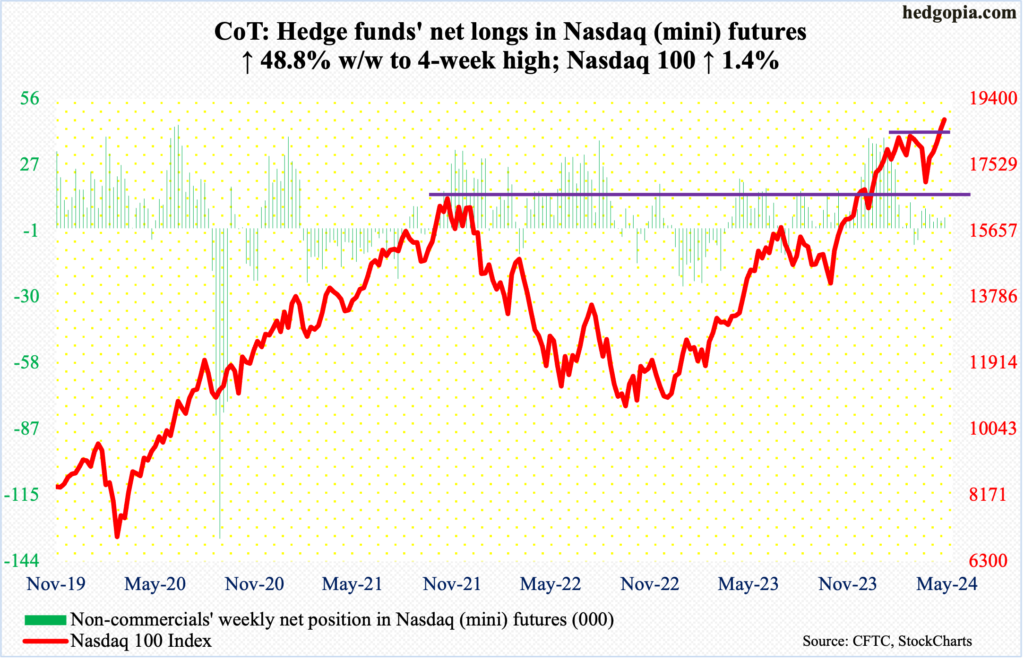
On Thursday, in the wake of Nvidia’s (NVDA) April-quarter results, the Nasdaq 100 diverged with the stock, with the latter jumping 9.3 percent to a new high and the index closing down 0.4 percent; in fact, the tech-heavy index was up 1.1 percent at the session high but gave all of it back and then some. In the end, Thursday evolved as a massive bearish engulfing candle.
Thanks to Friday’s one-percent rally, the week ended up 1.4 percent anyway – a fifth up week in a row. Thursday’s action does however show that the bulls will not hesitate to take profit, given how far the index has come. Most recently, on April 19th, the Nasdaq 100 bottomed at 16974, preceded by 14058 last October. This Thursday, it ticked 18908, before closing the week out at 18808.
On the downside, nearest support lies at 18300s.
Russell 2000 mini-index: Currently net short 37.6k, up 5.5k.
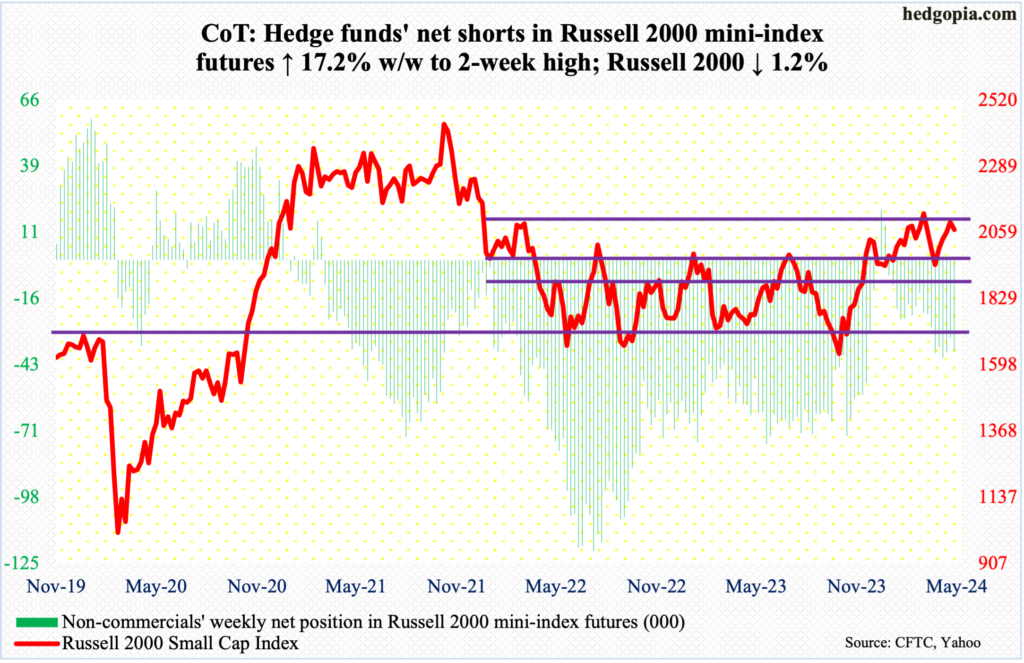
For five consecutive sessions through Tuesday, small-cap bulls rallied the Russell 2000 just north of 2100 intraday, but to no avail. Last week, the index finished at 2096. This week, it dropped 1.2 percent to 2070. This price point is increasingly proving significant.
The small cap index peaked in November 2021 at 2459, subsequently reaching 1641 in June 2022, which was successfully tested in October of both 2022 and 2023. A 61.8-percent Fibonacci retracement of that drop tallies to 2144. The index lost 2100 in January 2022 and has since struggled at that price point; 2100 also represents a measured-move price target post-breakout at 1900 last December. Before that, the index went back and forth between 1700 and 1900 going back to January 2022.
Yet another failure at reclaiming 2100 likely opens the door toward 2000 at best and 1900 at worse.
US Dollar Index: Currently net long 3.5k, up 1.1k.
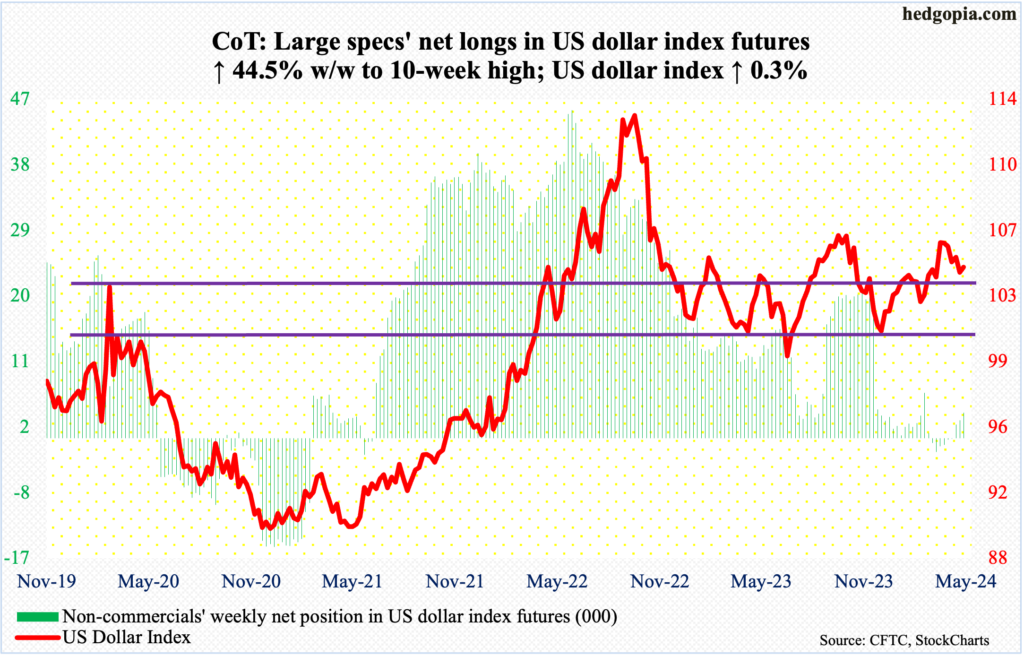
Last week, the US dollar index successfully tested a rising trendline from last December; back then, it bottomed at 100.32. This week, dollar bulls once again showed up at that support as early as Monday. By the end of the week, it added 0.3 percent to 104.64. The only thing is that the index recaptured the 50-day (104.83) for two sessions through Thursday but only to lose it on Friday. The 200-day at 104.23 lies below.
Horizontal support at 103-104 goes back to December 2016. So, this is an area that genuinely attracts both bulls and bears, and it is happening. A breach of the trendline mentioned above swings the favor to bears’ favor.
VIX: Currently net short 51.4k, up 3.3k.
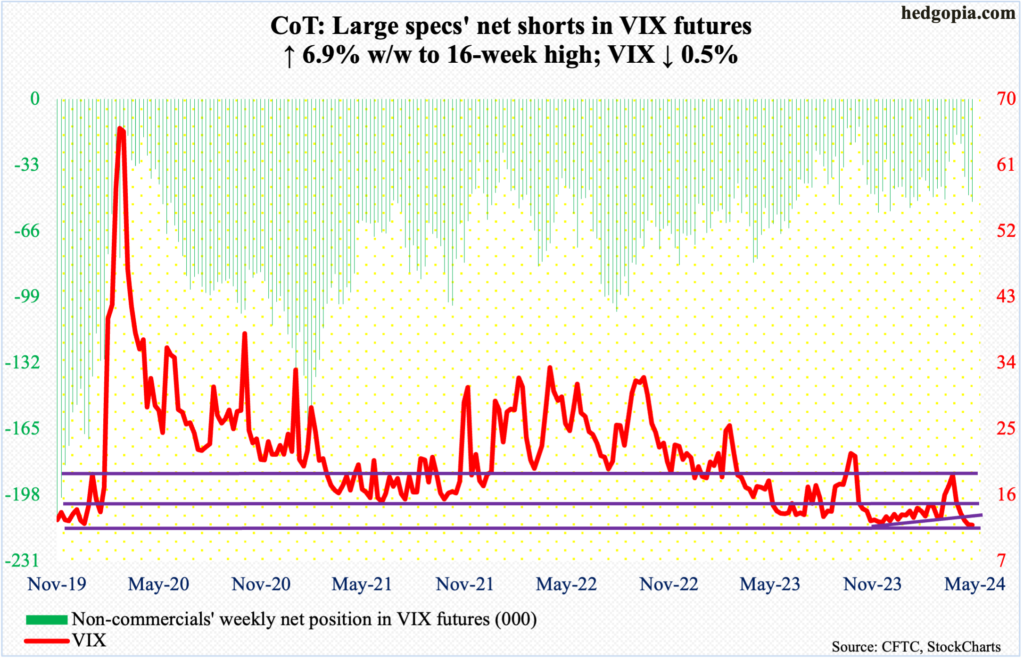
VIX gave back 0.06 points to 11.93 – its second straight sub-12 close. The volatility index has now dropped for five weeks in a row.
For the most part, volatility bulls have defended 12 the past six years. From their perspective, the problem is that no one is seeking any protection right now.
Through Wednesday, the CBOE equity-only put-to-call ratio printed 0.50s for eight sessions in a row, before rising to 0.60s on Thursday and Friday. If past is prelude, the only certainty in this is that once this complacency ends, it brings with it a lot of pain.
Thanks for reading!

