Following futures positions of non-commercials are as of May 28, 2024.
10-year note: Currently net short 388.2k, down 12.8k.
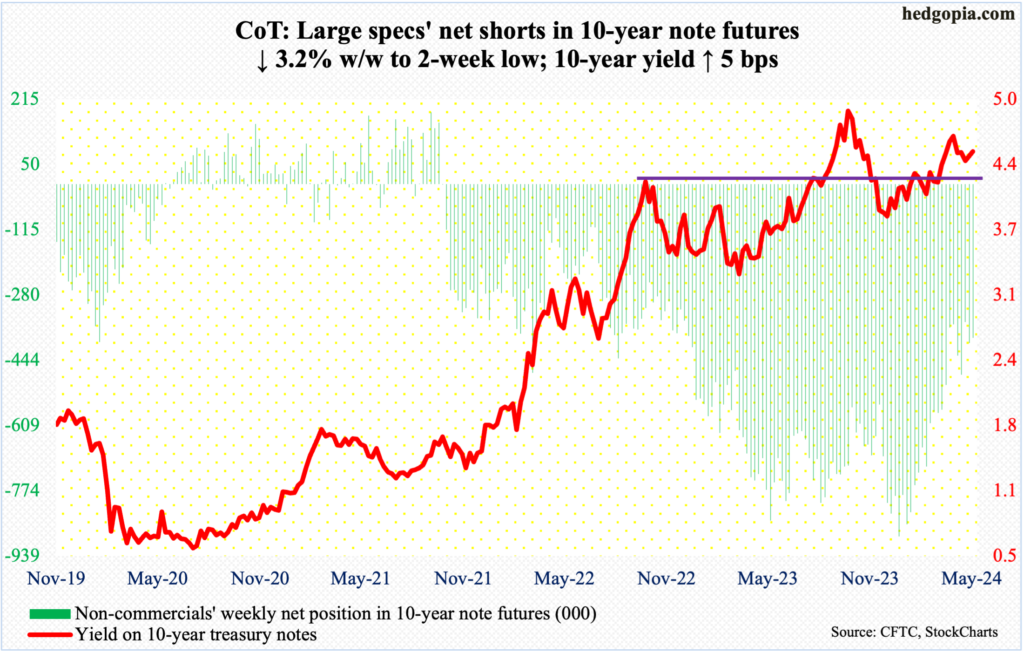
The trendline resistance proved too much for bond bears (on price) to overcome. On Wednesday, the 10-year treasury yield touched 4.64 percent intraday to close at 4.62 percent. Eight sessions ago – on May 16th – the rates ticked 4.32 percent to find support at the 200-day moving average (4.35 percent) and reversed higher.
The 10-year rallied big on Tuesday and Wednesday on the back of a softer-than-expected auction for five-year notes. Wednesday’s high kissed the upper trendline of a symmetrical triangle, with the upper line going to last October when the rates touched five percent and the lower line to the following December when they bottomed at 3.79 percent.
A sustained breakout can have important repercussions across the bond world. The US federal government has been borrowing like a drunken sailor, with national debt at $34.8 trillion, which has doubled in a decade. In a rising rates environment, this means soaring interest payments (more on this here). The US continues to run a deficit even at a time of decent economic growth. This is not a sustainable environment.
At some point, the bond vigilantes will revolt, demanding higher yields, and this likely will occur without a warning. That time probably is not now, in which case the symmetrical triangle will work like a charm. The lower trendline lies at 4.4 percent. The 10-year closed out the week at 4.51 percent.
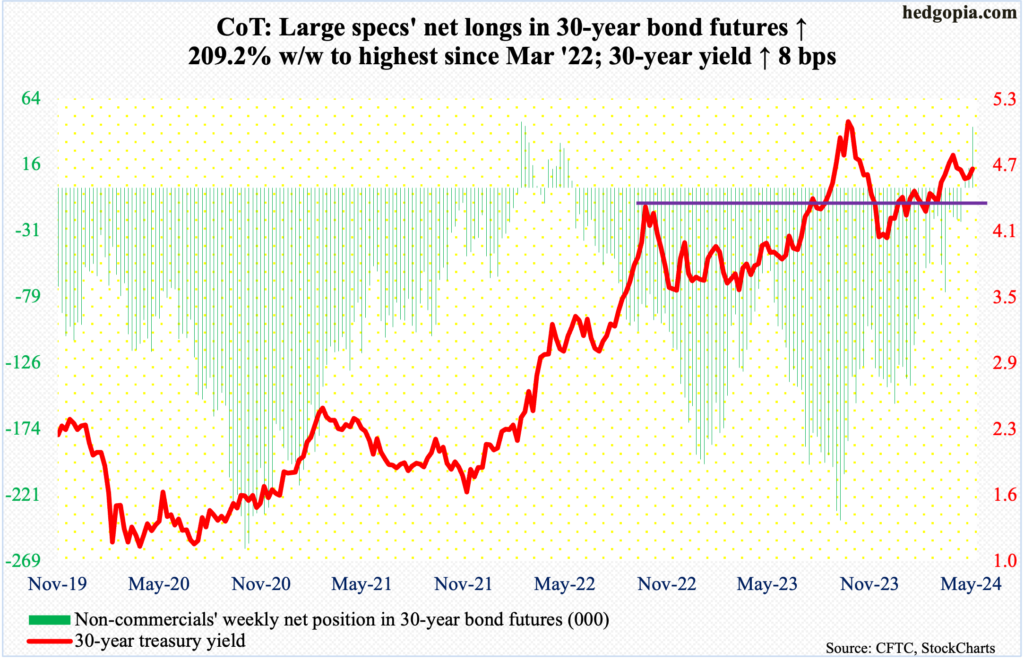
30-year bond: Currently net long 43.8k, up 29.7k.
Major US economic releases for next week are as follows.
The ISM manufacturing index (May) is due out Monday. In April, manufacturing activity contracted 1.1 percentage points month-over-month to 49.2 percent. March’s 50.3 percent was the first 50-plus reading after 16 consecutive months of contraction.
On Tuesday, durable goods orders (April, revised) and job openings (April) come out.
Preliminarily, April’s orders for non-defense capital goods ex-aircraft – proxy for business capex plans – rose 0.3 percent m/m to a seasonally adjusted annual rate of $74 billion, which was a new high.
March non-farm job openings dropped 325,000 m/m to 8.5 million. The all-time high of 12.2 million was recorded in March 2022.
Wednesday brings the ISM services index (May) and labor productivity (1Q24, final revision).
Non-manufacturing activity in April shrank two percentage points m/m to 49.4 percent.
The first print showed non-farm output per hour expanded 2.9 percent in the March quarter from a year ago. This was the highest growth rate in three years.
Payrolls (May) are on dock for Friday. The economy produced 175,000 non-farm jobs in April, for a monthly average this year of 246,000, versus a monthly average of 251,000 in 2023, 377,000 in 2022 and 604,000 in 2021.
WTI crude oil: Currently net long 284.4k, up 29.1k.
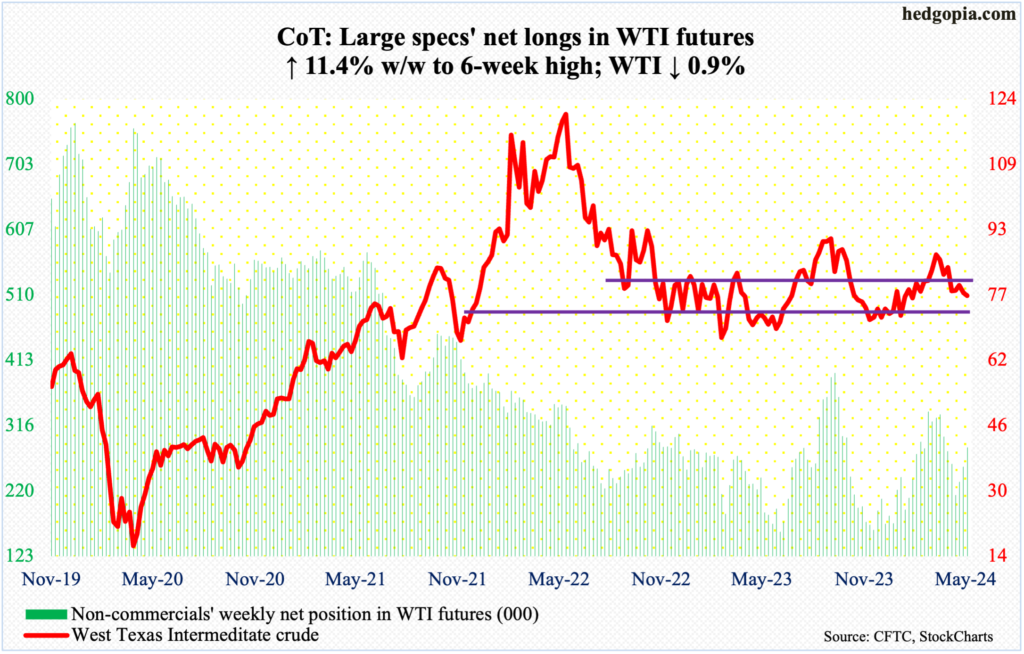
After three consecutive weeks of defending a rising trendline from last December when West Texas Intermediate crude bottomed at $67.71, oil bulls could no longer defend the support this week. West Texas Intermediate crude dropped 0.9 percent to $76.99/barrel. It rallied as high as $80.62 on Wednesday, but only to attract sellers. The crude failed to recapture the 200-day ($79.81), which is now slightly turning lower, in all of May.
In the end, resistance at $80, or the top end of a range between $71-$72 and $81-$82 that persisted for 19 months before the upper end gave way nine weeks ago and was lost early May, held. A weekly shooting star formed this week.
At this stage, bulls have their back against the wall, and they must defend near-term horizontal support just south of $77.
In the meantime, US crude production in the week to May 24th was unchanged for 12 consecutive weeks at 13.1 million barrels per day; 14 weeks ago, output was at a record 13.3 mb/d. Crude imports increased 106,000 b/d to 6.8 mb/d. As did gasoline and distillate inventory, which grew two million barrels and 2.5 million barrels respectively to 228.8 million barrels and 119.3 million barrels. Stocks of crude went the other way, down 4.2 million barrels to 454.7 million barrels. Refinery utilization increased 2.6 percentage points to 94.3 percent.
E-mini S&P 500: Currently net short 2.2k, down 20.6k.
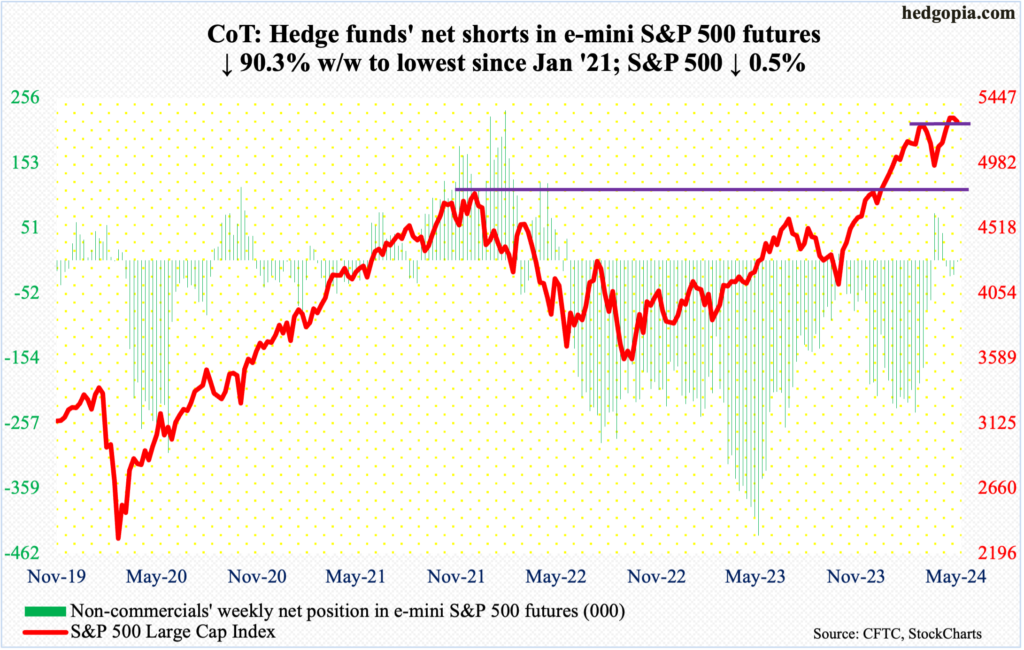
In a holiday-shortened week, equity bears prevailed in the first three sessions, while bulls came roaring back on Friday. The latter’s effort was still not enough to stem a 0.5-percent drop for the week – a first down week in six.
Nevertheless, bulls should be more than happy how the week turned out, as at Friday’s low the S&P 500 was down as much as 2.1 percent for the week; the session low of 5192 came just above the 50-day at 5181, closing the week out at 5278, thanks to a 44-point surge in the last 25 minutes Friday.
Friday’s impressive reversal helped form a potential hanging man on the weekly, which follows last week’s long-legged doji. Overall action has been tentative the last three weeks, with a new intraday high of 5342 coming in a bearish engulfing session on May 23rd (more on this here).
Bulls are holding on to the momentum ball but their grip is at risk of slipping away.
Euro: Currently net long 57.6k, up 16.1k.
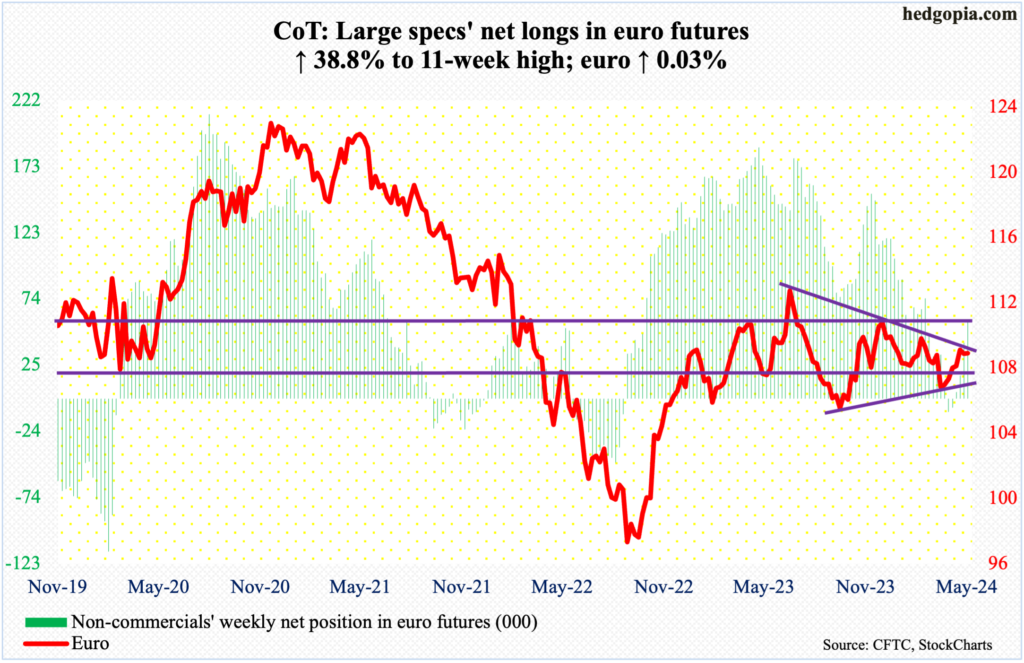
The euro was essentially unchanged for the week – up 0.03 percent to $1.0850. Tuesday’s high of $1.0888 kissed trendline resistance from last July when the euro retreated after touching $1.1270. The currency has struggled at this trendline the last three weeks.
Concurrently, a rising trend line from last October draws to just north of $1.06. The resulting symmetrical triangle – whichever way it breaks – will decide the next major trend.
Gold: Currently net long 236.6k, up 6.8k.
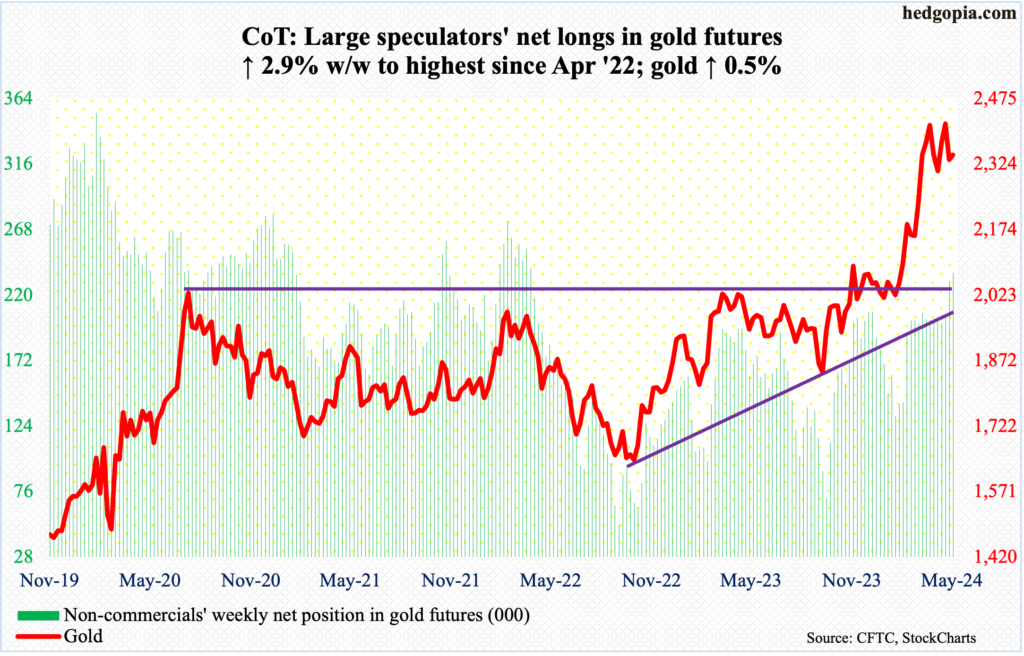
Gold was up 0.5 percent for the week but could have done better. At Tuesday’s high, gold rallied as high as $2,386 but finished the week at $2,346/ounce. The metal has essentially gone sideways the last six sessions just above the 50-day ($2,335).
It increasingly feels like gold is taking a breather before beginning a process of digesting the recent gains. Last October, the yellow metal ticked $1,824 and was at $1,996 this February. On May 20th, gold reached $2,454.
Once the 50-day gives way, there is decent support at $2,240s.
Nasdaq (mini): Currently net short 3.7k, up 8.4k.
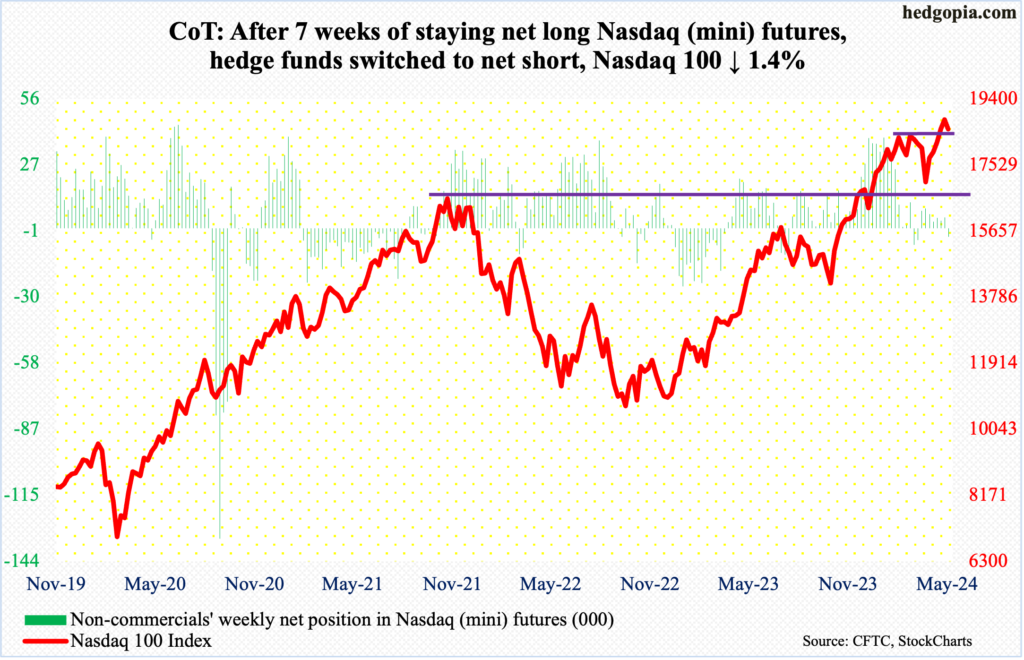
After seven weeks of staying net long Nasdaq (mini) futures, non-commercials switched to net short this week.
The Nasdaq 100 at one point on Friday was down as much as 3.3 percent for the week but recovered to end down only 1.4 percent. This is the first negative week in six. Tech bulls showed up in that session 100 points above the 50-day (18090); horizontal support at 18300s, which goes back three months, was breached intraday but saved by close (18537).
This week’s rather wild action came after a new high of 18908 was hit on May 23rd but only to end the session with a bearish engulfing candle.
On the downside, the first line of support lies at 18300s.
Russell 2000 mini-index: Currently net short 33.8k, down 3.7k.
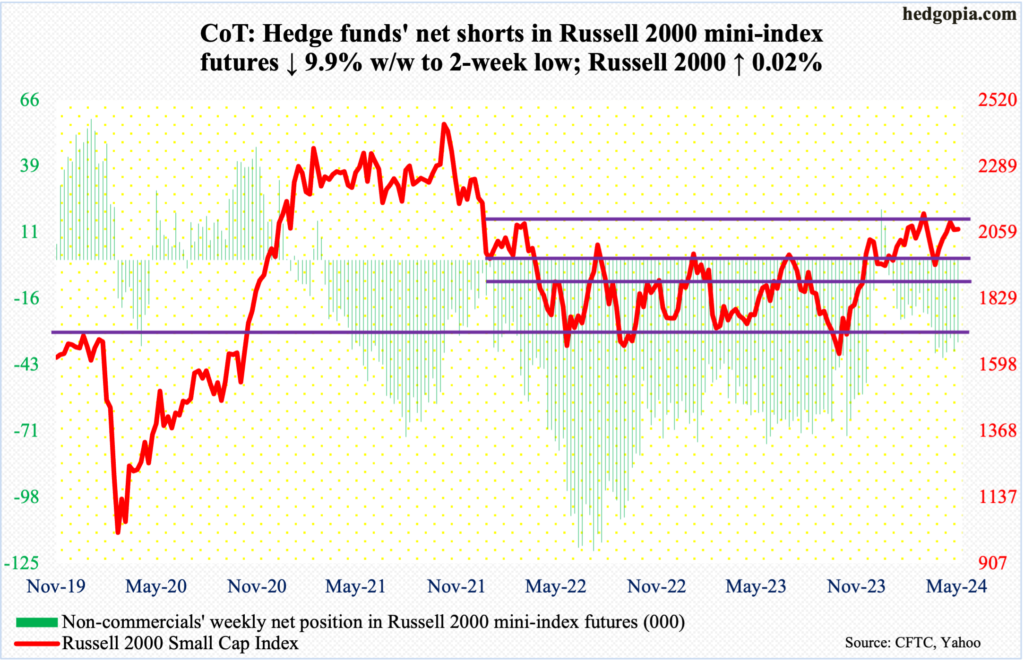
The Russell 2000 remains trapped between 2000 and 2100. This week, with a high of 2086 and a low of 2036, the small cap index was essentially unchanged – up 0.02 percent – at 2070.
The index has traded above 2000 since early last month, while 2100 has stood like a mountain since early March. Here is why 2100 is significant.
The Russell 2000 peaked in November 2021 at 2459, subsequently reaching 1641 in June 2022, which was successfully tested in October of both 2022 and 2023. A 61.8-percent Fibonacci retracement of that drop tallies to 2144. The index lost 2100 in January 2022 and has since struggled at that price point; 2100 also represents a measured-move price target post-breakout at 1900 last December. Before that, the index went back and forth between 1700 and 1900 going back to January 2022.
Repeated failure at 2100 suggests the path of least resistance is toward 2000 at best and 1900 at worse.
US Dollar Index: Currently net long 4.2k, up 656.
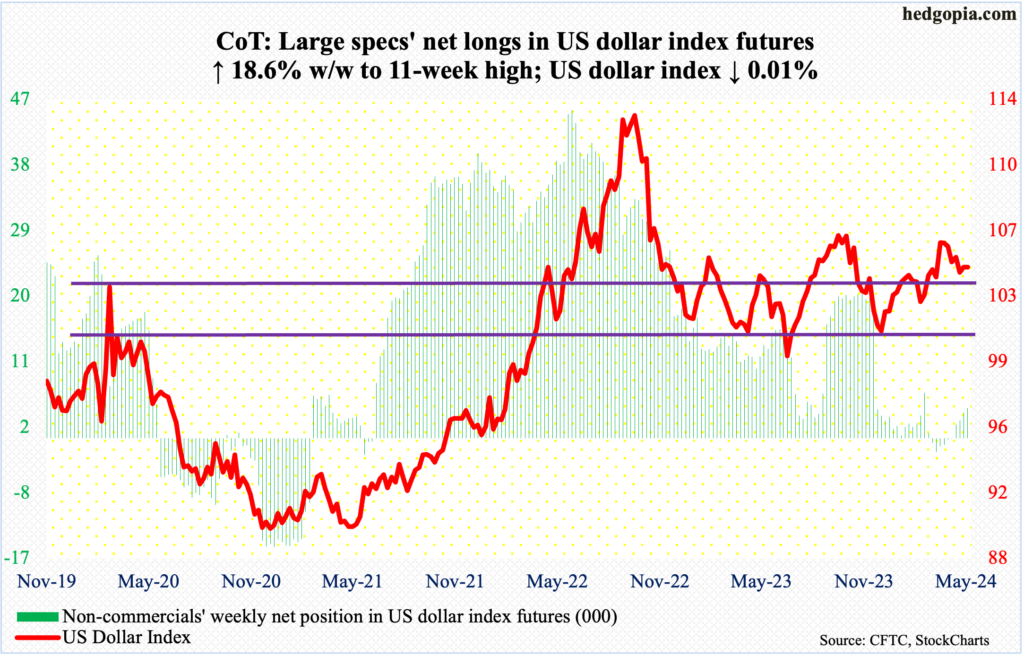
Yet again, a rising trendline from last December when the US dollar index bottomed at 100.32 drew bids, but nothing much came out of it. This week, the index finished unchanged – down 0.01 percent – to 104.63.
Tuesday’s low of 104.26 also successfully tested the 200-day (104.27), which was again visited on Friday. That said, dollar bulls’ attempt at the 50-day (104.95) was rejected both Thursday and Friday.
Horizontal support at 103-104 goes back to December 2016. A likely breach ahead of the December trendline should swing near-term odds to dollar bears’ favor.
VIX: Currently net short 42.7k, down 8.6k.
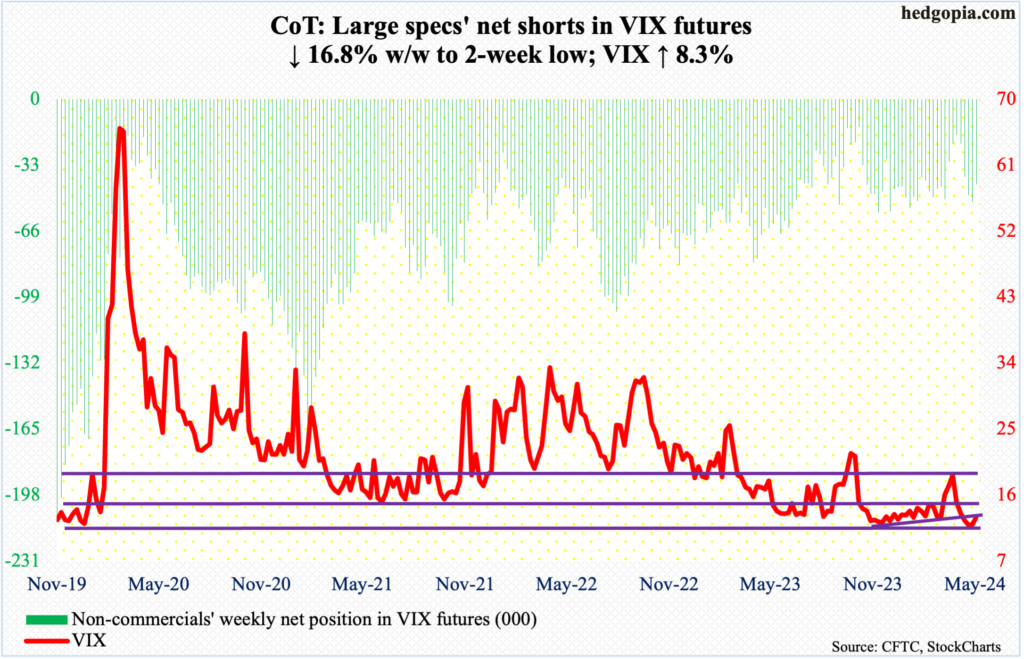
VIX added 0.99 points this week to 12.92 but failed to keep most of its gains. Thursday, the volatility index ticked 14.88, followed by Friday’s 14.87; in both those sessions, the 200-day (14.71) was reclaimed intraday but lost by close. In the end, a shooting star formed on the weekly.
Going back six years, volatility bulls have repeatedly defended 12. The streak likely continues. That said, the daily likely comes under pressure in the sessions ahead. On May 23rd, VIX reversed higher from a low of 11.52 to close at 12.77.
Thanks for reading!

