
Following futures positions of non-commercials are as of October 8, 2024.
10-year note: Currently net short 960.1k, down 183.8k.
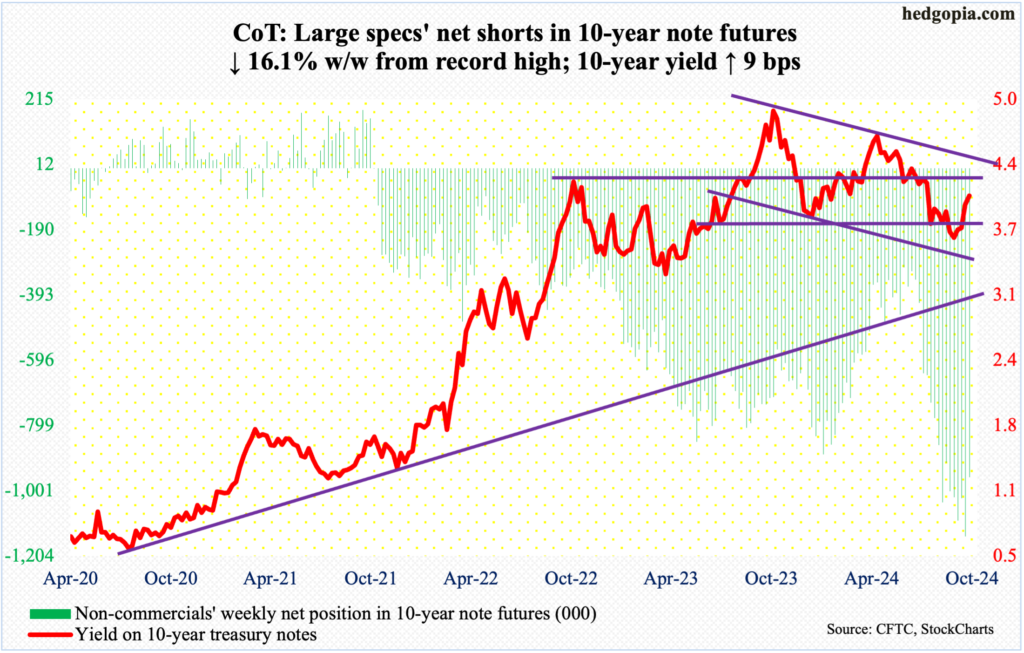
The 10-year treasury yield continued to rally – now up four weeks in a row, with the addition of nine more basis points this week to 4.07 percent. At Thursday’s intraday high of 4.12 percent, rates were five basis points from the 200-day moving average.
On September 17, the 10-year began rallying from 3.60 percent. There is horizontal resistance between 4.2 percent and 4.3 percent; then there is trendline resistance from October last year at 4.4 percent. In the unlikely event that these levels get tested right away – the trendline resistance in particular – odds heavily favor short-covering by non-commercials, who remain massively net short 10-year note futures. This week, they cut their holdings by a decent amount, but this was from a record!
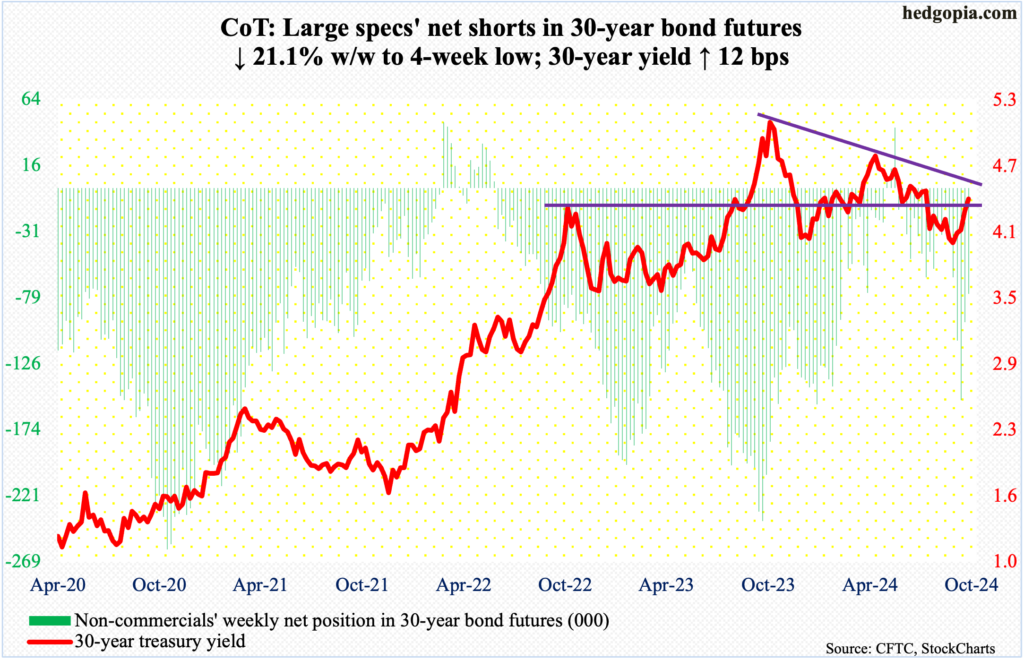
30-year bond: Currently net short 76.2k, down 20.4k.
Major US economic releases for next week are as follows.
Retail sales (September), industrial production (September) and the NAHB housing market index (October) are on schedule for Thursday.
August retail sales edged up 0.05 percent month-over-month to a seasonally adjusted annual rate of $710.8 billion – a fresh record.
Capacity utilization in August increased 0.7 percent m/m to 78 percent – a two-month high. January’s 77.2 percent was the lowest since April 2021.
Homebuilder optimism grew a couple of points m/m in September to 41, which represents a fifth consecutive monthly reading of 45 or lower.
Friday brings housing starts (September). August starts jumped 9.6 percent m/m to 1.36 million units – a four-month high.
WTI crude oil: Currently net long 154.7k, up 19.5k.
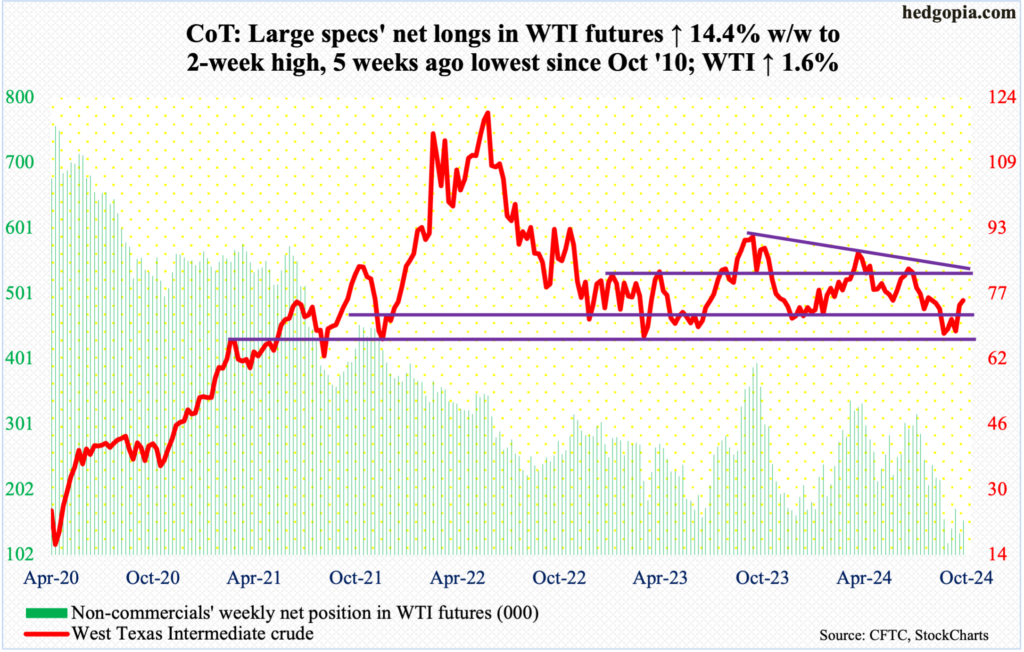
West Texas Intermediate crude rose as high as $78.46 this week, although oil bulls were unable to hang on to all the gains, finishing up 1.6 percent to $75.56/barrel. This was the second consecutive week of gains.
Earlier, the crude fell as low as $65.27 on September 10 before the bottom of a well-established range between $71-$72 and $81-$82 was defended. This week attempts to reclaim the 200-day ($77.22) by close were denied, even as the bears failed to close the price below the 50-day ($72.52).
Immediately ahead, even before the top of the aforementioned range could be tested, there is trendline resistance at $80, which represents a falling trendline from September last year when the crude retreated after posting $95.03.
In the meantime, US crude production in the week to October 4 increased 100,000 barrels per day week-over-week to 13.4 million b/d, matching a weekly record that was hit twice in August. Crude imports decreased 389,000 b/d to 6.2 mb/d. As did stocks of gasoline and distillate, which respectively declined 6.3 million barrels and 3.1 million barrels to 214.9 million barrels and 118.5 million barrels. Crude inventory, however, went the other way – up 5.8 million barrels to 422.7 million barrels. Refinery utilization declined nine-tenths of a percentage point to 86.7 percent – a 31-week low.
E-mini S&P 500: Currently net short 5.6k, up 13.2k.
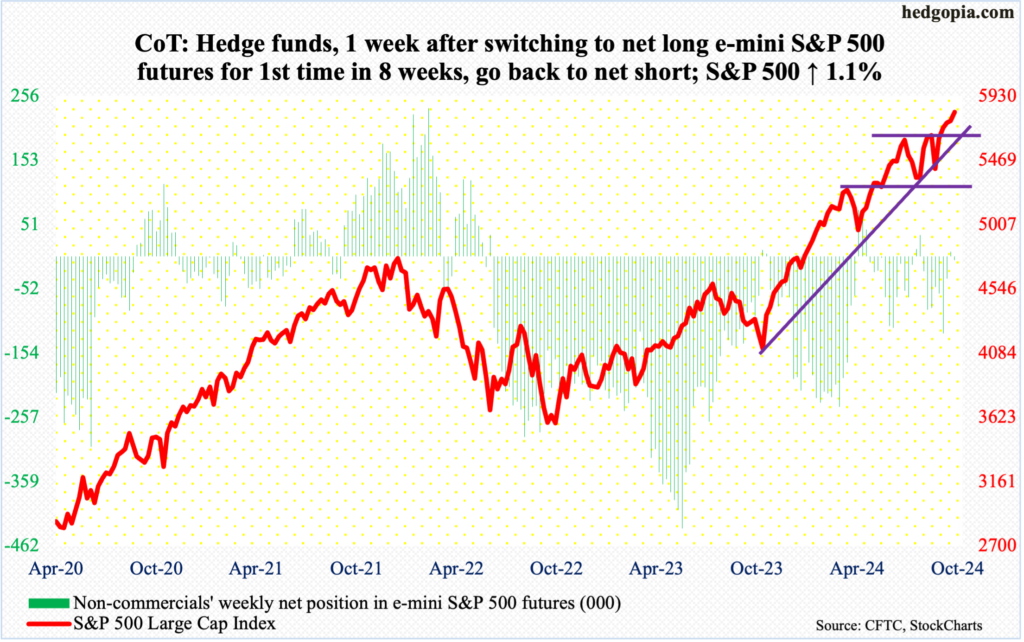
Equity bulls are using every opportunity they get to defend support.
On September 19, the S&P 500 broke out of 5670s, which represent the prior highs from July 16 (5670) and September 17 (5671). A successful retest took place in the very next session and then again on October 2-3. This Wednesday, the large cap index experienced another mini breakout at 5760s, followed by Thursday’s successful doji retest (more on this here). For the week, it rallied 1.1 percent to 5815 – a fifth up week in a row.
Despite the persistent strength over the last several weeks, both the daily and weekly RSI (64.64 and 67.77 respectively) are yet to reach 70. The metric has not hit that overbought threshold since July when the S&P 500 went on to subsequently give back just short of 10 percent over three weeks.
As things stand, bulls’ first test lies at 5760s.
Euro: Currently net long 39.1k, down 16.2k.
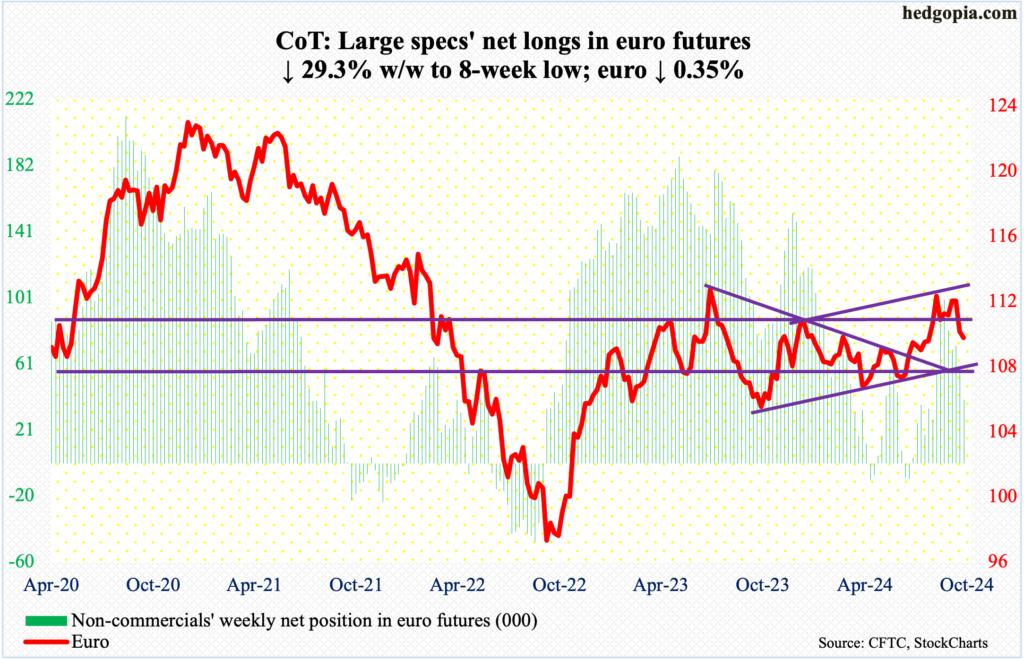
Last week, after facing rejection at $1.12 for six consecutive weeks, the euro sharply fell – past the 50-day, but not a whole lot below potentially crucial $1.10. This week, after opening with back-to-back daily spinning top candles and denied at $1.10 on Tuesday, the currency went on to drop 0.35 percent to $1.094, with Thursday tagging $1.09 – just above the 200-day at $1.088.
There is horizontal support at $1.091. After this, a rising trendline from October last year lies at $1.075, which is unlikely to yield right here and now.
Gold: Currently net long 278.2k, down 21.8k.
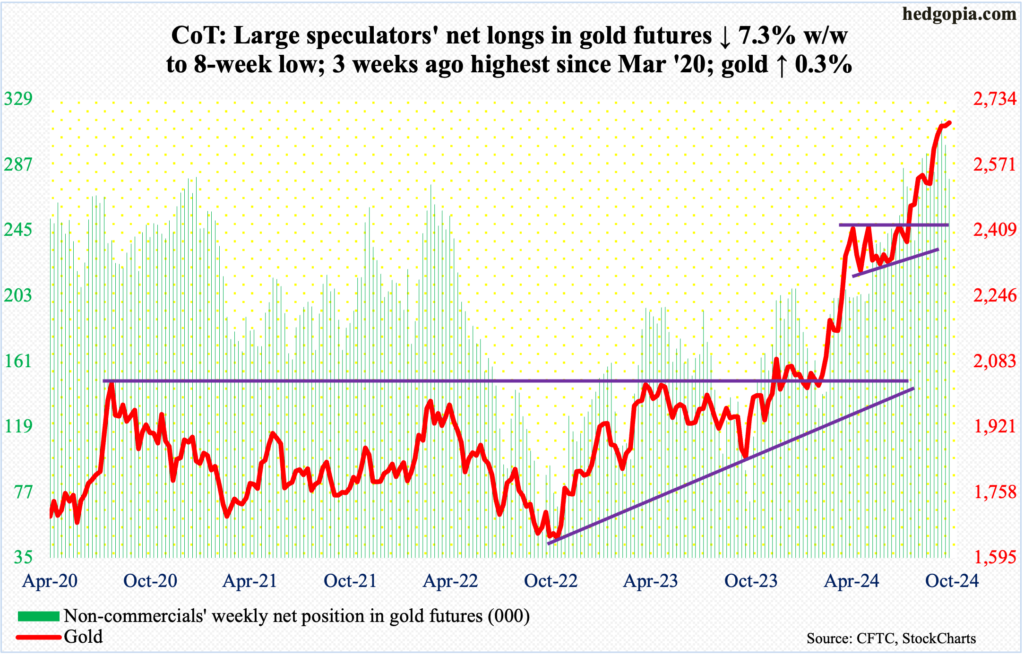
Three weeks ago, in a shooting star week, gold printed $2,709 intraday before heading lower. It has had a powerful rally since June when it tagged $2,305. In between, the yellow metal enjoyed one after another breakout.
Three weeks ago, after five sessions of sideways action at $2,610s, gold broke out on September 20; this followed a breakout in the prior week at $2,540s-50s after several unsuccessful attempts since mid-August. Prior to this, after more than three months of sideways action, it broke out at $2,440s-50s in August.
This week, after coming under pressure in the first three sessions, bids showed up Thursday at $2,610s, with an intraday low of $2,619, ending the week up 0.3 percent to $2,676/ounce and forming a weekly dragonfly doji. Having defended the first layer of support, gold bugs deserve the benefit of the doubt in the sessions ahead.
Nasdaq (mini): Currently net long 13.3k, down 2.8k.
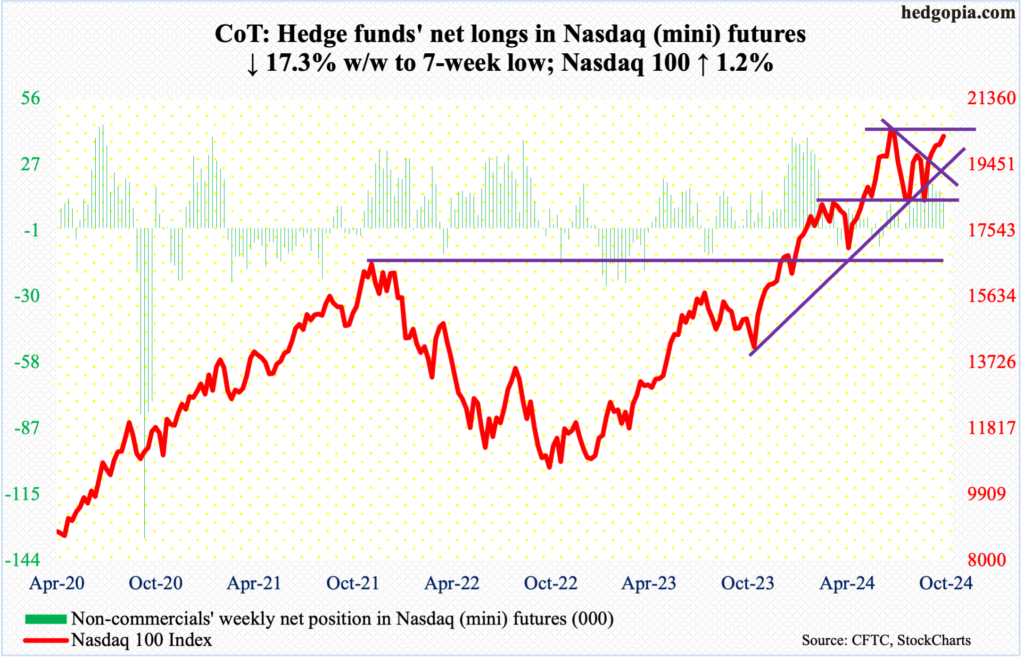
The Nasdaq 100 rallied 1.2 percent this week, but that was not enough to take out gap-down resistance at 20200s. A couple of weeks ago, the index came under pressure as soon as it filled a July 17 gap at 20200s. This week, tech bulls hammered on that in the latter three sessions, but to no avail, closing at 20272, with Thursday’s intraday high of 20314.
If there is any consolation for the bulls, it is that the tech-heavy index just scraped past a falling trendline from July when it peaked at 20691. This, however, is not sufficient. It is only when the gap resistance goes can the bulls then go after the July high.
Russell 2000 mini-index: Currently net long 5k, down 15.3k.
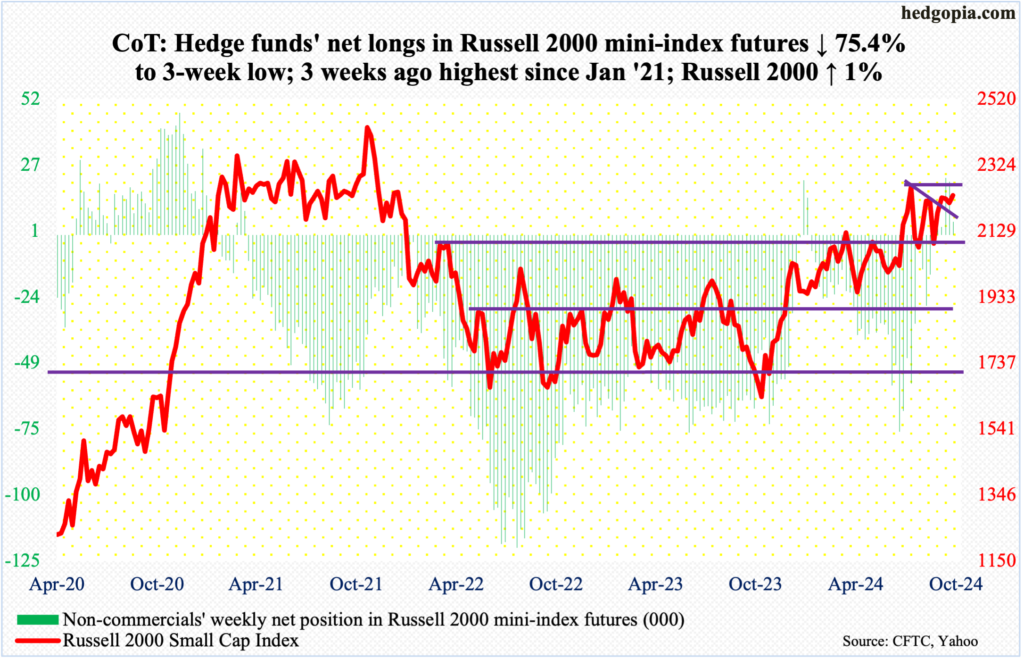
Until Thursday, the Russell 2000 was down 1.1 percent for the week. Friday’s 2.1-percent rally not only helped it erase this loss but also end the week up one percent to 2234. This was the first up week in three.
Friday’s bullish marubozu candle also helped the small cap index push through a descending channel going back to September 18 when it ticked 2259. Horizontal resistance at 2260s goes back to mid-July, and this week’s action likely opens the door toward a test of that hurdle.
US Dollar Index: Currently net short 1.9k, up 2k.
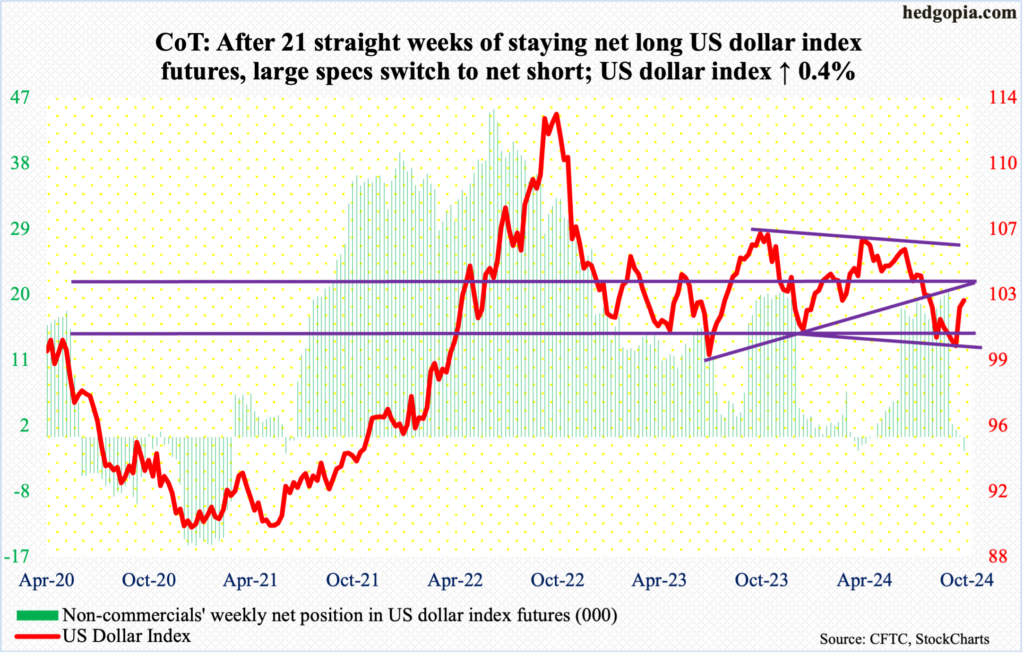
Friday’s 0.1-percent drop was the first in 10 sessions. The US dollar index began to rally on September 30, after having gone sideways just under 100 for several sessions.
The index had been under pressure since ticking 105.80 in June; this was preceded by highs of 106.38 in April and 107.05 last October, establishing a pattern of lower highs. This resistance lies at 105.50. Before this gets tested, the 200-day is at 103.59. then there is the crucial 103-104, which goes back to December 2016.
This week, the index was up 0.4 percent to 102.68. The daily looks tired.
VIX: Currently net short 3k, down 12.9k.
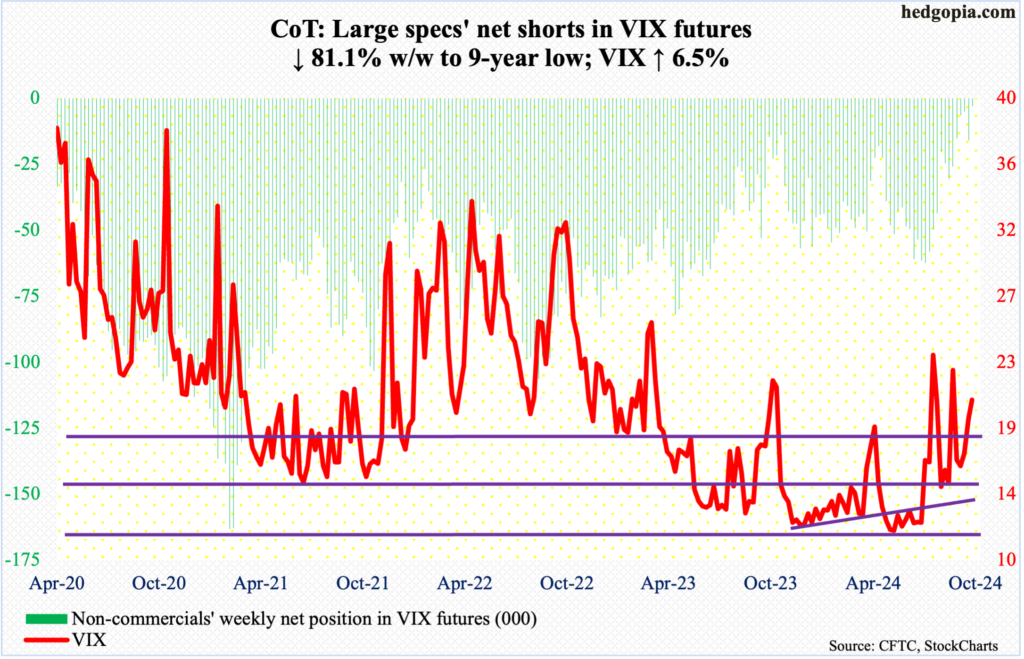
For the third week in a row, VIX and the S&P 500 both rallied. This is a rare occurrence. The two otherwise tend to go the opposite ways. As a result, the S&P 500 is at a new high, even as VIX remains above 20. This week, the volatility index added 1.25 points to 20.46.
That said, intraday Tuesday (this week) VIX hit 23.14, which volatility bulls were unable to hang on to. On the daily, there is room for it to continue lower. The 50-day is at 18.92.
If VIX comes under pressure in the sessions ahead, this will have come at a time when non-commercials’ net shorts in VIX futures have dropped to a nine-year low. Historically, VIX has tended to peak as these traders either go long or get close to doing that.
Thanks for reading!
