
Following futures positions of non-commercials are as of February 11, 2025.
10-year note: Currently net short 751k, up 43.3k.
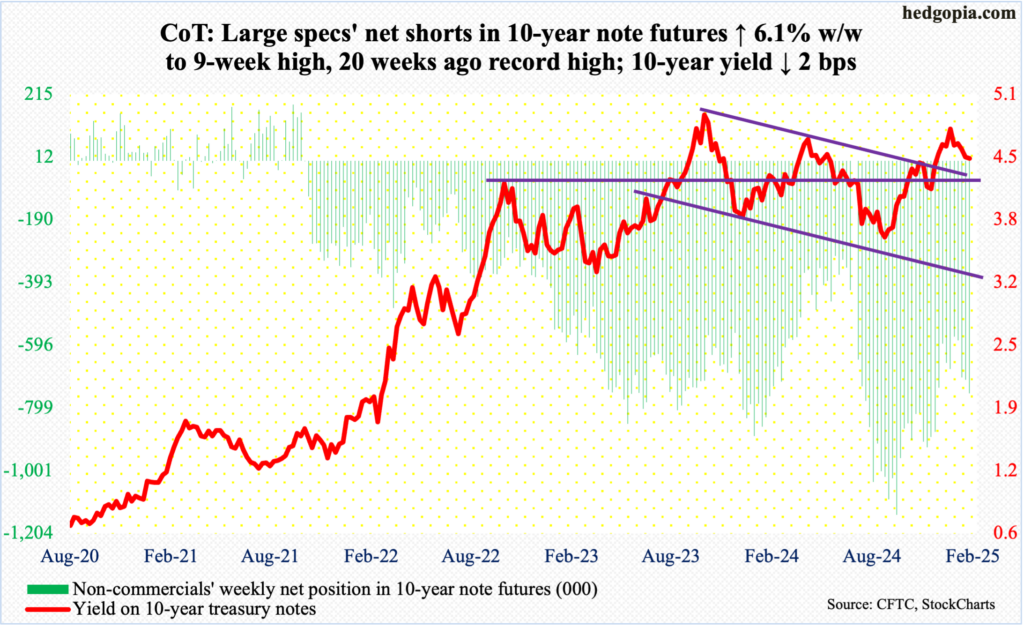
FOMC minutes for the January 28-29 meeting will be out Wednesday. The policy-setting body left the fed funds rate unchanged at a range of 425 basis points to 450 basis points during that meeting. Both the FOMC statement and Chair Jerome Powell at a post-meeting press conference were non-committal about the outlook for interest rates.
Markets back then were expecting two 25-basis-point cuts this year. There was a time they were expecting the Federal Reserve to aggressively lower the rates this year. Now, fed funds futures are pricing in just one 25-basis-point cut. Between that meeting and now, macro data continue to show that the economy is holding up well, even as consumer inflation is proving sticky above the Fed’s two percent goal. Markets last week were spooked by December’s CPI (consumer price index) report.
What this means is that it is highly unlikely the minutes will contain any market-moving data. If anything, Powell just this week told Congress that the central bank is in no rush to lower rates. Given how the fiscal and tariff policies of the Trump administration are likely to shake up the economy, the risk going forward is renewed strength in inflation in the quarters to come.
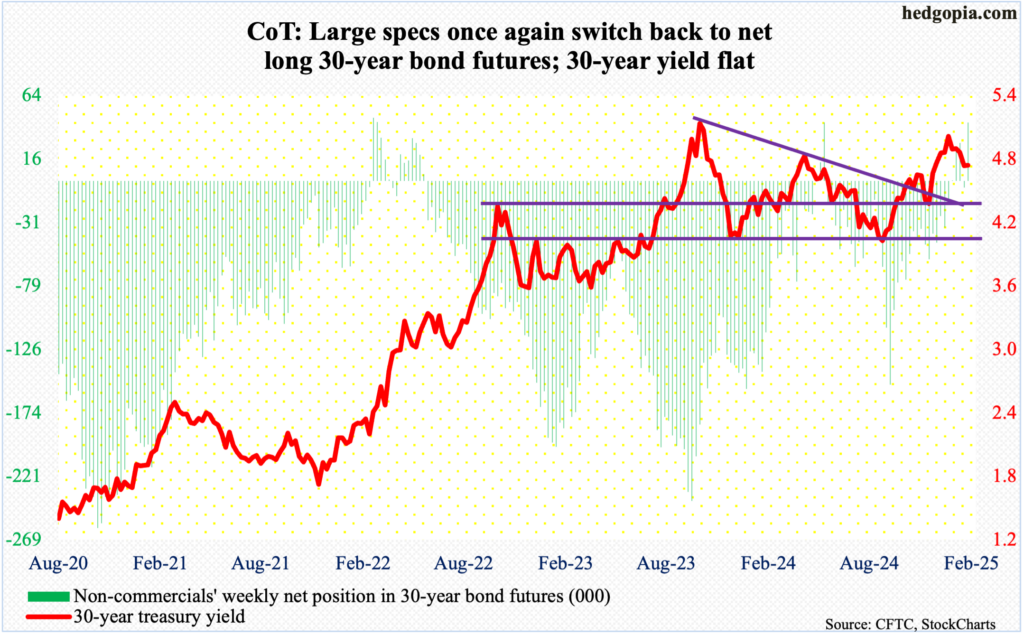
30-year bond: Currently net long 44k, up 48.9k.
Major US economic releases for next week are as follows. Markets are closed Monday for observance of President’s Day holiday!
The NAHB housing market index (February) is due out Tuesday. Homebuilder optimism in January rose a point month-over-month to 47. This was a nine-month high.
Housing starts (January) are scheduled for Wednesday. In December, starts shot up 15.8 percent m/m to a seasonally adjusted annual rate of 1.5 million units – the highest since last February. Last July’s 1.26 million set a four-year low.
Friday brings existing home sales (January) and the University of Michigan’s consumer sentiment index (February).
December sales of existing homes increased 2.2 percent m/m to 4.24 million units (SAAR) – a 10-month high.
Preliminarily in February, consumer sentiment declined 3.3 points m/m to 67.8 – a seven-month low.
WTI crude oil: Currently net long 201.2k, down 14.3k.
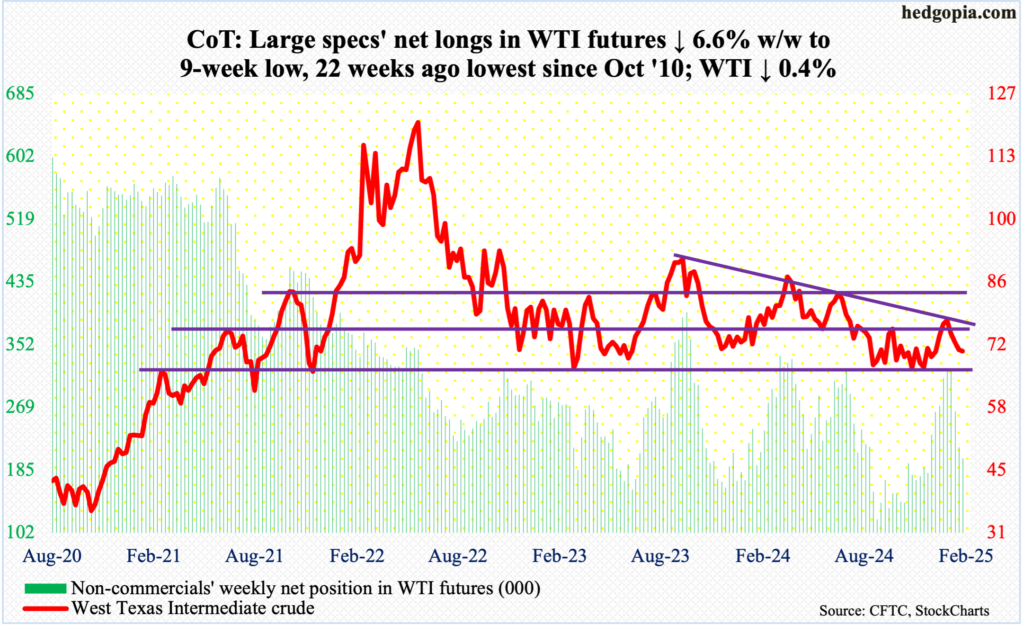
West Texas Intermediate crude for months has been rangebound between $71-$72 and $81-$82 before dropping out of the bottom last September. The range was recaptured as soon as this year began, but sellers showed up mid-January at $79.39.
Last week, it closed at $71. Oil bulls began this week by rallying hard, ticking $73.68 by intraday Tuesday and reclaiming the 50-day. The average ($72.16), however, was lost in the very next session, with the crude remaining under pressure the remaining two sessions, finishing the week at $70.71/barrel, down 0.4 percent for the week.
This was the fifth consecutive weekly drop. Five weeks ago, WTI reversed lower after tagging $79.39 in a shooting star week. The weekly has room to continue lower. In this scenario, even if $71-$72 is breached, bulls can defend a rising trendline from last September’s low and regroup around $68.50.
In the meantime, US crude production in the week to February 7 increased 16,000 barrels per day week-over-week to 13.494 million b/d; output has come under slight pressure since registering a record 13.631 mb/d in the week to December 6. Crude imports dropped 606,000 b/d to 6.3 mb/d. As did gasoline inventory which declined three million barrels to 248.1 million barrels. Crude and distillate stocks, however, increased – up 4.1 million barrels and 135,000 barrels respectively to 427.9 million barrels and 118.6 million barrels. Refinery utilization rose five-tenths of a percentage point to 85 percent.
E-mini S&P 500: Currently net short 17.1k, up 12.3k.
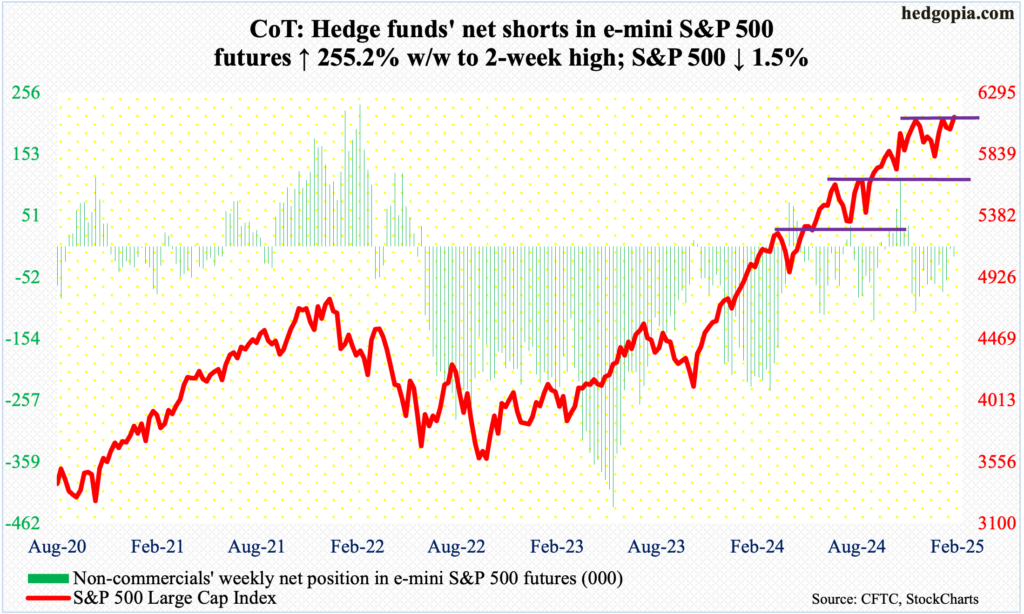
After last week’s dismal failure to hang on to the gains, equity bulls reestablished their fortunes this week. They rallied the S&P 500 1.5 percent and are positioned well for a breakout.
Ending the week at 6115, the large cap index saw bids show up Wednesday as the 50-day was tagged intraday. Bulls have not lost the average on a closing basis in the past month. By Friday – a doji session – the index touched 6127 intraday, which was less than a point lower than the all-time high 6128 posted on the 24th last month.
Horizontal support at 6100 goes back to early December. A breakout is possible if this level is used to accumulate shares.
Euro: Currently net short 64.4k, up 5.8k.
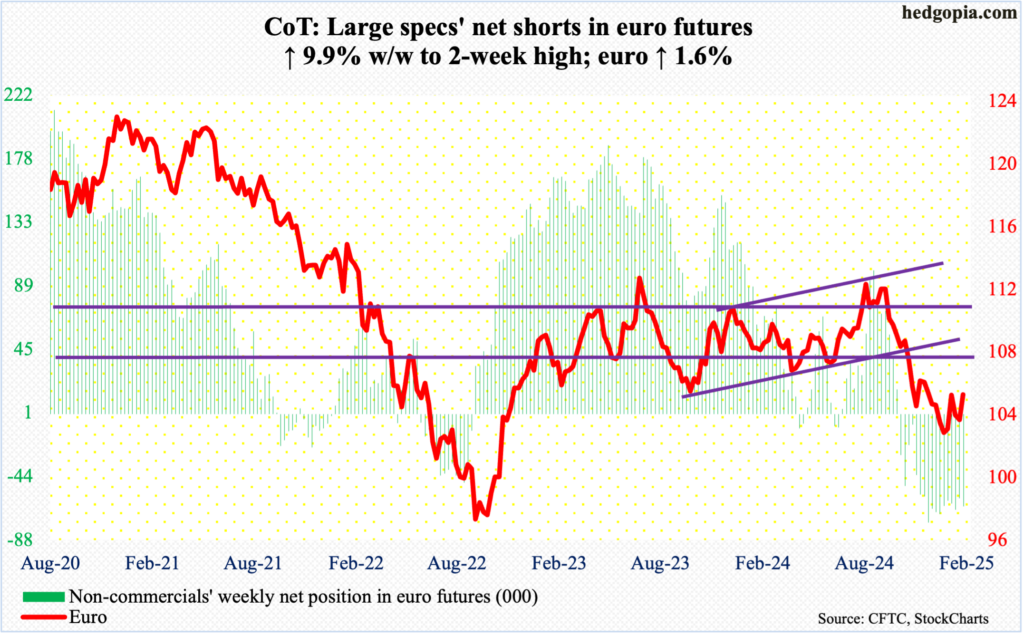
The euro fell sharply starting September 30 (last year) after facing rejection at $1.12 for six consecutive weeks. It started to stabilize early this year around $1.02s, which was defended for a whole month before showing some life last week. This continued this week.
For a rally to occur, euro bulls needed to defend – or regroup around – $1.03, and this is precisely what happened in the first two sessions this week. In the end, the currency jumped 1.6 percent for the week to $1.0491.
In the sessions ahead, bulls’ mettle will be tested. Horizontal resistance at $1.05 goes back at least a decade. Once this gives way, the path becomes easier toward the 200-day at $1.0749.
Gold: Currently net long 284.5k, down 18k.
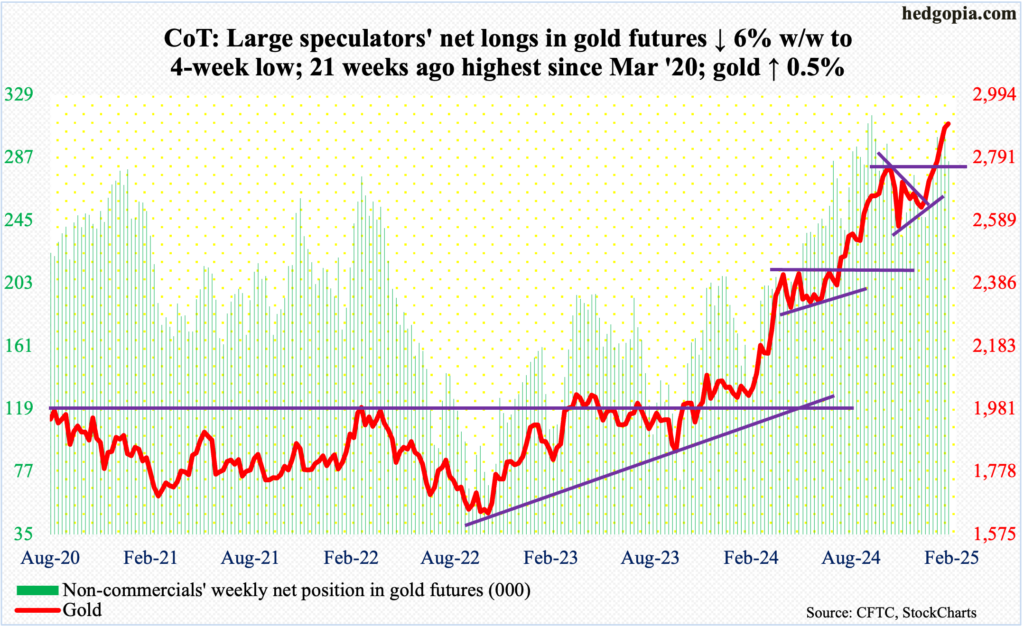
Gold’s upward momentum continued this week, but not before showing signs of fatigue. Up 0.5 percent this week to $2,901/ounce, it has rallied for seven consecutive weeks. The metal ticked $2,608 on December 30.
The yellow metal essentially went parabolic for a month and a half. This likely is coming to an end – not the move itself but the parabolic side to it. This Tuesday – a spinning top session – gold rallied as high as $2,969, but the bulls failed to keep the gains. As a result, a shooting star developed on the weekly. Weakness lies ahead.
Gold remains overbought on several timeframes. Ahead lies a crucial breakout retest at $2,800. After this, there is support at $2,750s, and $2,540s-50s and $2,440s-50s after that.
Nasdaq (mini): Currently net long 13.4k, down 5.5k.
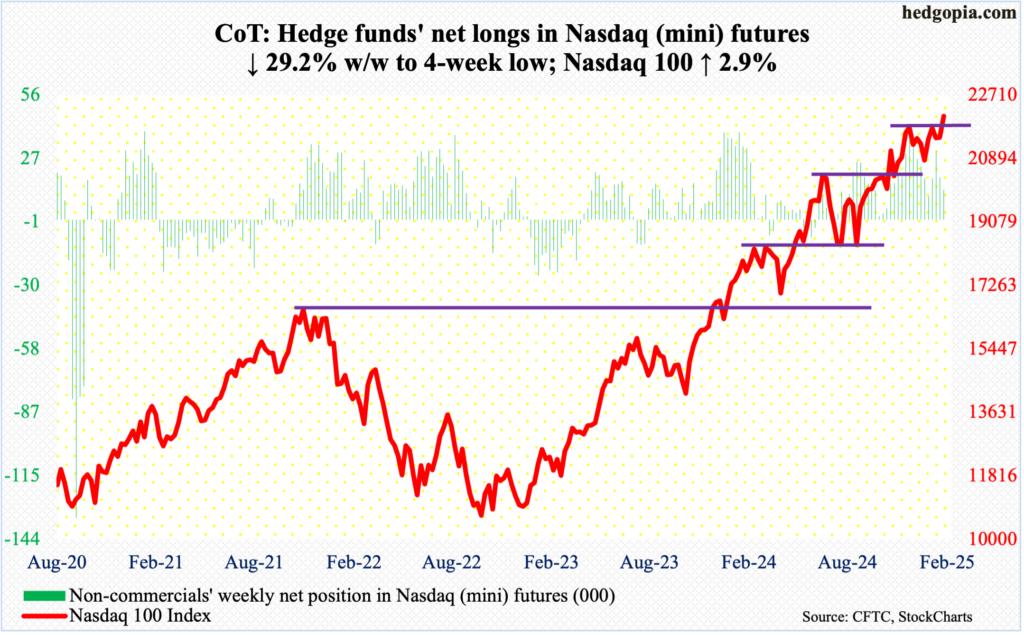
The Nasdaq 100 is back at its prior high from mid-December. On the 16th that month, it ticked 22133 intraday before coming under pressure and dropping to 20538 by the 13th last month. The rally since has seen its share of ups and downs but was also characterized by higher lows.
This Wednesday, bids showed up at the 50-day. By Friday, the December high was surpassed by six points, ticking 22139 intraday, closing the week at 22115, up 2.9 percent. This is as good an opportunity as any for tech bulls to stage a breakout, and they likely will succeed in the sessions ahead.
Russell 2000 mini-index: Currently net short 32.5k, up 5k.
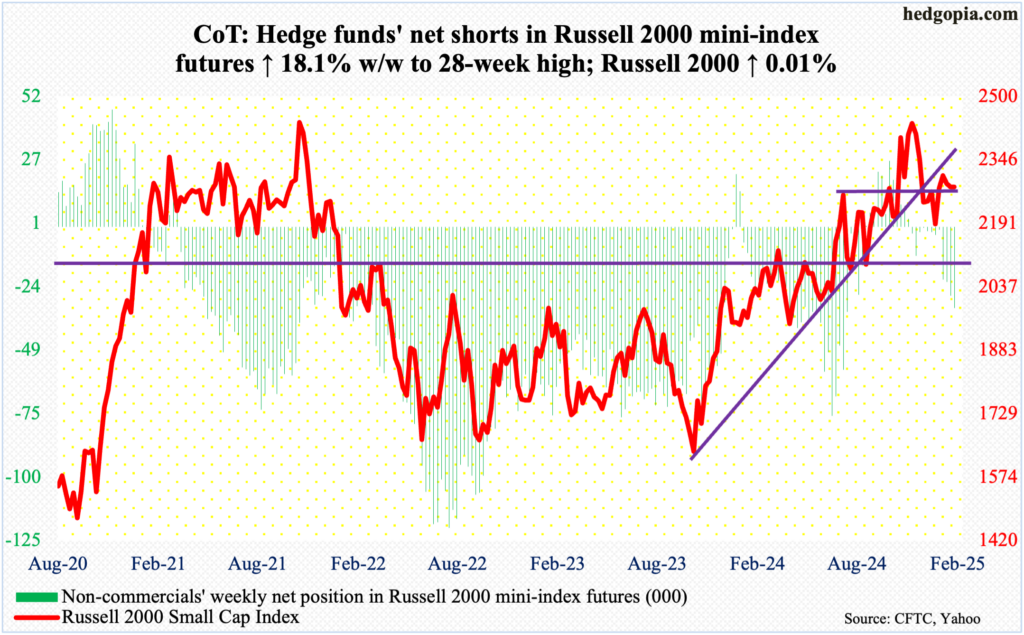
Small-cap bulls, on the other hand, disappointed this week. The Russell 2000 only eked out a gain of 0.01 percent to 2280 – essentially flat. Bids did show up Wednesday at the bottom of a nearly-two-month rising channel, but this was hardly enough for the bulls to recharge. In fact, they could not even seriously go after 2320s which had attracted offers the prior three weeks.
This is taking place at a time when the 50-day is beginning to point lower and the daily Bollinger bands are tightening. The risk going forward is a breach of 2260s, which going back to mid-July last year has witnessed a tough bull-bear duel.
US Dollar Index: Currently net long 15.3k, up 757.
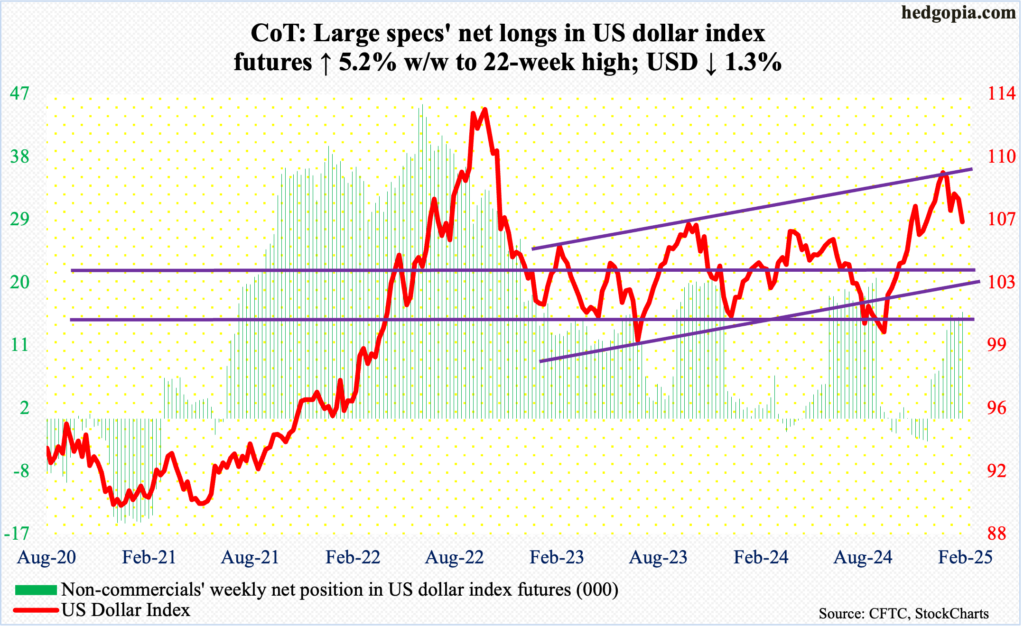
It is now becoming apparent that the two-plus-year intraday high of 110.02 posted on the 13th last month is here to stay – at least for a while. After going sideways for three weeks since that high, the US dollar index broke down this week – kind of.
Down 1.3 percent this week to 106.57 – fourth down week in five – dollar bulls were unable to defend horizontal support at 107.
Earlier, the index has had a massive rally since September 27 (last year) when it bottomed at 99.86, after having gone sideways just under 100 for several sessions, before rallying in 14 out of 15 weeks.
The 50-day at 107.78 has been compromised, and the 200-day lies at 104.72.
VIX: Currently net short 59k, up 10.5k.
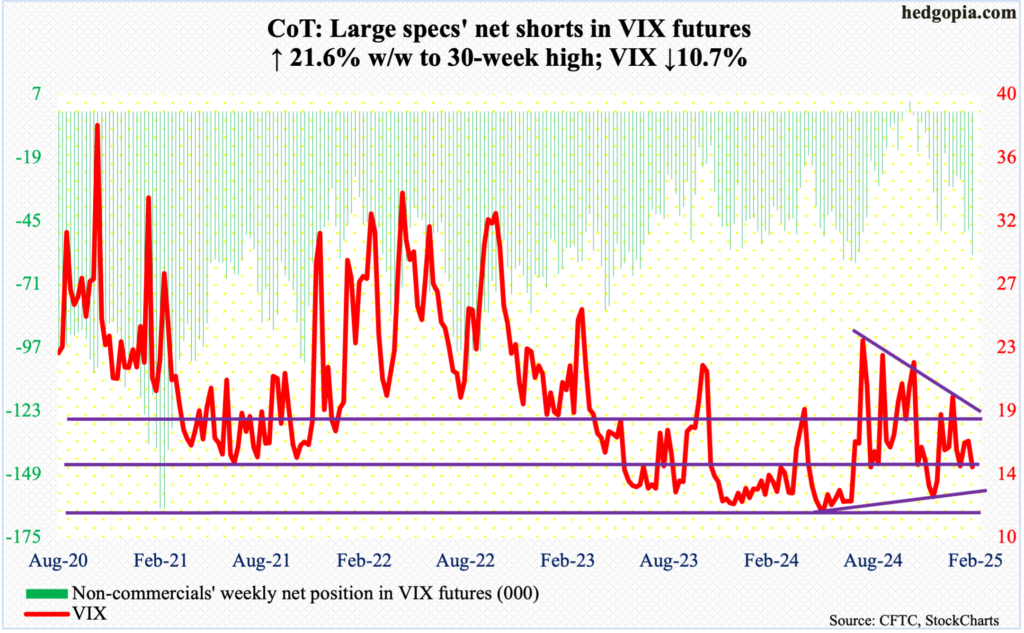
VIX remains oversold, but volatility bulls are struggling to mount a rally.
On December 28, it jumped as high as 28.32 intraday, but only to then come under pressure, and this was followed by lower highs, including the 20.42 print posted on the 3rd this month.
Since that December high, VIX has not broken 14. As a matter of fact, 14.50s have provided support since last year’s Boxing Day. It is currently a stone’s throw away from that, closing this week at 14.77. It just feels like volatility for now is headed for further contraction toward the 13 handle.
Thanks for reading!
