
Following futures positions of non-commercials are as of February 18, 2025.
10-year note: Currently net short 709.5k, down 41.5k.

FOMC minutes for the January 28-29 meeting contained some interesting tidbits, including members’ citation of the possible effects of potential changes in the Trump administration’s trade and immigration policy and the accompanying upside risks to the inflation outlook. Translation: rate cuts are firmly on hold.
The fed funds rate was left unchanged at a range of 425 basis points to 450 basis points in that meeting. Prior to that, it was lowered by 100 basis points from last September.
When the minutes were released on Wednesday, markets were expecting one 25-basis-point cut this year. Then came Friday, when weakness was noticed in some macro data as well as in consumer sentiment data. As a result, fed funds futures immediately priced in at least two cuts by the end of the year.
It is tough guessing how things will shake out in the next few weeks, let alone for the remainder of the year or the next four years. If there is any certainty, it is that it will be volatile and that, given what we know now in terms of the fiscal and tariff policies of the new administration, inflation will continue to be sticky, and this is likely to tie the Fed’s hands.
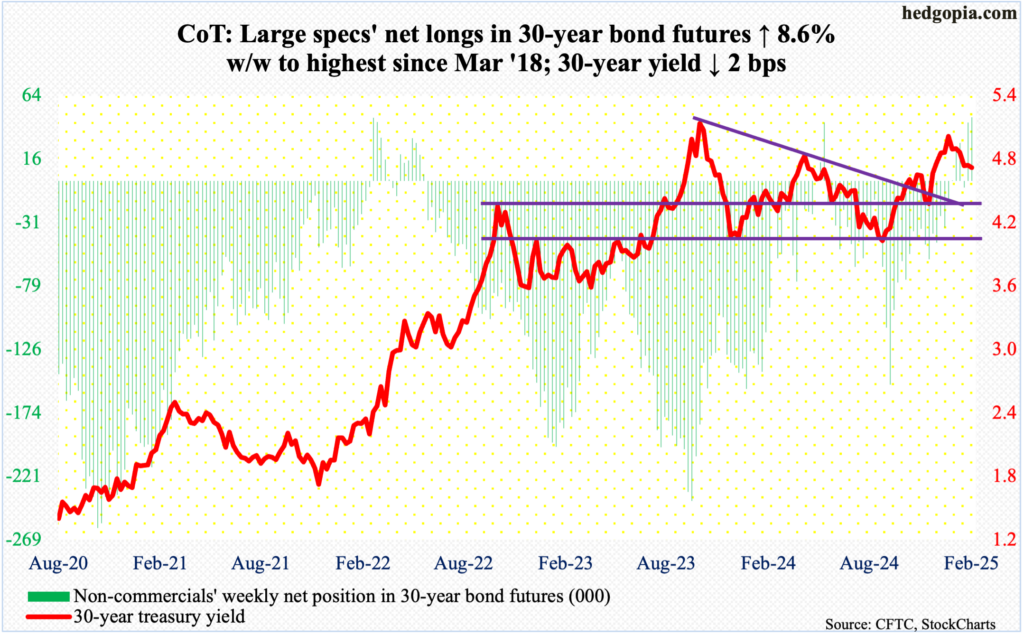
30-year bond: Currently net long 47.8k, up 3.8k.
Major US economic releases for next week are as follows.
The S&P Case-Shiller home price index (December) is on schedule for Tuesday. In November, home prices nationally were up 3.8 percent year-over-year.
New home sales (January) are due out Wednesday. December sales rose 3.6 percent month-over-month to a seasonally adjusted annual rate of 698,000 units – a three-month high.
Thursday brings durable goods orders (January) and GDP (4Q24, 2nd print).
Orders for non-defense capital goods ex-aircraft – proxy for business capex plans – grew 0.4 percent m/m in December to $74.7 billion (SAAR). This set a new record.
The advance print showed real GDP increased at an annualized rate of 2.3 percent in the fourth quarter last year – a three-quarter low.
Personal income/spending (January) is scheduled for Friday. In the 12 months to December, headline and core PCE (personal consumption expenditures) rose 2.6 percent and 2.8 percent respectively. They respectively peaked in 2022 at 7.3 percent (June) and 5.7 percent (February). Most recently, they bottomed at 2.1 percent (last September) and 2.6 percent (last June).
WTI crude oil: Currently net long 175.6k, down 25.6k.
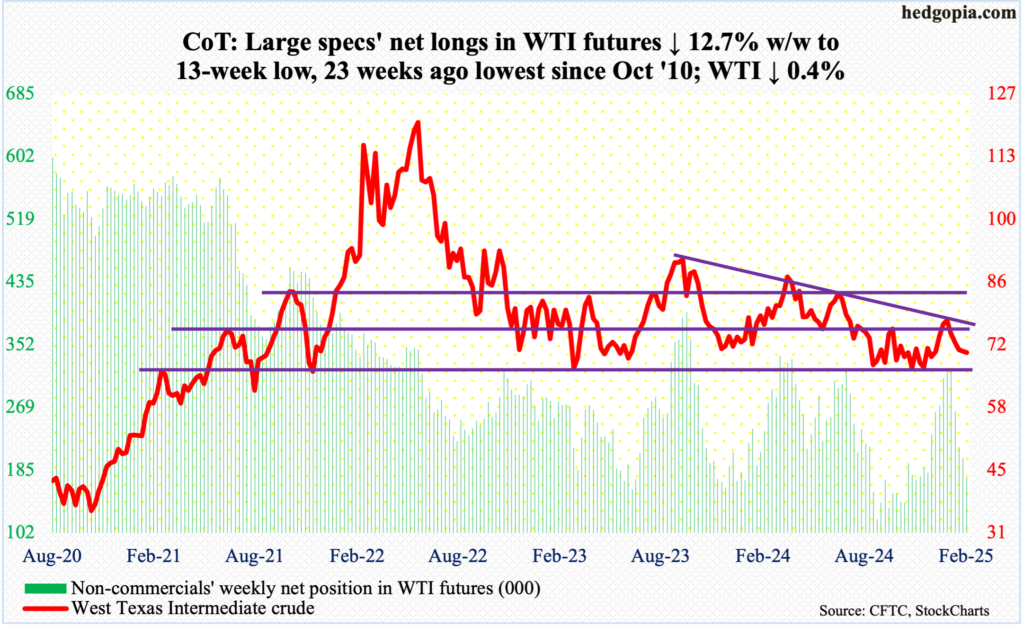
Last week, West Texas Intermediate crude ticked $73.68 intraday Tuesday before reversing lower, ending the week with a shooting star. This week, a similar candle formed on the weekly with a high of $73.14 on Thursday. As a matter of fact, until Thursday’s close, the crude was up 2.5 percent for the week. Friday’s 2.9-percent tumble turned this into a week of down 0.4 percent to $70.40/barrel.
This was the sixth consecutive weekly decline. Six weeks ago, WTI reversed lower after tagging $79.39 in a shooting star week. Sellers showed up before reaching the upper bound of a well-established range. For months, it has been rangebound between $71-$72 and $81-$82 before dropping out of the lower bound last September. The range was recaptured as soon as 2025 began.
If $70 is breached – likely – oil bulls can defend a rising trendline from last September’s low and regroup around $68.50.
In the meantime, US crude production in the week to February 14 increased 3,000 barrels per day week-over-week to 13.497 million b/d; output has come under slight pressure since registering a record 13.631 mb/d in the week to December 6. Crude imports dropped 489,000 b/d to 5.8 mb/d. As did gasoline and distillate inventory which declined 151,000 barrels and 2.1 million barrels respectively to 247.9 million barrels and 116.6 million barrels. Crude stocks, however, increased 4.6 million barrels to 432.5 million barrels. Refinery utilization fell one-tenth of a percentage point to 84.9 percent.
E-mini S&P 500: Currently net short 40k, up 22.9k.
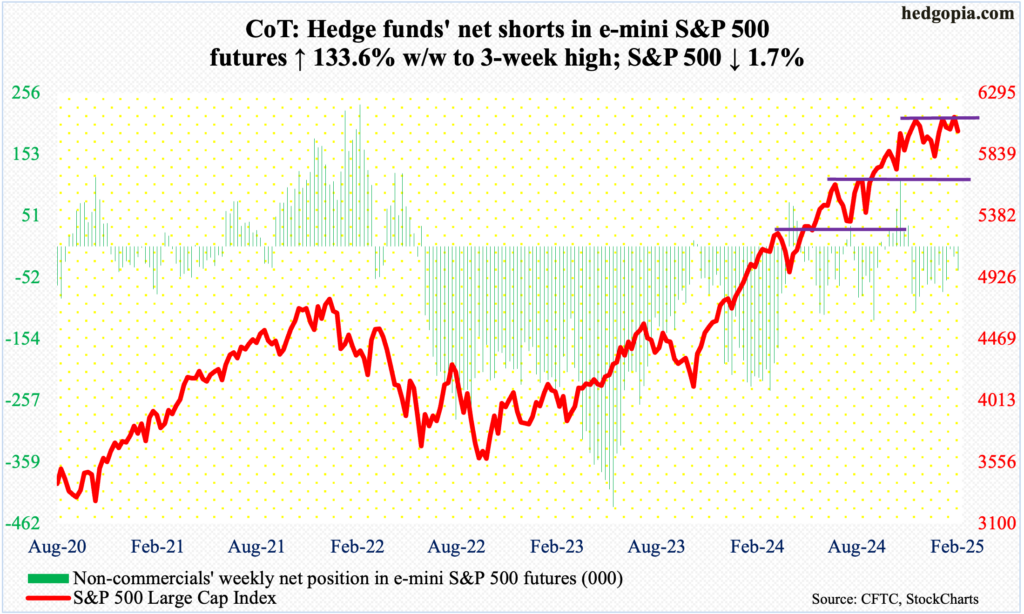
As expected (more on this here), the S&P 500 did break out of 6120s this week. This occurred on Wednesday, with the large cap index registering a new intraday high of 6147. But the move was fleeting. Thursday saw some selling, which picked up steam on Friday. Up 0.05 percent until Thursday’s close, the index ended the week down 1.7 percent to 6013. Friday’s brutal selloff landed the index right on the 50-day (6010). A breach of the average, which is no longer rising, looks probable. On a closing basis, this will have taken place for the first time since January 17.
There is horizontal support at 5870s, followed by another layer of support at 5770s. The 200-day – still rising – rests at 5702.
Euro: Currently net short 51.4k, down 13k.
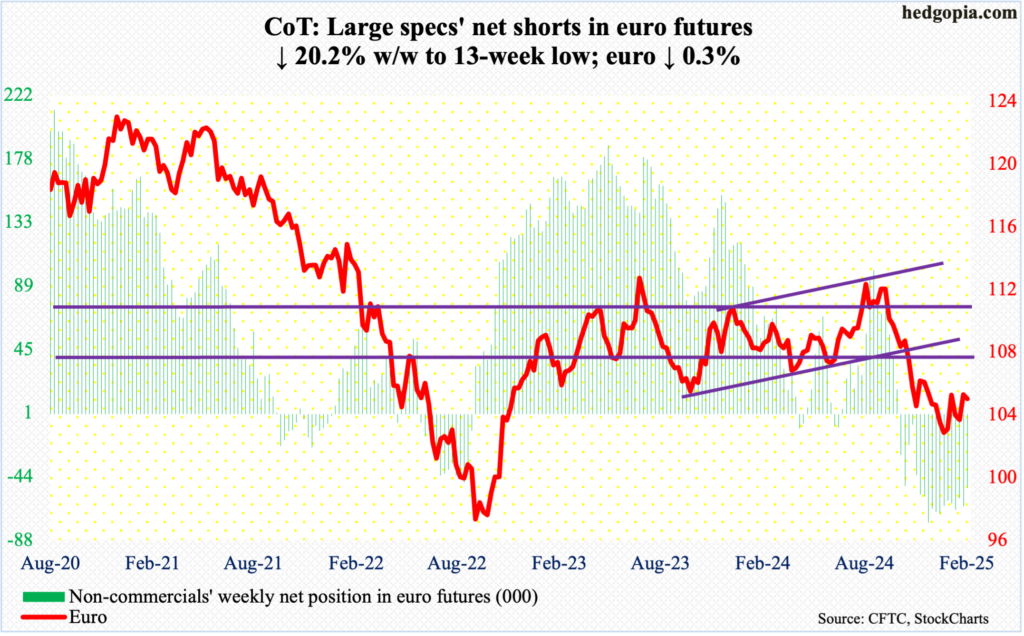
Non-commercials have been reducing their net shorts since hitting 75,573 contracts in the week to December 10. This week, holdings reached a 13-week low. The euro, on the other hand, is hitting a roadblock.
On December 6, the currency ticked $1.063 and went the other way. Even before that, the euro fell sharply starting September 30 (last year) after facing rejection at $1.12 for six consecutive weeks. It started to stabilize early this year around $1.02s, which was defended for a whole month.
The rally that followed stopped at $1.05, which goes back at least a decade. This level has been hit in four of the last five weeks, including this Monday’s $1.0507, Thursday’s $1.0512 and Friday’s $1.0505. It increasingly looks like this resistance will hold for now.
There is lateral support at $1.03, which the bulls can use to regroup.
Gold: Currently net long 268.7k, down 15.8k.
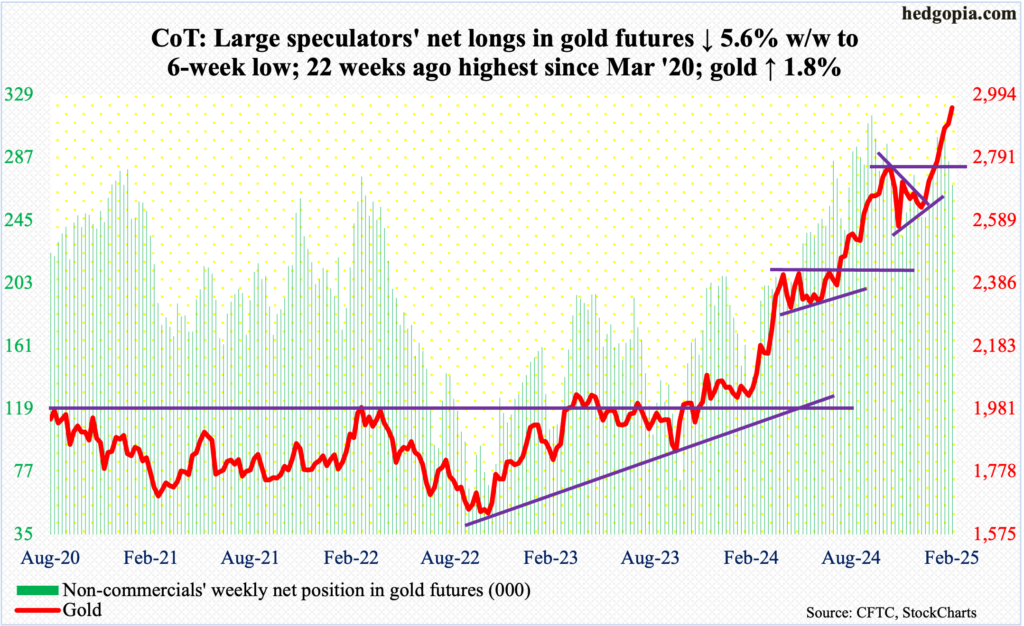
Gold bugs are clearly not in a mood to catch their breath. They have been rallying the metal since it ticked $2,608 on December 30. This week, it rallied 1.8 percent to $2,953/ounce. This was the eighth week in a row of positive weekly gains.
The yellow metal touched as high as $2,973 intraday Thursday – just past last week’s high of $2,969.
Concurrently, in five of the last eight sessions, gold has found sellers at $2,960s. Not surprisingly, the technicals are overbought – the daily particularly. Continued failure at this resistance will open the door toward a crucial breakout retest at $2,800. After this, there is support at $2,750s, and $2,540s-50s and $2,440s-50s after that.
Nasdaq (mini): Currently net long 9.8k, down 3.6k.
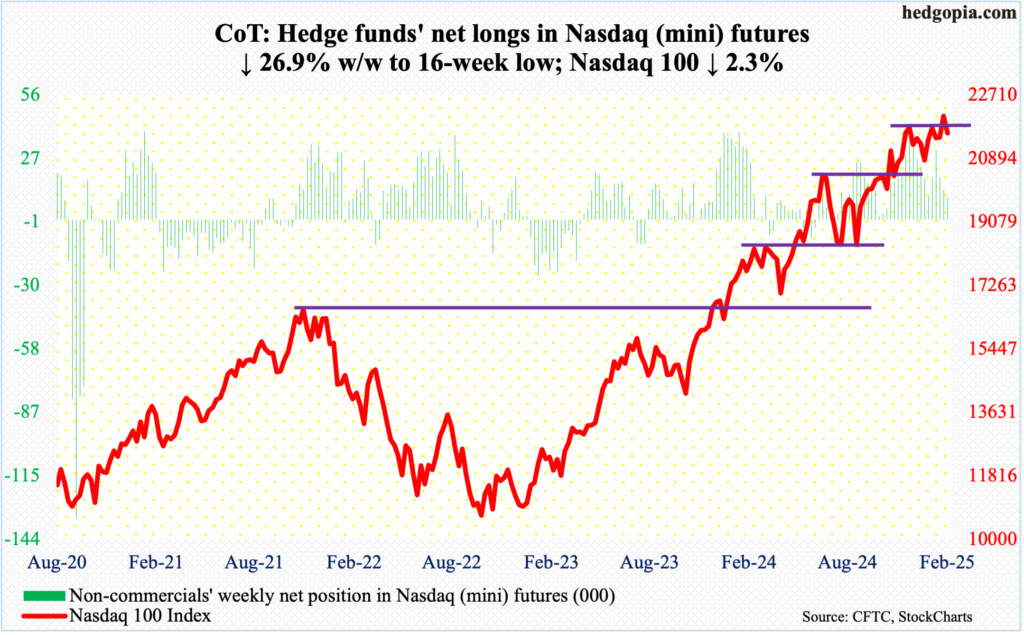
Next Wednesday, Nvidia (NVDA) reports its January quarter. It is a highly anticipated report, and, not surprisingly, it is a make-or-break not only for the company but for the entire stock market. NVDA makes up of 8.4 percent of the Nasdaq 100 and 6.6 percent of the S&P 500.
Ahead of this, as was the case with the S&P 500, the tech-heavy index did break out to a new high on Wednesday tagging 22223 – past the prior high of 22133 from December 16 – but momentum soon fizzled out. By Friday, a session in which it gave back 2.1 percent, the index finished down 2.3 percent for the week to 21614 – just above the 50-day at 21520.
There is decent horizontal support at 20500s.
Russell 2000 mini-index: Currently net short 29.8k, down 2.7k.
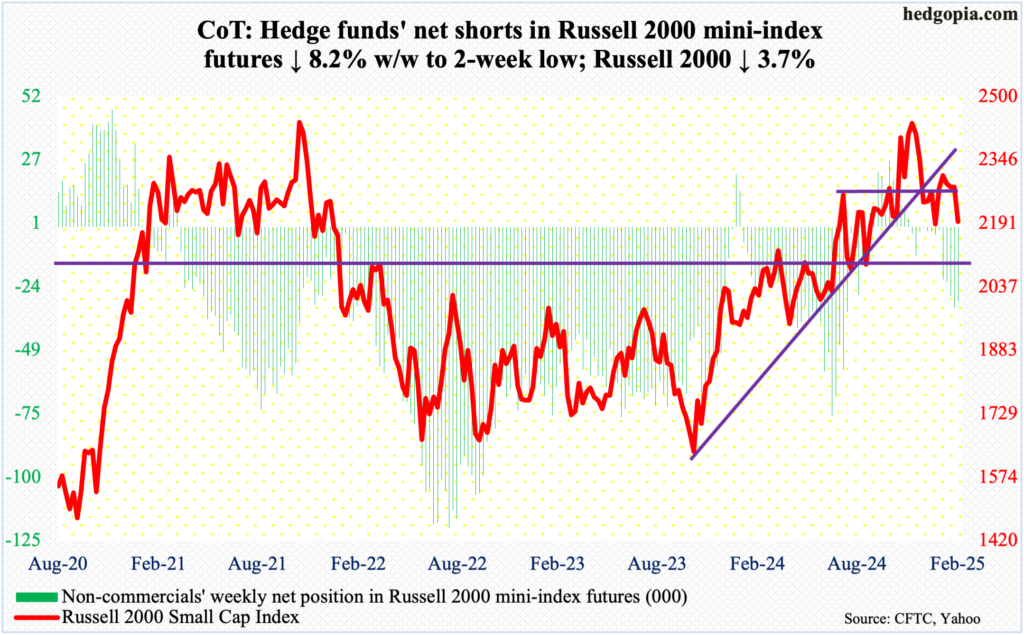
Small-caps were already on the back foot going into this week, and the downward momentum continued. The Russell 2000 declined 3.7 percent this week to 2195, losing straight-line support at 2260s, which goes back to mid-July last year, and dropping out of a two-month-old ascending channel.
This week’s action follows a new all-time high of 2466 on November 25 – just past the prior high of 2459 from three years ago; in the week the new high was posted, a spinning top showed up on the weekly.
Most recently, small-cap bulls consistently faced trouble at 2320s. A breakout retest at 2100, which the Russell 2000 broke out of last July and successfully retested in September, probably lies ahead.
US Dollar Index: Currently net long 16.8k, up 1.5k.
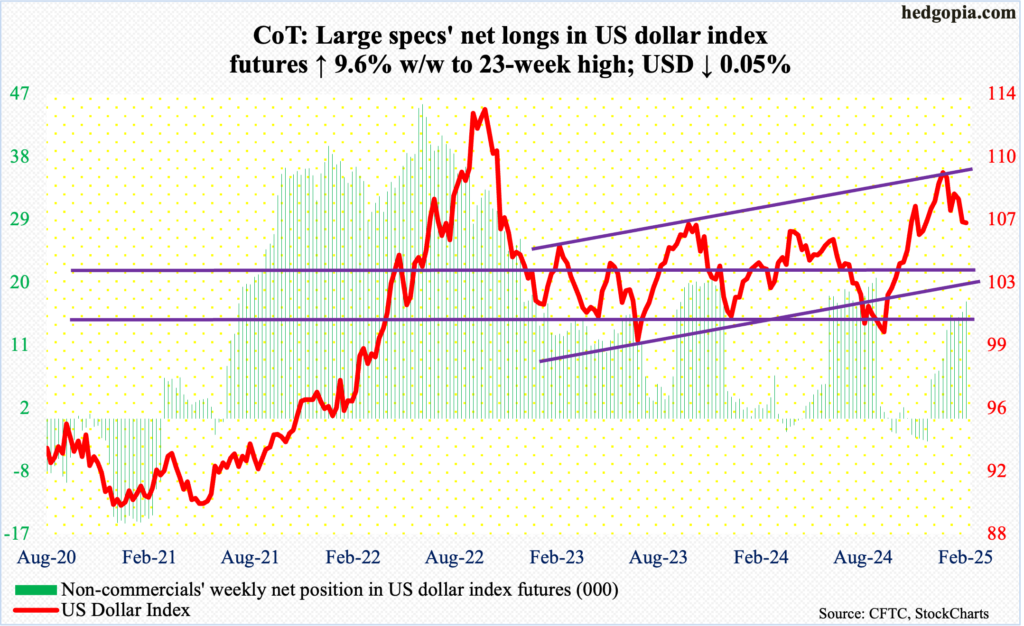
A somewhat volatile week essentially ended flat. The US dollar index, with an intraday high of 107.28 (Wednesday) and a low of 106.23 (Thursday), closed the week lower 0.05 percent to 106.52.
The index is now down three weeks in a row – and in four out of five. On the 13th last month, it posted a two-plus-year intraday high of 110.02. After going sideways for three weeks since that high, the US dollar index broke down last week, as dollar bulls were unable to defend horizontal support at 107. This week, they went after that hurdle in the first four sessions – unsuccessfully. So, for now, this is the one to watch. Inability to recapture 107 as soon as possible raises the odds that the index is headed toward 105.30s, with the 200-day at 104.78.
VIX: Currently net short 57.7k, down 1.3k.
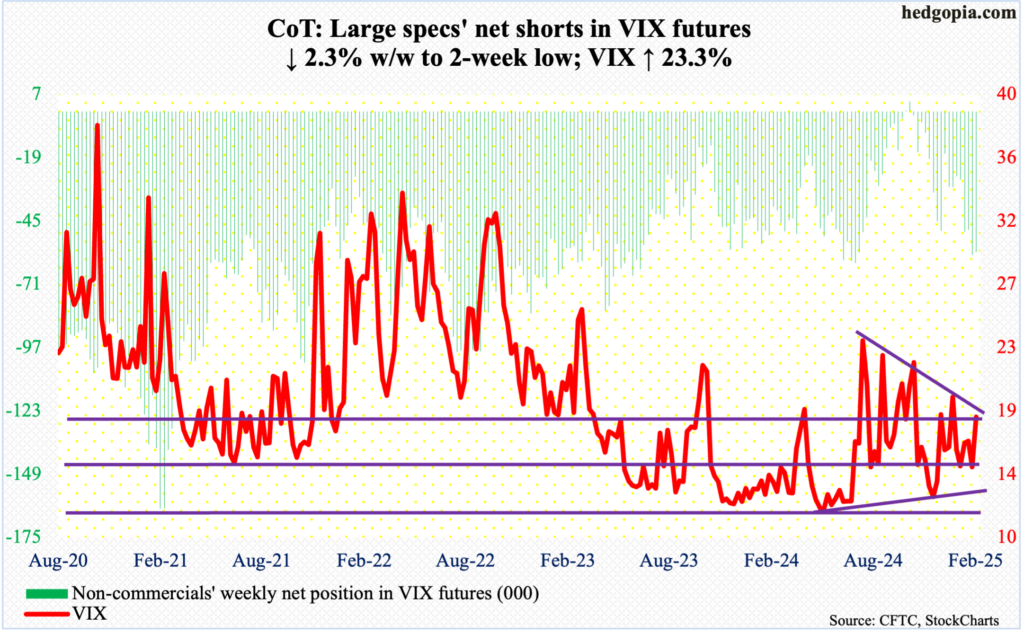
On December 28, VIX jumped as high as 28.32 intraday before coming under pressure, but it never breached 14, even as the S&P 500 went on to post newer highs. This feat remained intact this week, with a weekly low of 15.05 occurring on Wednesday and a high of 19.03 on Friday. For the week, it added 3.44 points to 18.21.
There is room to rally on both the daily and weekly. Since last September, 23 – or thereabouts – has posed difficulty for volatility bulls. This level is the path of least resistance for now.
Thanks for reading!
