
Following futures positions of non-commercials are as of March 31, 2026.
10-year note: Currently net short 784.1k, up 142.2k.
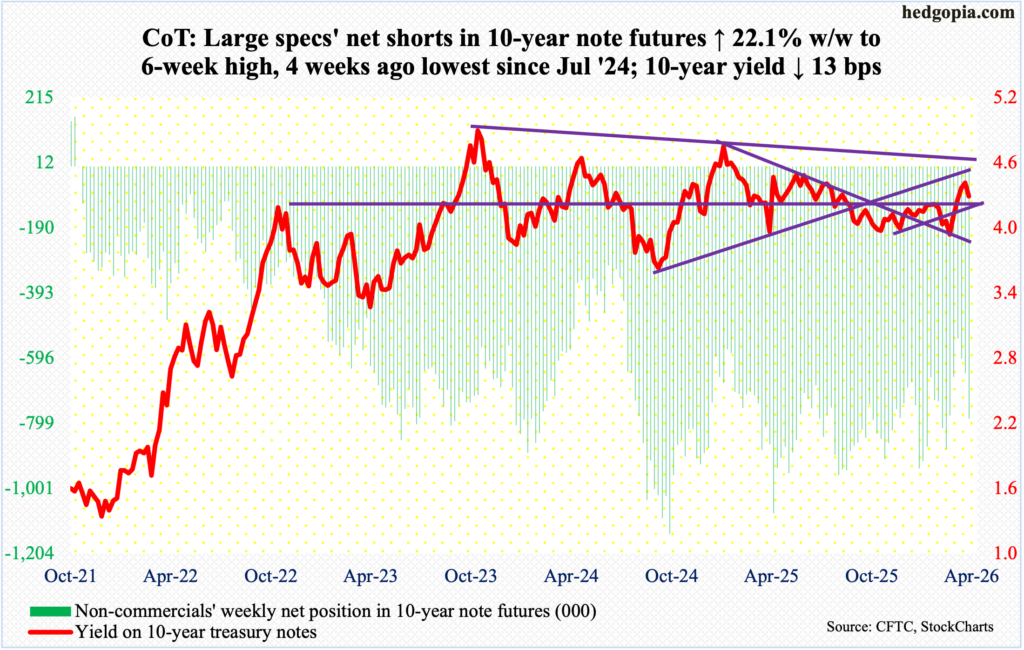
Minutes of the March 17-18 FOMC meeting are due out Wednesday. Markets do not expect these minutes to contain anything earth-shattering. Futures traders have gone from expecting two 25-basis-point cuts this year to none; as a matter of fact, the probabilities for a hike later this year have gone up to low-double-digits, rising to 24 percent by the March meeting next year. These traders do not expect a cut until September next year. The fed funds rate currently stands at a range of 350 basis points to 375 basis points.
At last month’s meeting, Chair Jerome Powell explicitly said the Iran conflict – still ongoing – would push up near-term inflation. In this scenario, the longer this sustains, it is just a matter of time the rise in energy prices manages to creep into the core. In this environment, it is only fitting the Fed errs on the side of caution and enters a holding pattern – neither tightening nor loosening – and the minutes should reflect this caution.
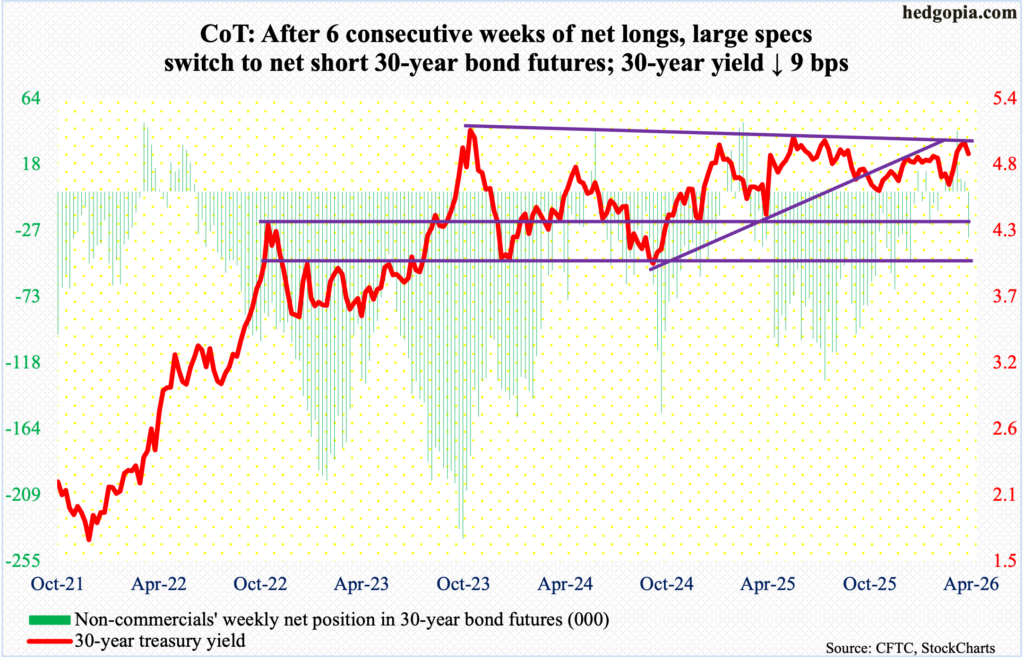
30-year bond: Currently net short 31.6k, up 38.2k.
Major US economic releases for next week are as follows.
Durable goods orders (February) are due out Tuesday. Orders for non-defense capital goods ex-aircraft – proxy for business capex plans – inched up 0.1 percent month-over-month in January to a seasonally adjusted annual rate of record $79.3 billion.
Personal income/spending (February), GDP (4Q25, 2nd revision) and corporate profits (4Q25) are on schedule for Thursday.
In the 12 months to January, headline and core PCE (personal consumption expenditures) increased 2.8 percent and 3.1 percent respectively. They have been rising since bottoming in April last year at 2.3 percent and 2.6 percent, in that order, with core PCE at a 22-month high in January.
The second estimate showed real GDP growth in 4Q25 decelerated to 0.7 percent (SAAR) from 4.4 percent in 3Q25.
In the September quarter, corporate profits adjusted for inventory valuation and capital consumption jumped 9.3 percent from a year ago to $4.1 trillion (SAAR) – a record.
Friday brings the consumer price index (March) and University of Michigan’s consumer sentiment index (April, preliminary).
Versus 12 months ago, headline and core CPI increased 2.4 percent and 2.5 percent in February respectively, with the latter the lowest since March 2021.
Consumer sentiment tumbled 3.3 points m/m in March to 53.3. A record low 50 was registered in June 2022.
WTI crude oil: Currently net long 168.5k, down 28.9k.
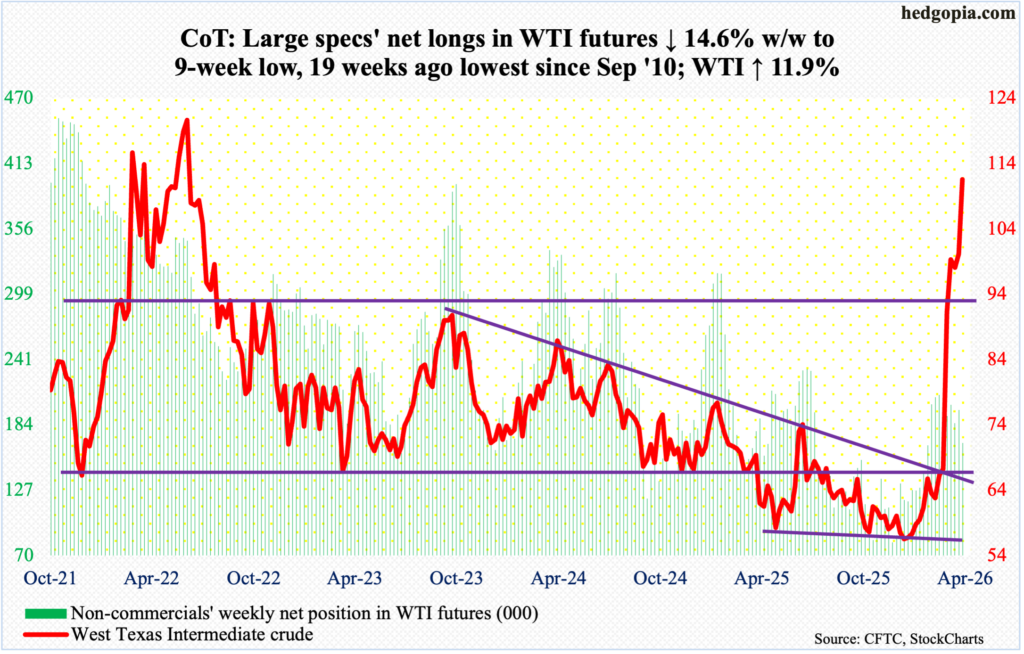
For the second week running. West Texas Intermediate crude rose all along the sharply rising 20-day moving average, with almost all the weekly gains of 11.9 percent to $111.54/barrel coming on Thursday when it rallied 11.4 percent. WTI remains below the four-year high $119.48 registered on 9 March, which likely gets tested in the sessions ahead.
There is acute tightness currently in the physical supply of crude, thanks to Iran’s closure of the Strait of Hormuz, which pre-war accounted for transit of about 20 percent of global supplies. The futures curve is in backwardation, with futures prices for May, June delivery much lower than in the spot. Arguably, this is not reflecting the scale of the supply disruption. Even if the war ends tomorrow, crude prices are likely to have a higher floor as demand for stockpiling goes up, not to mention a rise in insurance costs thanks to an upward pressure on geopolitical risk premium. The longer the conflict continues, the higher the odds of an adverse impact on end-demand, which will then put downward pressure on prices.
In the meantime, as per the EIA, US crude production in the week to March 27 was unchanged week-over-week to 13.657 million barrels per day; output registered a record 13.862 mb/d in the week to November 7 last year. Crude imports decreased 10,000 b/d to 6.5 mb/d. As did gasoline and distillate inventory, which respectively declined 586,000 barrels and 2.1 million barrels to 240.9 million barrels and 117.8 million barrels. Stocks of crude increased 5.5 million barrels to 461.6 million barrels. Refinery utilization declined eight-tenths of a percentage point to 92.1 percent.
E-mini S&P 500: Currently net short 42.5k, down 38.4k.
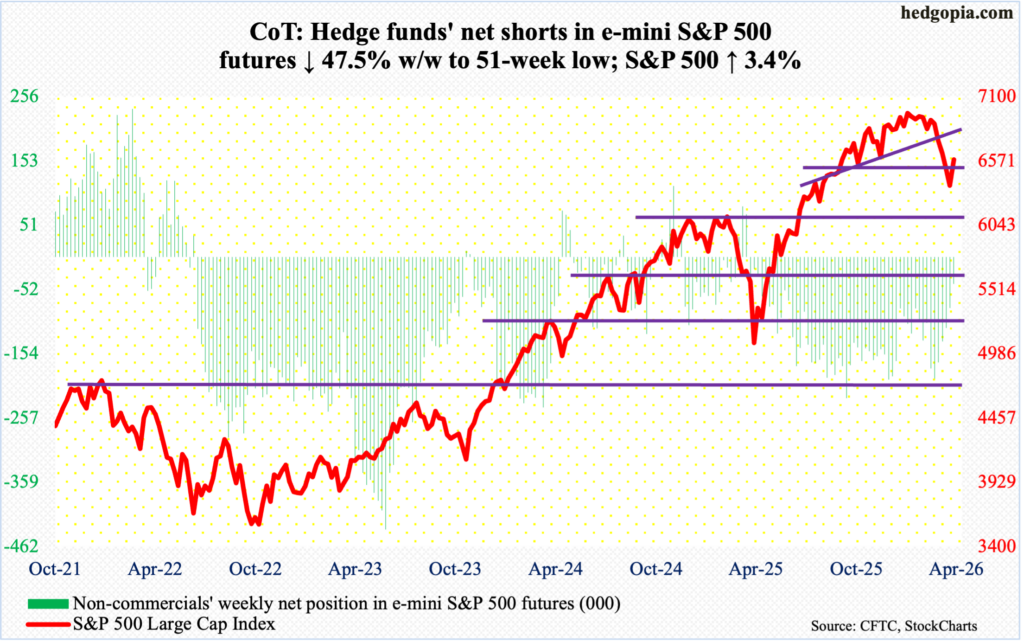
Non-commercials are actively reducing their net short exposure, with holdings at a 51-week low in the latest week. At some point, this must help the longs. The cash, down 9.9 percent from the all-time high 7002 posted on 28 January through Monday’s low 6317, shot up 3.4 percent for the week to 6583. This was the first up week in six – and second in nine.
Interestingly, Thursday’s trading opened with a loss of 100 points in the opening minutes, but only to be embraced by longs at resistance-turned-support 6470s, ending the session up seven-plus points.
To get further traction, bulls now need to win over dual resistance – horizontal at 6630s and the 200-day at 6645.
Euro: Currently net long 507, down 8.8k.
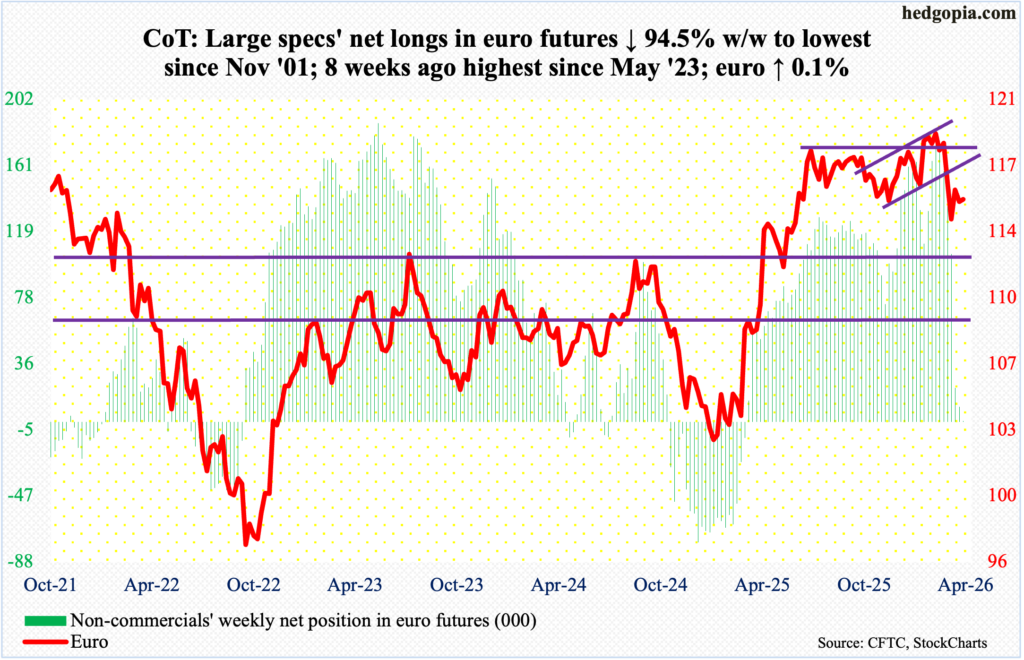
Non-commercials have all but given up, with net longs down from 180,305 contracts in the week to 10 February to the latest 507. They have not been net short in 13 months.
From euro bulls’ perspective, even as non-commercials were aggressively cutting back on their bullish exposure, the currency has found some footing around $1.15s. This week, the euro inched up 0.1 percent to $1.152.
The euro has been under pressure since 27 January when it reversed lower after tagging a four-and-a-half-year high $1.208; in the week that reversal occurred, a weekly gravestone doji formed. In January last year, the currency bottomed at $1.018.
Longs this week were unable to hang on to Wednesday’s session high $1.163, with the 200-day at $1.168. The session low $1.141 from 13 March deserves watching.
Gold: Currently net long 163.2k, down 5.1k.
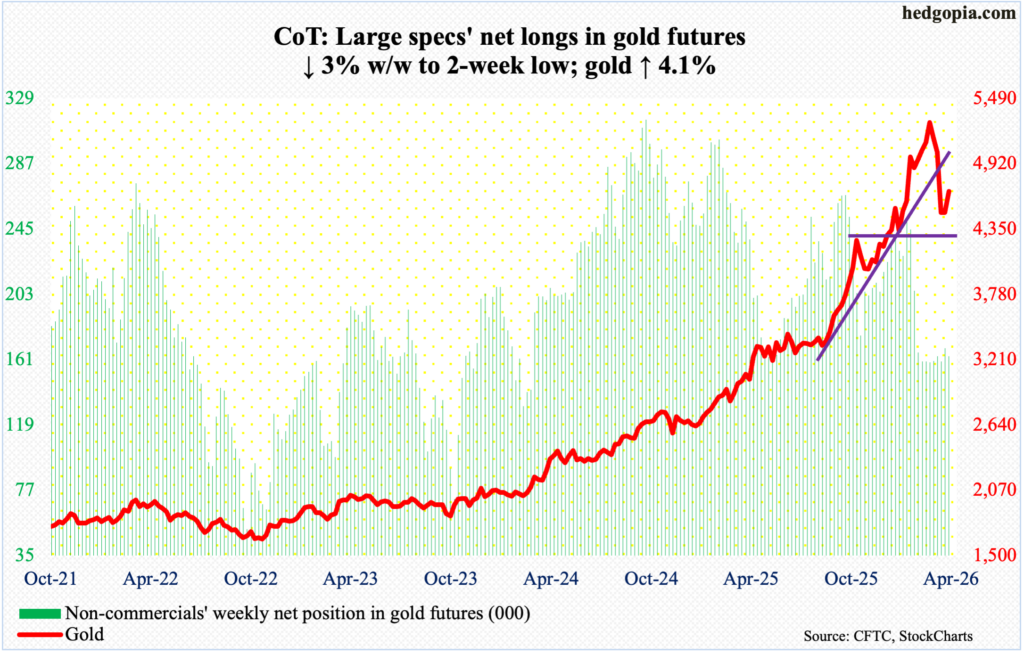
Gold, up 4.1 percent this week to $4,677/ounce, remains sandwiched between the 200- and 50-day. On 29 January, the metal peaked at $5,608, subsequently bottoming at $4,099 on 23 March just above the slightly rising 200-day (now $4,120).
The 50-day at $4,950 can act as a magnet but for that gold bugs will need to regain momentum. On the daily, the RSI just turned slightly lower from the median. In the event the yellow metal comes under selling pressure, there is important straight-line support at $4,540s, followed by $4,370s.
Nasdaq (mini): Currently net long 20.6k, up 14k.
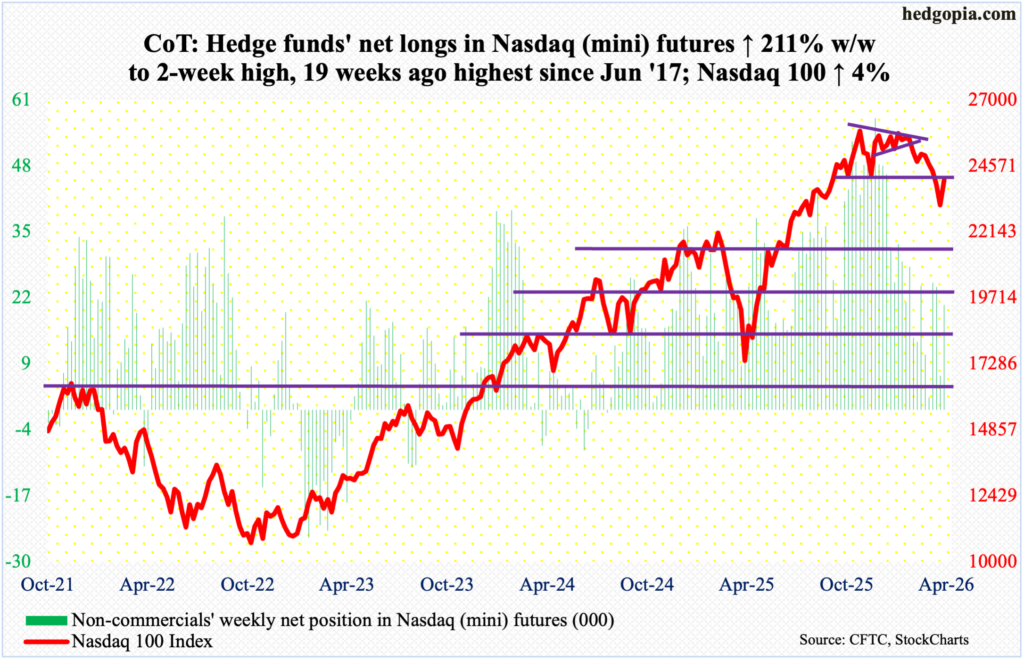
Lateral support at 22900s was slightly breached on Monday as the session tagged 22841 intraday; by then, the Nasdaq 100 was down 12.8 percent from the all-time high 26182 recorded on 29 October. Selling accelerated after facing rejection on 28 January coming within 17 points of that high. Going into this week, including the week in which that rejection took place, the tech-heavy index had been down in eight of nine weeks.
After all this selling, the Nasdaq 100 rallied four percent this week to 24046, essentially closing right at horizontal resistance, a takeout of which will open the door toward the 200-day at 24448, which also lines up with straight-line resistance at 24400s.
Russell 2000 mini-index: Currently net short 17.9k, down 9.4k.
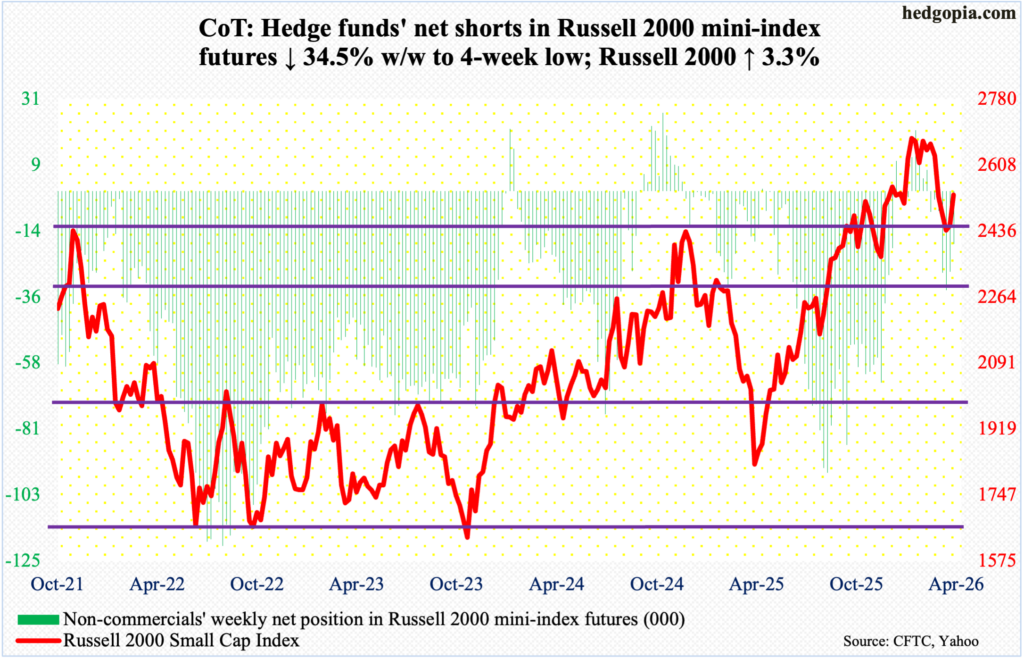
The Russell 2000 jumped 3.3 percent this week but remained bound by horizontal resistance at 2540s. Closing at 2530, this was the fourth week in a row small-cap bulls were denied at this hurdle. Four weeks ago, they failed to defend breakout retest at 2540s; this was then followed by breakout retest at 2460s, which until now has not been decisively breached. This week’s low of 2405, breaching the 200-day at 2440 at the time, was posted on Monday and was followed by strength in the remaining three sessions.
Prior to the longs’ struggle at 2540s and 2460s, the index peaked at 2735 on 22 January, before making a series of lower highs. That trendline resistance gets tested around 2590s; the 50-day at 2589 lies around there.
US Dollar Index: Currently net long 3.7k, up 64.
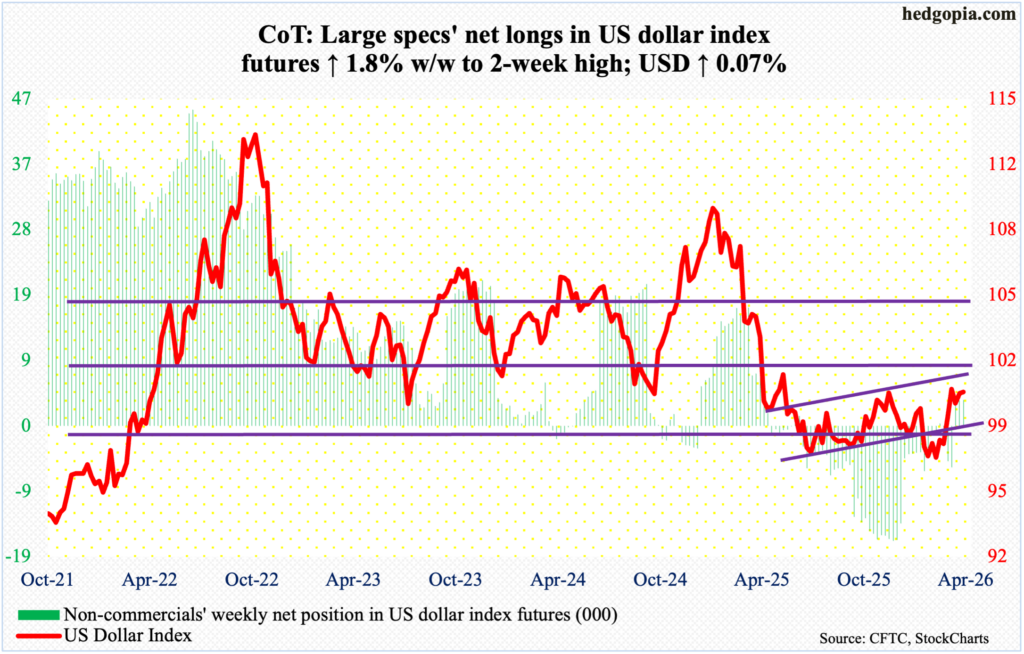
The US dollar index edged up 0.1 percent this week to 100.22. This was the fourth week in a row it has straddled 100 or so. Resistance just north of 100 goes back more than a decade, and it was lost last April.
In January last year, after a three-plus-month rally, the index reversed hard at 110.18, subsequently reaching 96.38 in June and successfully testing that low with a lower low 96.22 in September. On 27 January this year, another lower low 95.55 was ticked, and that drew bids, ending the week with a weekly dragonfly doji.
The index has come a long way from the January low. Until a decisive takeout of 100-plus takes place soon, dollar bulls in due course are likely to suffer from sideways fatigue.
VIX: Currently net short 31.2k, up 6.2k.
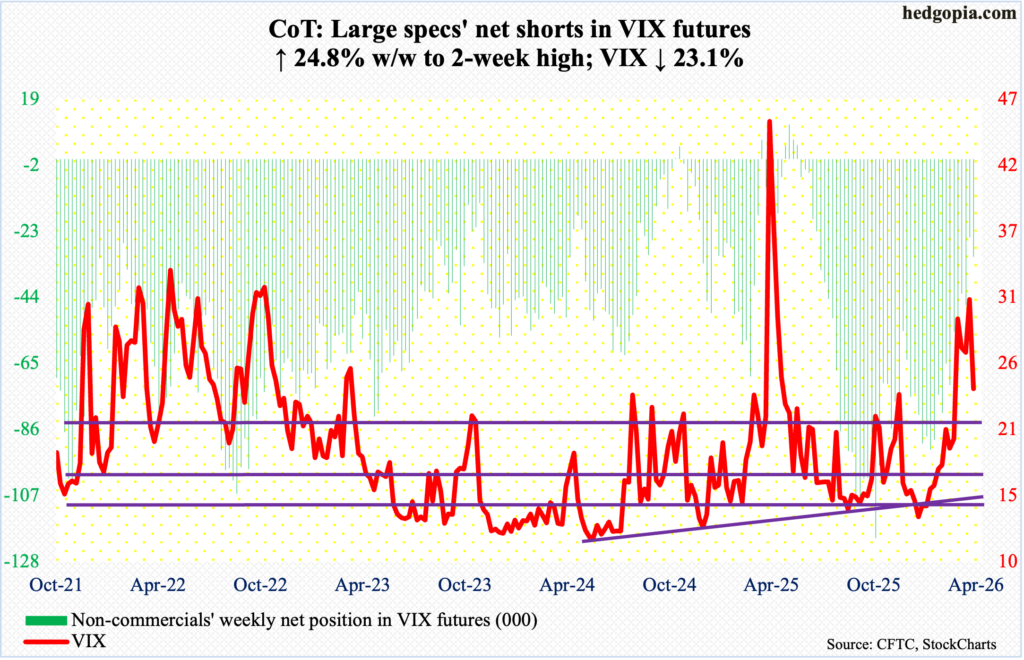
Volatility bulls have consistently defended a rising trendline from Christmas Eve when VIX ticked 13.38 intraday, and their mettle is likely to be tested in the sessions ahead. After that sub-14 low, the volatility index shot up all the way to 35.30 by 9 March before reversing to close the week down 2.30 points to 27.19. That spike reversal has not yet resulted in persistent downward pressure. On 23 March, VIX ticked 20.28 intraday to find support just above the 50-day.
This week, VIX tagged 31.52 intraday Monday, but only to close the week at 23.87, down 7.18 points. The rising trendline in question will be tested at 21.50s, which approximates the 50-day at 21.79. A definitive breach of this support should be bullish for equities.
Thanks for reading!
