
Following futures positions of non-commercials are as of May 26, 2026.
10-year note: Currently net short 788k, down 60.1k.
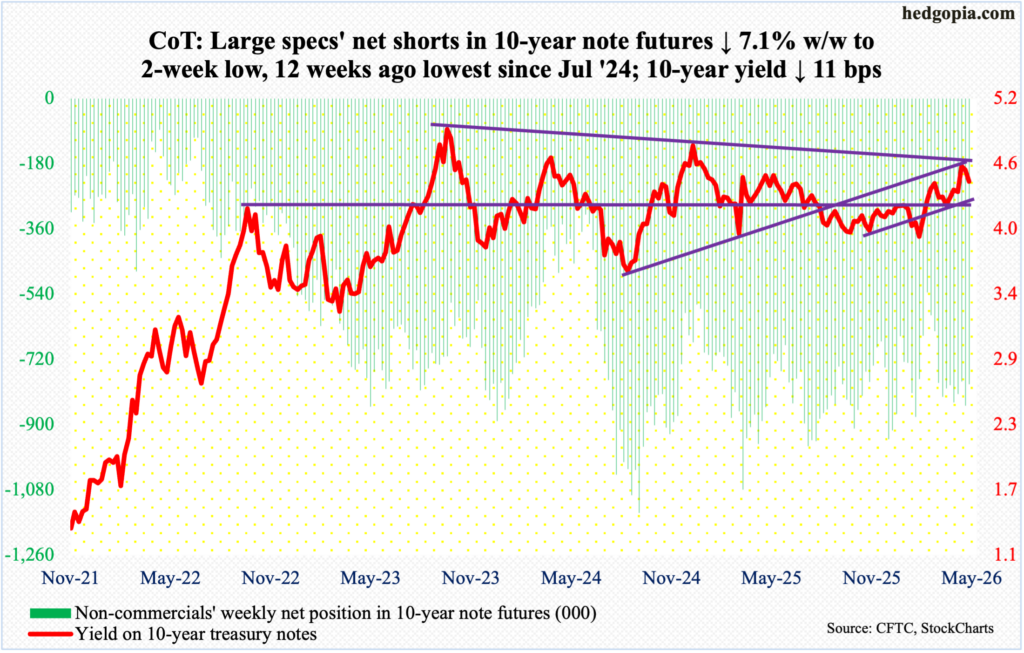
A falling trendline from October 2023 when the 10-year treasury yield peaked at five percent proved too much of a hurdle for bond bears (on price; bond price and yield are inversely related) to jump over. The intraday high of 4.69 percent on the 19th, if held, would have comfortably helped the 10-year yield break out, but it was not. Last week, yields dropped four basis points, and this was followed by a decrease of 11 basis points this week to 4.45 percent.
There is room for the 10-year to continue lower for now, with the 50-day moving average at 4.39 percent. There is major support at 4.20s, with the 200-day at 4.2 percent.
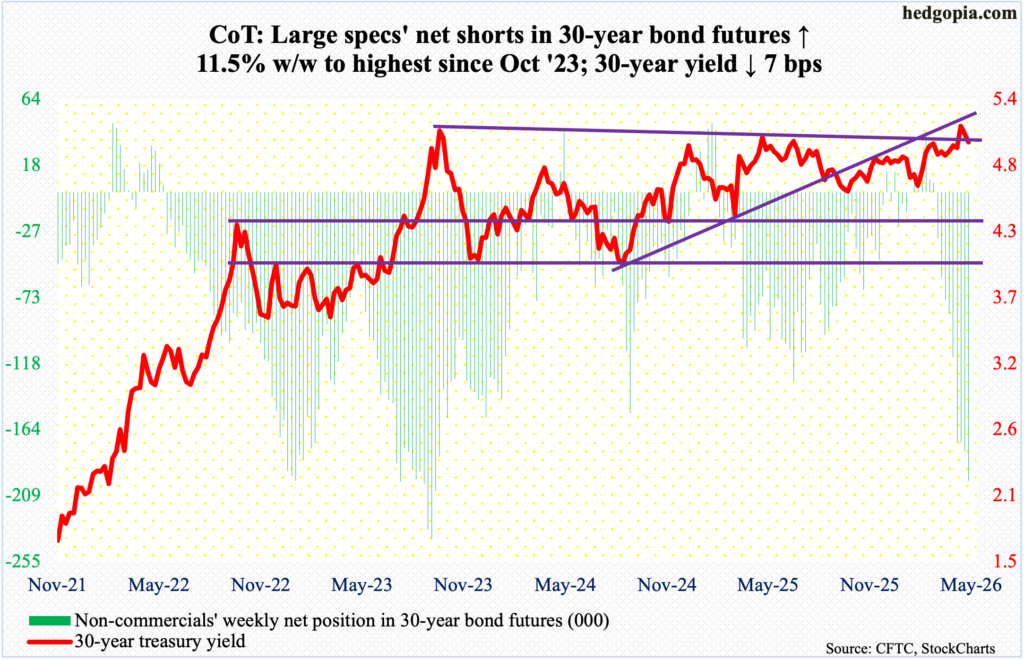
30-year bond: Currently net short 199.3k, up 20.6k.
Major US economic releases for next week are as follows.
The ISM manufacturing index (May) is on schedule for Monday. Manufacturing activity in April was unchanged month over month at 52.7 percent. This was the fourth consecutive month of expansion following a 10-month-long contraction.
Job openings (JOLTs, April) will be out Tuesday. Non-farm openings fell 56,000 m/m in March to 6.87 million. Last December’s 6.55 million was the lowest since September 2020. The all-time high of 12.3 million was recorded in March 2022.
Factory orders (April) and the ISM services index (May) will be published on Wednesday.
April orders for non-defense capital goods ex-aircraft – proxy for business capex plans – slid 1.1 percent from March’s record $83.3 billion to a seasonally adjusted annual rate of $82.4 billion.
In April, services activity dropped four-tenths of a percentage point m/m to 53.6 percent.
Labor productivity (1Q26) comes out Thursday. Preliminarily in the March quarter, non-farm output per hour increased 2.9 percent from a year ago. This set a seven-quarter high.
Friday brings payrolls (May). Non-farm employment gained 115,000 m/m in April to 158.7 million. The first four months this year have produced an average of 76,000 jobs, which is an improvement from last year’s disastrous monthly average of 10,000.
WTI crude oil: Currently net long 133.8k, down 10.6k.
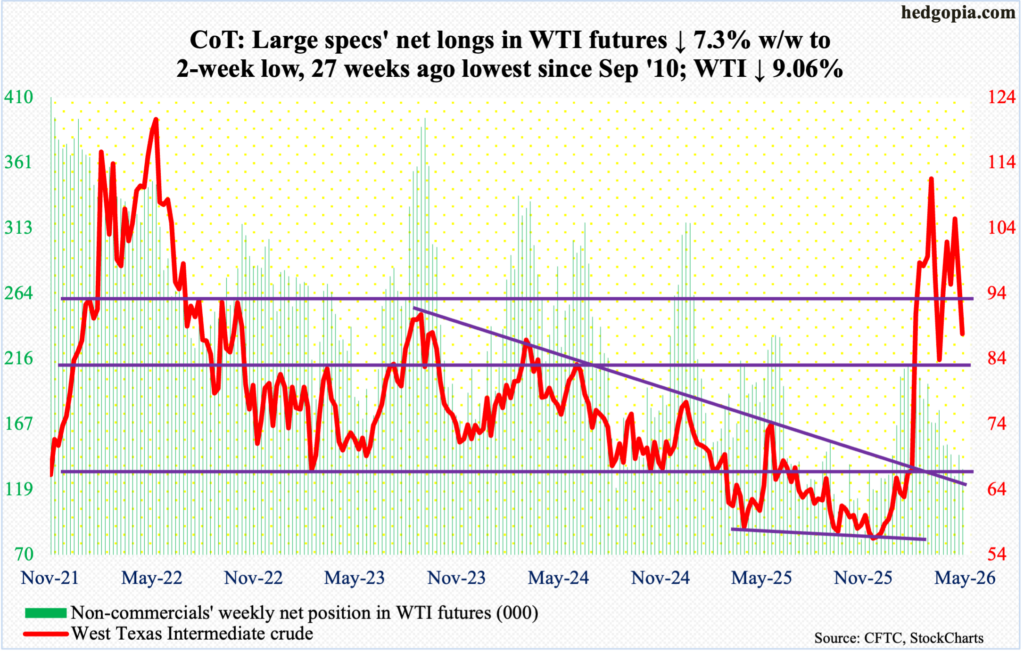
From March 2 when West Texas Intermediate crude gapped up in response to the February 28 US-Israeli attack on Iran, a series of lower highs and higher lows followed. The crude fell out of the resulting pennant pattern this week. It also compromised horizontal support at $91-$92, losing 9.1 percent for the week to $87.85/barrel.
Friday, WTI tagged $86.35, and the low was bought. There is lateral support at $86-$87. With oil bulls on the defensive, if this support yields, then the possibility of the 200-day ($71.96) acting as a magnet in due course cannot be denied. On February 27, the crude tagged $64.85 intraday before exploding higher in the subsequent sessions, reaching a four-year high $119.48 on March 9.
In the meantime, as per the EIA, US crude production in the week to May 22 increased 13,000 barrels per day week over week to 13.715 million b/d; output registered a record 13.862 mb/d in the week to November 7 last year. Crude imports decreased 804,000 b/d to 5.2 mb/d. As did stocks of crude, gasoline, and distillates, which respectively declined 3.3 million barrels, 2.6 million barrels and 2.1 million barrels to 441.7 million barrels, 211.6 million barrels and 100.8 million barrels. Refinery utilization jumped 2.9 percentage points to 94.5 percent.
E-mini S&P 500: Currently net short 165.8k, up 25.2k.
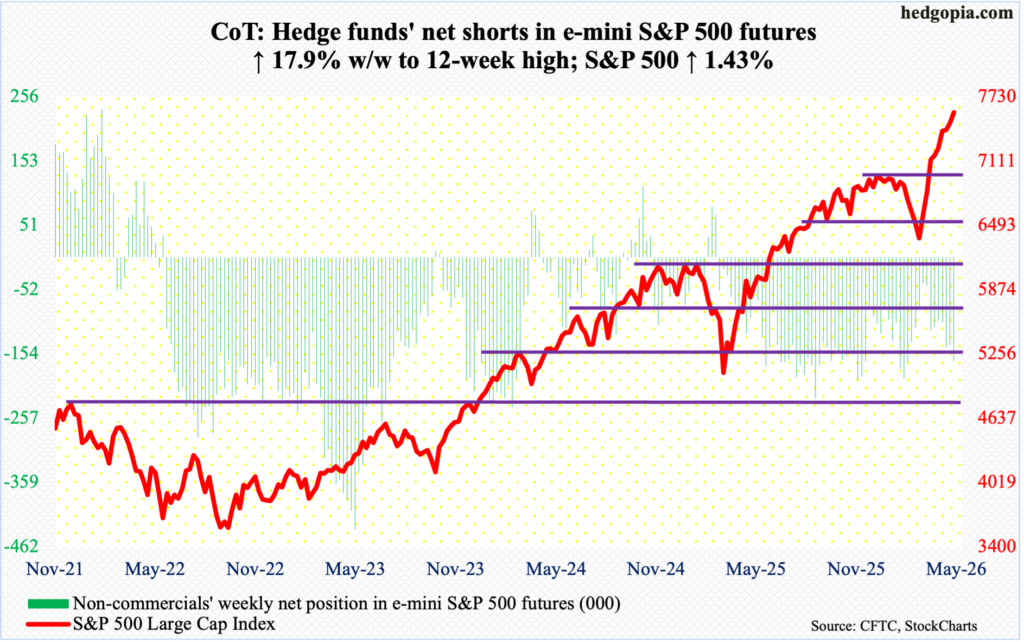
The S&P 500 rallied 1.4 percent this week to 7580. This was the ninth up week in a row, having bottomed at 6317 on March 30, rallying 20.3 percent through Friday’s intraday fresh record of 7599. That is a lot of gains for two months’ work!
The large cap index remains overbought but has been that way for a while now. The extended condition in and of itself is not a guarantee of an unwinding, but risks rise with each push higher. Speaking of which, signs of fatigue are beginning to show up, with Friday finishing with a doji, which was preceded by Wednesday’s hanging man, Tuesday’s spinning top and last Friday’s shooting star.
Nearest support lies at 7500, followed by 7330s, 7270s, 7140s, and the all-important breakout retest just north of 7000.
Euro: Currently net long 29.4k, down 4.1k.
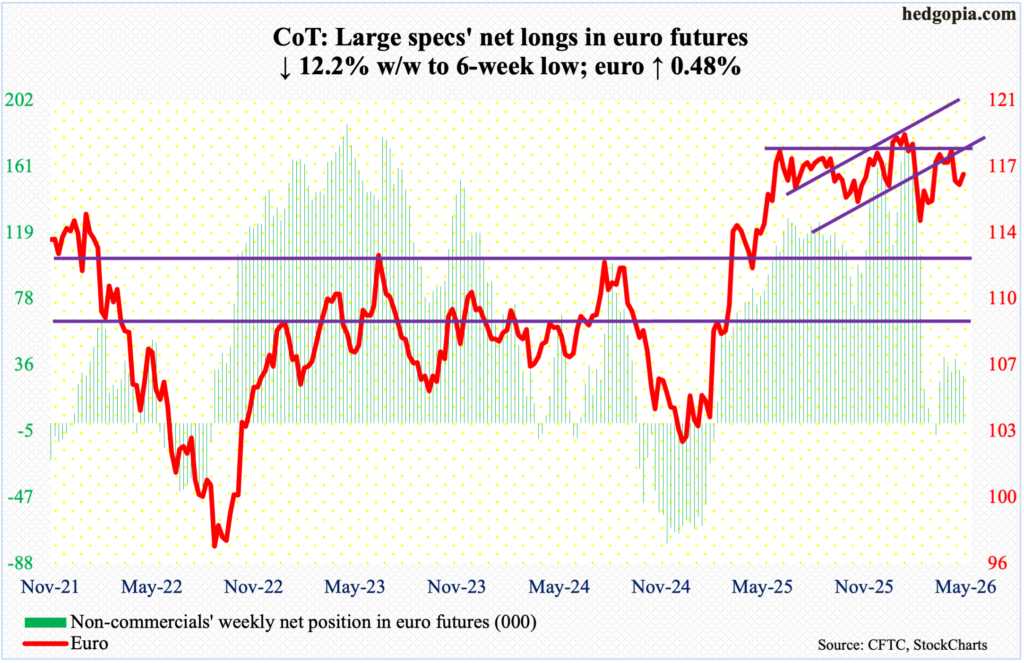
The euro sliced through the 200- and 50-day (respectively $1.168 and $1.167) in the middle of this month, but the bears were unable to make too much out of it, with the bulls repeatedly defending $1.15s, including this Thursday when the currency ticked $1.159. For the week, the euro rose 0.5 percent to $1.166.
Earlier, after trying for five successive weeks to penetrate horizontal resistance at $1.18, longs gave up two weeks ago. For a year now, the euro has played ping pong between $1.14 and $1.18, with a four-and-a-half-year high $1.2083 posted on January 27. On March 13, it bottomed at $1.141.
This week’s gains probably resulted from unwinding the daily oversold conditions. But unless the top of the $1.14-$1.18 range is definitively broken, the risk to the range support is always there.
Gold: Currently net long 154.3k, down 5.6k.
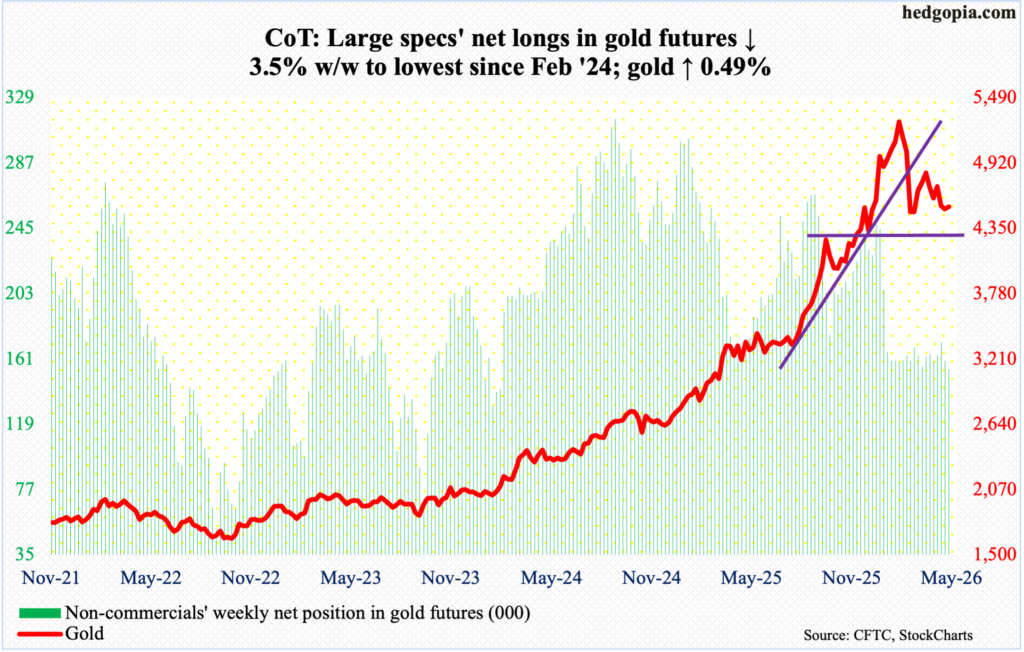
With the 50- and 200-day ($4,632 and $4,375 respectively) narrowing – the former falling and the latter rising – gold has remained sandwiched between the averages since March 18. This week, the 200-day was tested – successfully – with Thursday tagging $4,367 and ending the week up 0.5 percent to $4,539/ounce. A bullish hammer showed up on the weekly.
Thursday’s low was also a successful test of horizontal support at $4,370s.
A rally toward the 50-day is the path of least resistance. This hurdle also approximates a falling trendline from January 29 when the metal hit $5,608 and peaked, before making a series of lower highs.
Nasdaq (mini): Currently net short 6.1k, up 4.7k.
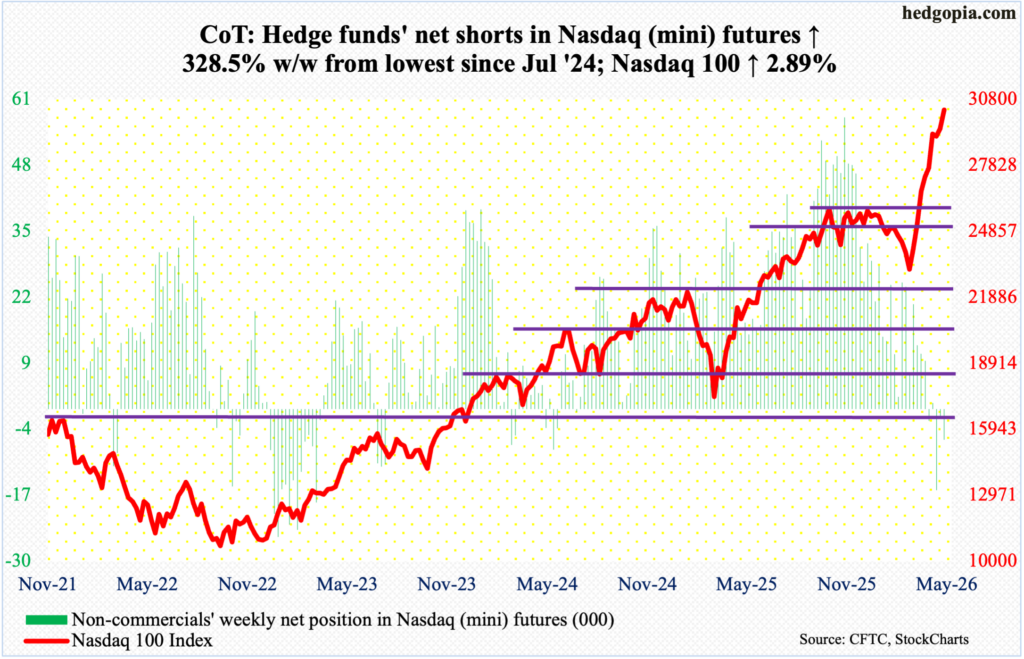
Up 2.9 percent for the week to 30333, the Nasdaq 100 invalidated the potentially bearish candles of the last two weeks – a weekly hanging man last week and a spinning top before that. These candles showed up after a persistent rally from March 30 when the tech-heavy index bottomed at 22841. From that low through Friday’s all-time high of 30470, it surged 33.4 percent.
Conditions have remained so overbought that the daily RSI (77) except for a few sessions in the middle of this month has remained in the 70s to low-80s since mid-April, even as the weekly closed this week at 77.1.
Tech bears have had a few chances come their way, but they have been woefully unable to convert those. In the event they get some traction next week, nearest support lies at 29600s.
Russell 2000 mini-index: Currently net short 15.9k, down 5.1k.
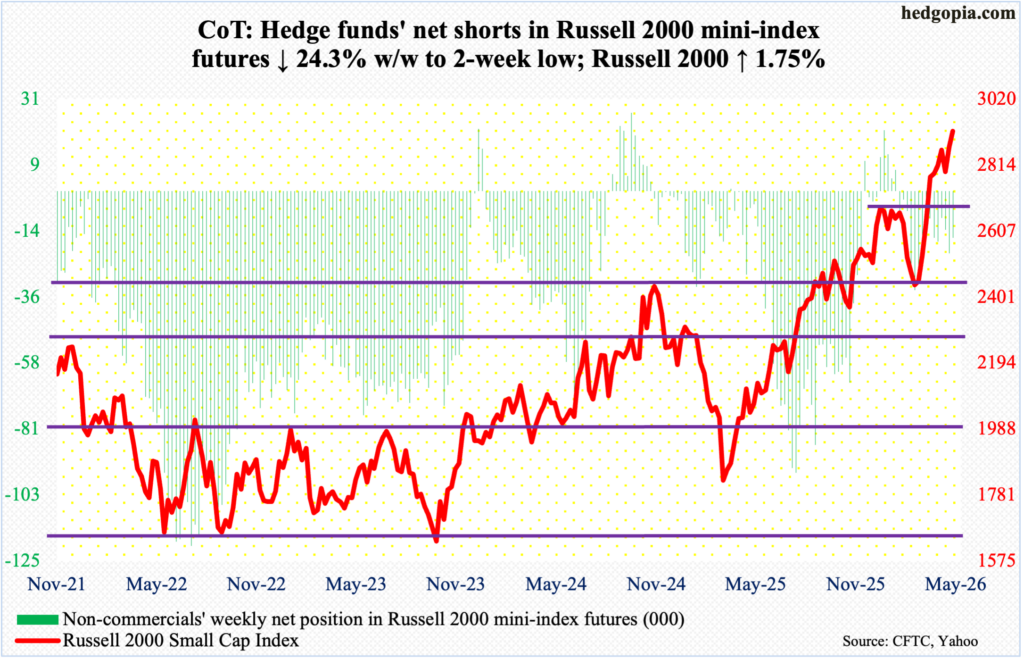
Like the S&P 500 and the Nasdaq 100, the Russell 2000, too, enjoyed a mini-breakout this week, rallying 1.8 percent to 2919, although small-cap bulls would have much preferred to close near Thursday’s all-time high of 2943.
The breakout occurred at 2880s, which the bulls were unable to clear in the last three weeks, with last week peaking at 2879, the week before at 2888 and the week before that at 2889.
This week’s breakout followed a successful breakout retest last week. On January 27, the Russell 2000 peaked at 2735 – a level that was reclaimed seven weeks ago, followed by a successful retest five weeks ago. Last week, on the 19th, there were bids waiting as the dip to 2747 was bought.
A retest of 2880s probably occurs soon.
US Dollar Index: Currently net long 850, up 1.3k.
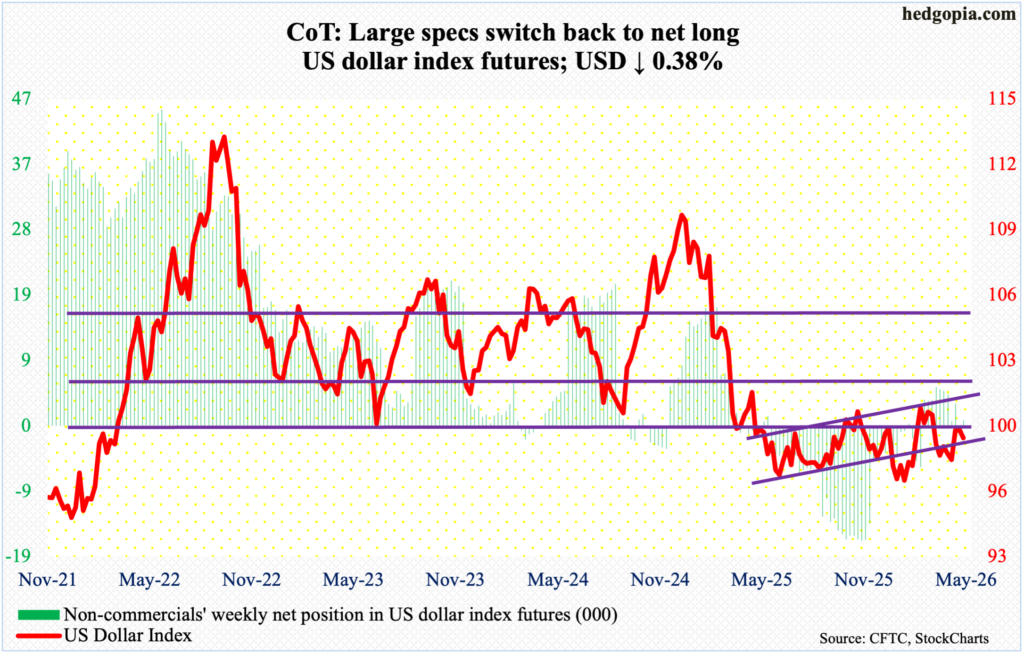
For the second week running, the US dollar index fell short of genuinely testing 100, having reached a weekly high of 99.54 on Thursday. It ended down 0.4 percent for the week to 98.94.
The significance of 100 goes back more than a decade, and the level was lost in April last year. More recently, after unsuccessfully trying for five weeks to reclaim 100, including March 31 when an intraday high of 100.64 was hit intraday, dollar bulls gave up trying seven weeks ago. Their inability of late to even recapture 99.50s raises the odds that the index wants lower prints for now. The 50- and 200-day lie at 98.91 and 98.59 respectively.
VIX: Currently net short 54.5k, down 1.3k.
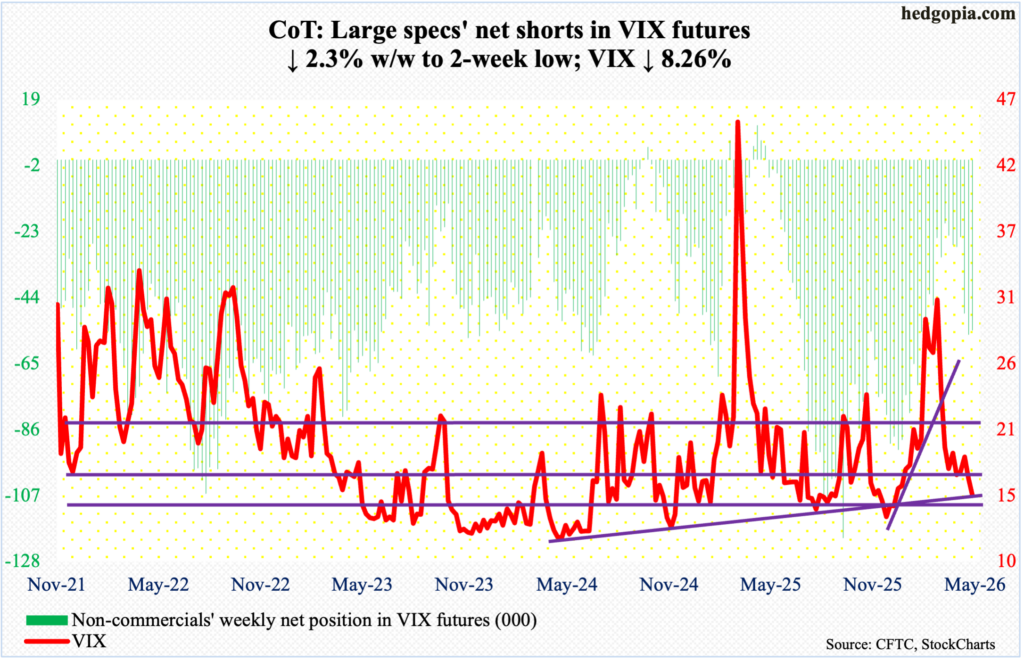
VIX’s two-year rising trendline has been breached on an intraday basis but remains intact on a closing basis. Either way, volatility bulls also yielded the 16 handle this week, down 1.38 points to 15.32.
Volatility remains suppressed – way suppressed, as a matter of fact. This is also reflected elsewhere in the options market, where for the first time since July 2023 the CBOE equity-only put-to-call ratio dipped below 0.4 to register 0.391 on Thursday. In fact, the ratio has produced readings of 0.50s or lower, for 37 consecutive sessions, with 17 of them in the 0.40s and one in the 0.30s. Things are complacent out there.
Thanks for reading!
