
Following futures positions of non-commercials are as of July 14, 2026.
10-year note: Currently net short 831.7k, up 17.4k.
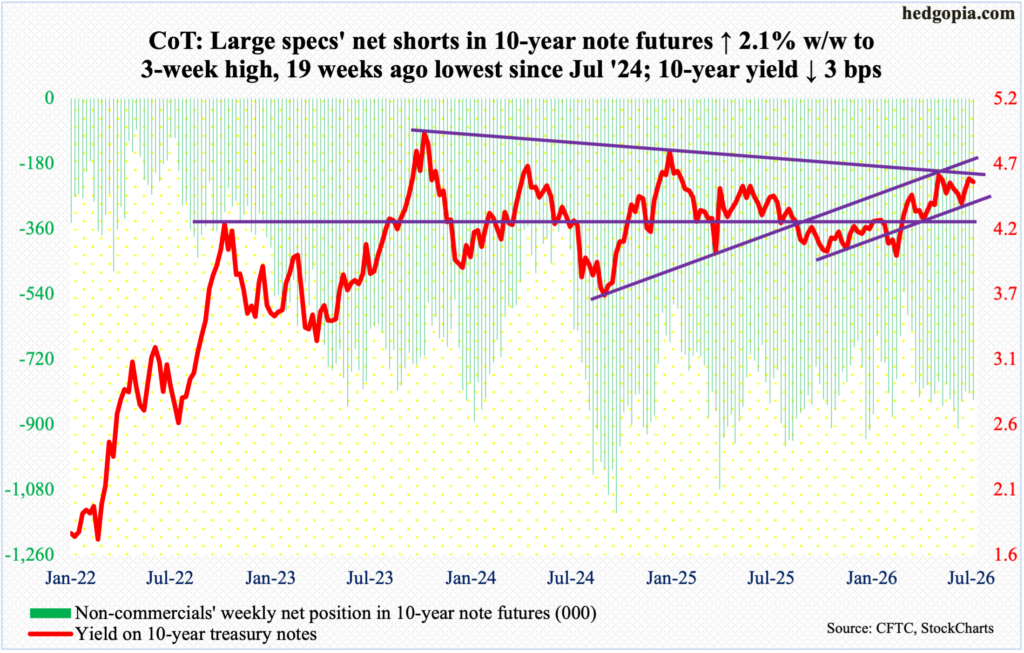
The FOMC meets in 10 days (July 28-29), and the ground may be shifting toward a point where hawkish members begin to exert control. Until just a few weeks ago, the upcoming meeting was never in play. It still is not – come to think of it; but the fact that a small minority of CME traders are in fact betting that the policy-setting body would vote for a 25-basis-point hike indicates how much trader sentiment has shifted.
The fed funds rate has been left at a range of 350 basis points to 375 basis points since last December when the benchmark rates were reduced by 25 basis points; this preceded a cut of similar magnitude in September and October. Earlier, rates reached a cycle high 525 basis points to 550 basis points in July 2023, followed by cumulative cuts of 100 basis points over three meetings in 2024. Until a couple of weeks ago, fed funds futures traders expected the first hike as soon as September.
To be fair, these expectations have been all over the place. Until just a few months ago, futures traders were betting on at least two cuts this year.
Most recently, trader sentiment could be reacting to newly appointed Chairman Kevin Warsh’s “this committee will deliver price stability” statement during last month’s FOMC meeting. This week, Cleveland Fed President Beth Hammack opined that rates may need to rise to get hold of persistent inflation; Dallas Fed President Lorie Logan made similar comments. (Both Hammack and Logan are voting members.) Federal Reserve Vice-Chairman Philip Jefferson similarly could be leaning hawkish.
If all this sticks, the upcoming meeting will be the one to watch with interest, not because there could indeed be a hike, but because this would help provide a window into a possible hawk-dove tug of war in meetings to come.
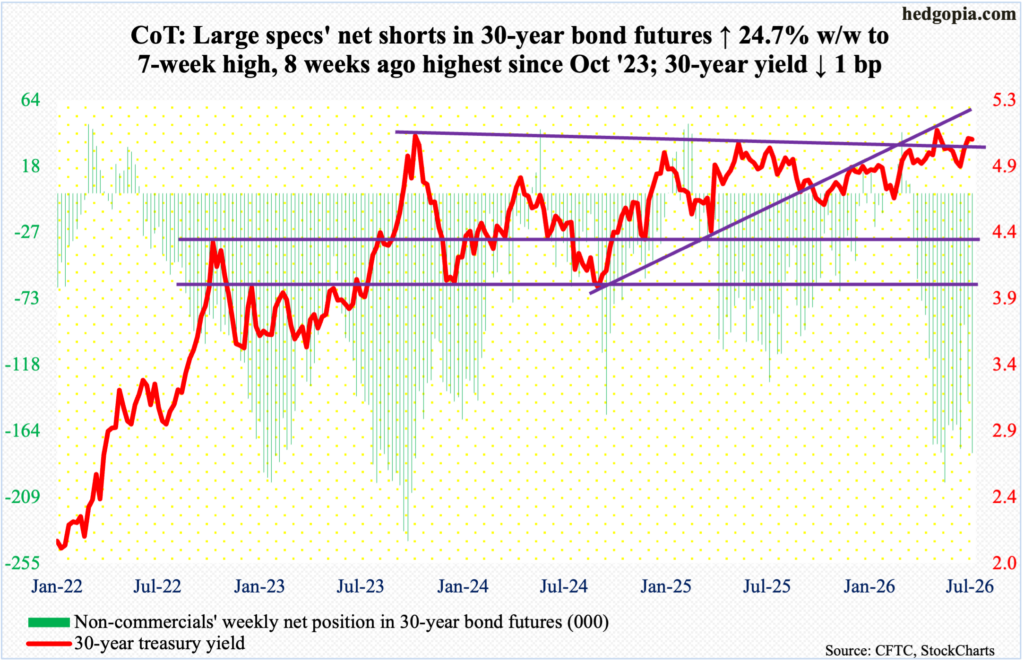
30-year bond: Currently net short 179.1k, up 35.5k.
Major US economic releases for next week are as follows.
New home sales (June) are scheduled for Friday. In May, sales dropped 7.3 percent month over month to a seasonally adjusted annual rate of 580,000 units – a four-month low. Last November, sales hit a 45-month high 757,000 units, followed by a 40-month low 576,000 units in January.
WTI crude oil: Currently net long 79.5k, down 5.4k.
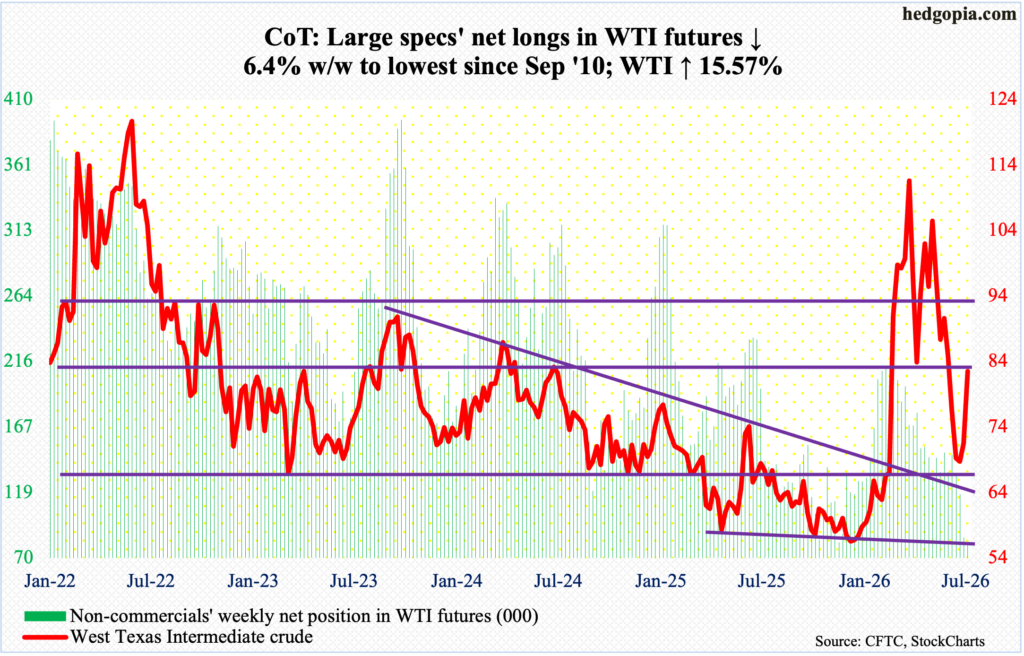
Even as non-commercials’ net longs in WTI futures as of Tuesday hit the lowest since September 2010, West Texas Intermediate crude shot up 15.6 percent this week to $82.53/barrel. More tailwinds could lie ahead for the spot should these traders begin to add to their holdings.
This week’s jump in the crude represents a second up week in a row. Earlier on the 2nd (this month), it ticked $67.04 intraday before reversing higher; that low helped fill a gap from March 2 when WTI gapped up in response to the February 28 launch of a military attack by the U.S. and Israel on Iran. On February 27, it closed at $67.02, with a session high of $67.83 and a low of $64.85.
Subsequently, WTI surged all the way to $119.48 by March 9 – a four-year high. From there, a series of lower highs were made; this trendline resistance will be tested around $93. Before that, the 50-day moving average lies at $85.20; the 200-day at $74.52 was reclaimed this week.
In the meantime, as per the EIA, US crude production in the week to July 10 grew 1,000 barrels per day week over week to 13.861 million b/d, just 1,000 short of the record 13.862 mb/d posted in the week to November 7 last year. Crude imports rose 60,000 b/d to 5.69 mb/d. As did inventory of distillates, which increased 4.6 million barrels to 108.2 million barrels; stocks of crude and gasoline declined 1.7 million barrels and 1.5 million barrels respectively to 409.7 million barrels and 210.5 million barrels. Refinery utilization rose four-tenths of a percentage point to 96.2 percent.
E-mini S&P 500: Currently net short 38.9k, down 4k.
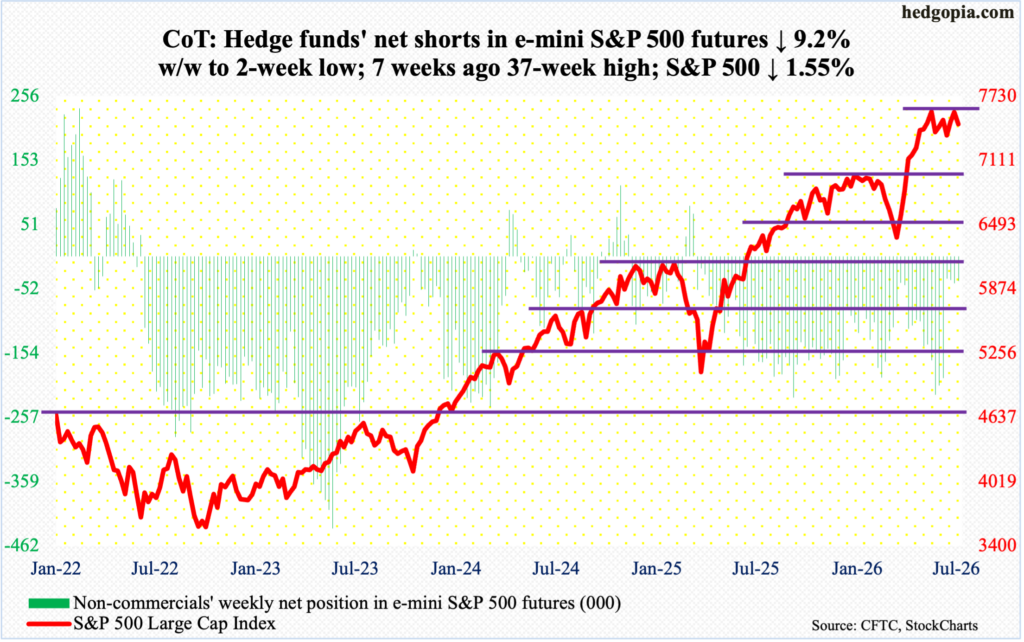
The June-quarter earnings season began this week with the major banks and brokers reporting better-than-expected numbers across the board, but the markets treated them with a yawn. The S&P 500 this week gave back 1.6 percent to 7458, but bulls probably are not sweating just yet as they are sitting on tons of gains. The large cap index bottomed on March 30 at 6317 and peaked at 7621 on June 2.
From that high, the S&P 500 has been in consolidation within a pennant pattern. Friday’s intraday low of 7431 pretty much tested the lower support; the 50-day at 7465 was compromised in that session. This was the fourth time in the past month that the index gravitated toward the average; the fact that the index has failed to rally right off the average is an indication that a violation is just a matter of time.
The way the index closed last week, bulls this week had an opportunity to break out to a new high, but they came up short, and this raises the odds for shorts going forward. In due course, a breakout retest at 7000, or just underneath, is the path of least resistance.
Euro: Currently net short 12.6k, down 3.6k.
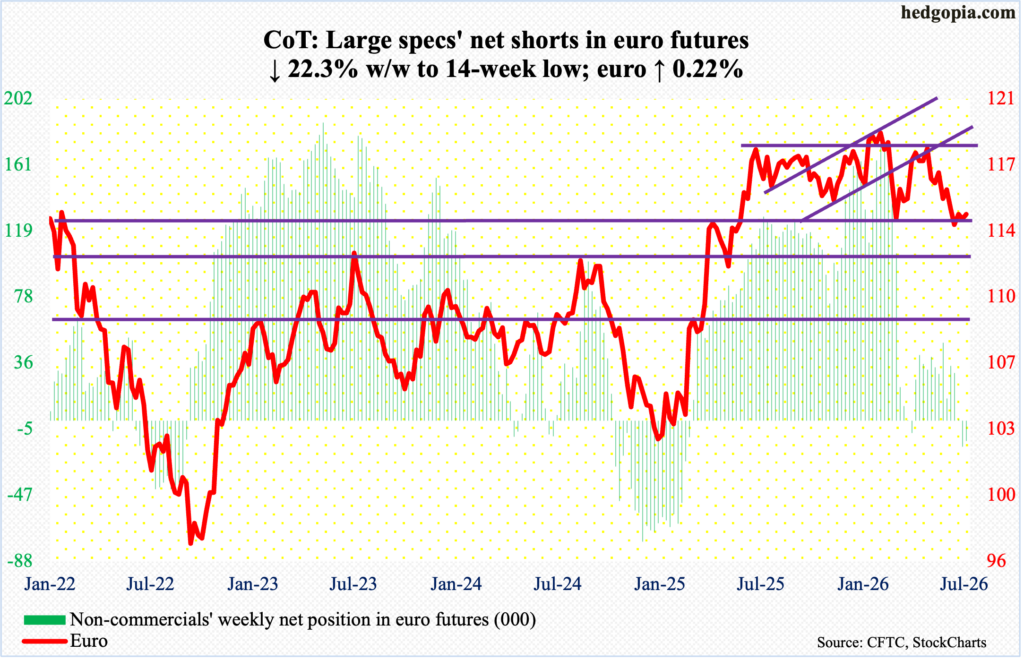
The euro increasingly is acting like it wants higher prices for now. It was up 0.2 percent this week to $1.144, although bulls failed to hang on to Wednesday’s high $1.148. But, more importantly, bids continue to show up at support.
For more than a year, the euro played ping pong between $1.14 and $1.18. Along the way, it tagged a four-and-a-half-year high $1.208 on January 27, then dropping to $1.141 by March 13; that low was breached on June 23, with $1.132 tagged in the next session. The rally that followed, however, is meeting with resistance at $1.147s. Once this gives way, there is moving-average resistance at $1.153 (50-day) and $1.164 (200-day), with the latter coinciding with trendline resistance from the January 27 high.
Non-commercials in the meantime have switched to net short, following 12 weeks of net longs in a row. If they are caught wrong-footed and are forced to go the other way, this can act as the wind at euro bulls’ backs.
Gold: Currently net long 186.7k, down 7.6k.
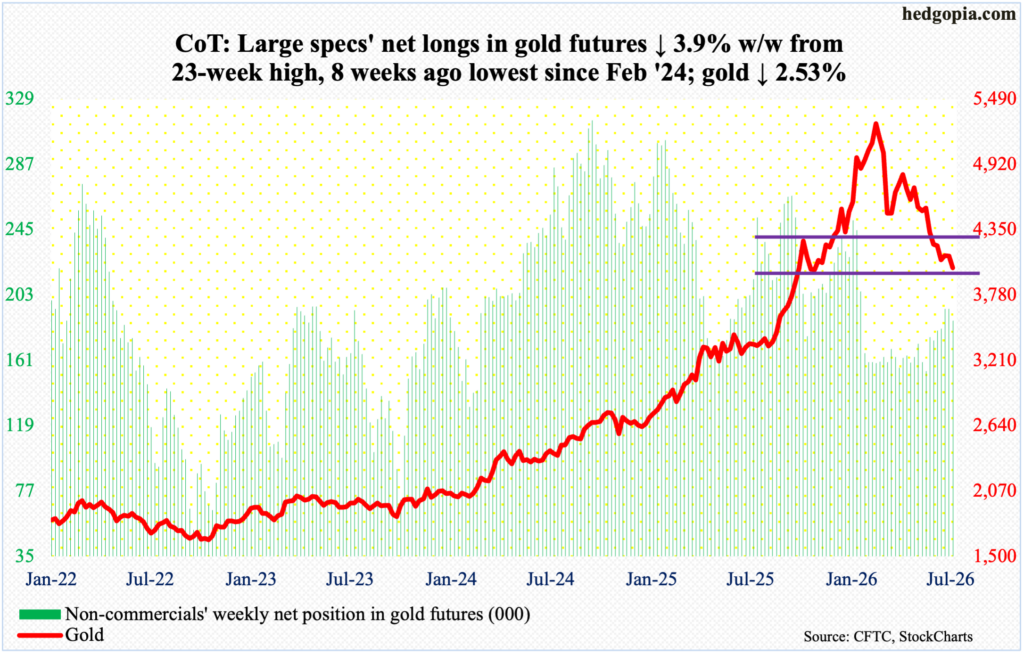
Gold is trying to stabilize just above horizontal support at $3,900. For four weeks in a row, the metal made weekly lows between $3,900 and $4,000, with this week’s low of $3,960 tagged on Friday. For the week, it lost 2.5 percent to $4,017/ounce.
Gold has been under pressure ever since peaking at $5,608 on January 29, followed by a series of lower highs. In October 2023, it bottomed at $1,810, and at $3,312 last August, so long-term longs are not faring that bad.
Seven weeks ago, gold bugs failed to defend horizontal support at $4,370s. This is the risk they currently face. The metal has gone sideways above $3,900. The longer it does that, risks rise of a breach, in which case the next decent support is not until $3,430s.
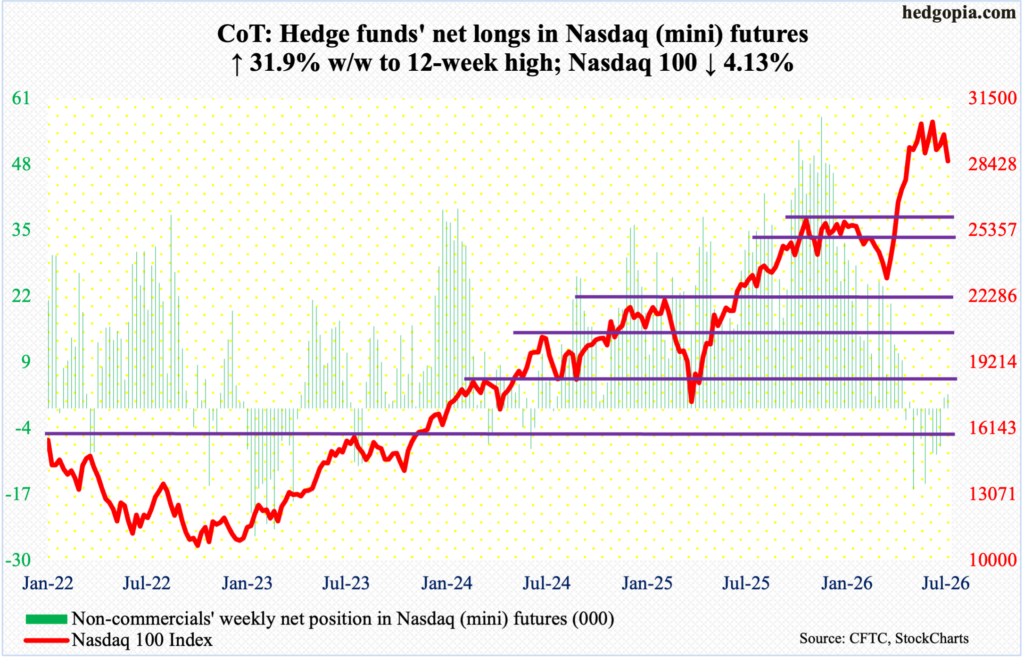
Nasdaq (mini): Currently net long 2.7k, up 658.
U.S. tech heavyweights will be reporting their June quarter in the next couple of weeks, with Google parent Alphabet (GOOG) and Tesla (TSLA) scheduled for the 22nd; Microsoft (MSFT) and Facebook parent Meta Platforms (META) are due out on the 29th, while Apple (AAPL) and Amazon (AMZN) will publish theirs on the 30th.
If how financials got treated this week is a sign of things to come, then tech bulls have a problem in their hands. Financials delivered, with some hitting it out of the park but were sold off as longs decided to lock in their gains. Basically, no greater fool came forward to continue to bid prices up.
The Nasdaq 100 surged 34.7 percent between March 30 when the index bottomed at 22841 and June 3 when it peaked 30762. For several weeks after that high, the tech-heavy index hit the wall at 30600s, with signs of distribution. This week, it dropped 4.1 percent to 28593, with Friday’s intraday low 28231 not that far away from the June 9 low of 28197. The 50-day at 29549 has been decidedly breached.
As things stand, bears have the ball.
Russell 2000 mini-index: Currently net short 24.7k, down 6.3k.
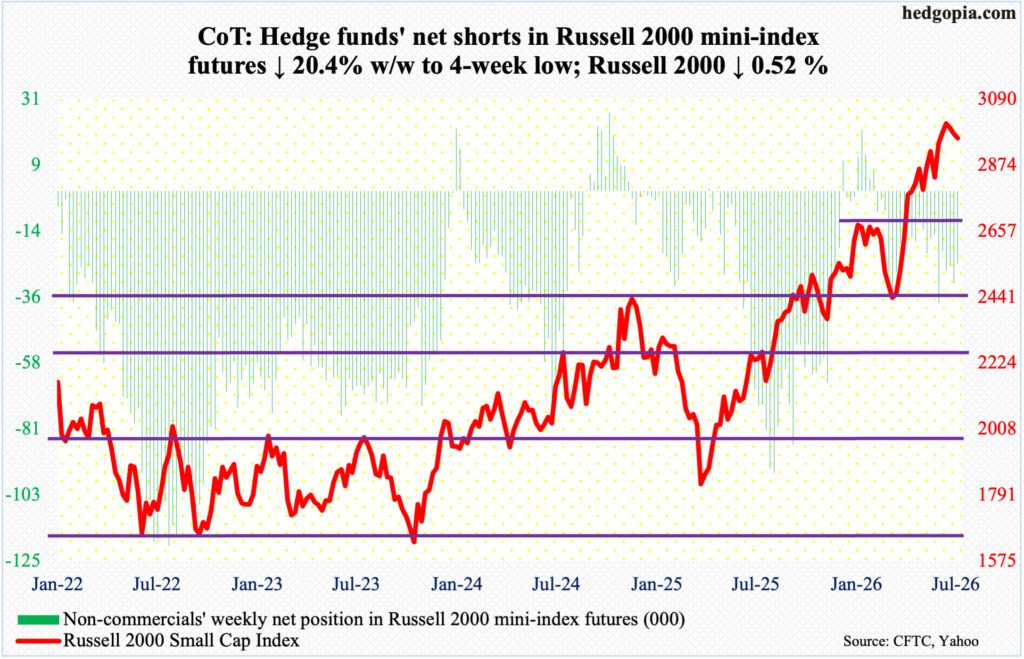
For the second week running, small-cap bulls stepped up in defense of horizontal support at 2940s. This week, the Russell 2000 shed 0.5 percent to 2962, with a weekly low 2934 posted on Friday. While encouraging for the bulls, the fact remains that leading up to and after the index peaked at 3047 on the 1st this month, several weekly candles such as hanging man and spinning top have popped up.
This preceded a ferocious rally from March 30 when the Russell 2000 bottomed at 2405. As the small cap index rallied from that low, one after another resistance got taken care of, with the nearest being 2940s. Once this support gives way, the next level to watch is 2880s, followed by 2720s.
US Dollar Index: Currently net long 13.2k, down 96.
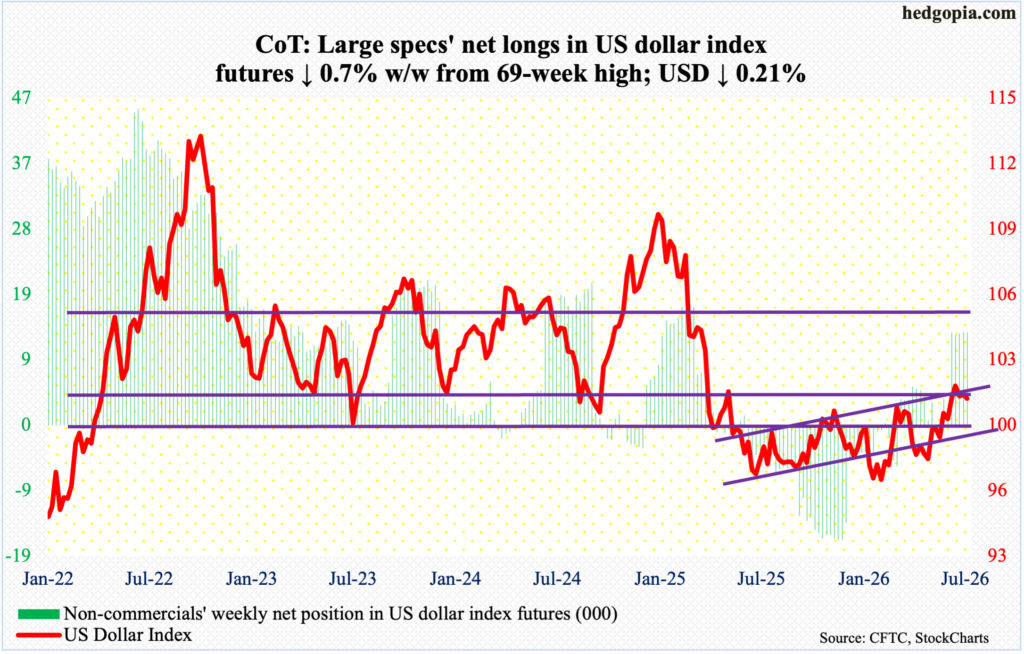
For five consecutive weeks, non-commercials are staying put with net longs of 13,000 contracts or just above; in the prior week, a 69-week high was reached. Five weeks ago, the US dollar index broke out of 100.
The significance of 100 goes back more than a decade, and the level was lost in April last year. More recently, after unsuccessfully trying for five weeks to reclaim the level, including March 31 when an intraday high of 100.64 was hit intraday, longs gave up trying 15 weeks ago. Then, five weeks ago, dollar bulls reclaimed 100, followed by a rally to 101.80 by June 24.
On the condition that the index remains north of 100, bulls deserve the benefit of the doubt. That said, risks are increasingly rising that they will no longer be able to sustain the positive momentum.
VIX: Currently net short 65.8k, up 1.7k.
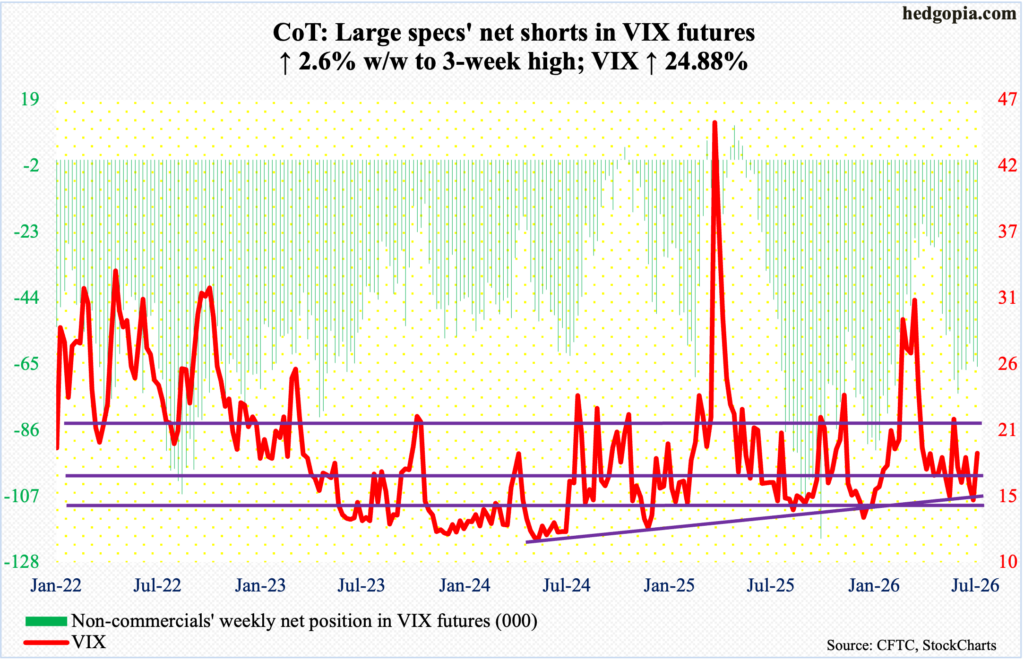
Last week, volatility bulls had a great opportunity to reclaim both the 50- and 200-day (17.34 and 18.77 respectively) and failed, but only to succeed this week. VIX jumped 3.74 points this week to 18.77, with an intraday high of 19.50 on Friday.
The weekly RSI closed the week right at the median (50.38 to be specific); volatility seems to be itching to move up on this timeframe. VIX should print higher prices once the weekly RSI decisively rallies past 50 and toward the high-50s to low-60s.
Thanks for reading!
