
Following futures positions of non-commercials are as of September 8, 2026.
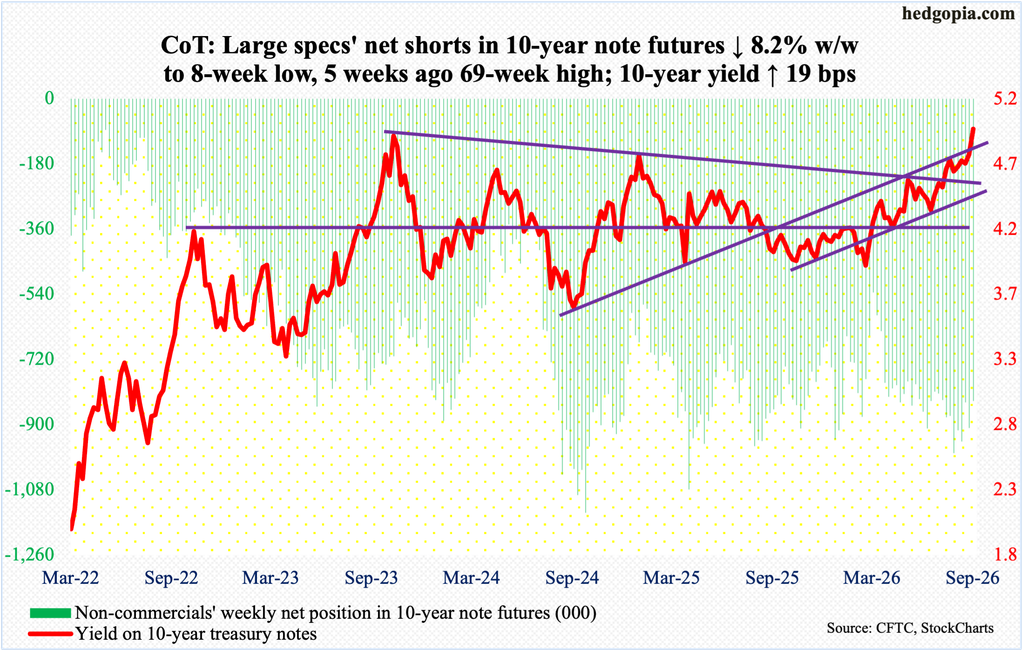
10-year note: Currently net short 834.8k, down 74.5k.
Last week, August’s much-better-than-expected jobs report – creating 162,000 non-farm jobs coupled with an upward revision for June and July – gave the FOMC (Federal Open Market Committee) the definitive green signal to hike in next week’s meeting. But in markets’ eyes, this was only a partial green signal, awaiting confirmation from this Friday’s CPI (consumer price index) report for August.
From a year ago, headline and core CPI last month rose 3.4 percent and 2.45 percent, in that order; month over month, they were up 0.4 percent and 0.3 percent, with the latter higher than expected. As per the CME’s FedWatch tool, traders immediately raised the probabilities for a quarter-point hike to 90 percent (87 percent as of this writing). Markets are now saying it is hard to justify a hold.
The fed funds rate has been left unchanged since last December when it was reduced by 25 basis points; this preceded a cut of similar magnitude in September and October. Earlier, rates reached a cycle high 5.25 percent to 5.50 percent in July 2023, followed by cumulative cuts of 100 basis points over three meetings in 2024.
Rates have been pushed lower at a time when consumer inflation – both CPI and PCE (personal consumption expenditures) – has remained above the Federal Reserve’s stated goal of two percent for over five years.
If the FOMC in next week’s meeting – slated for Tuesday-Wednesday – does not oblige with an increase in the benchmark rates, bond bears are likely to express their displeasure by rallying the 10-year treasury yield past the crucial five percent. Rates ended the week up 19 basis points to 4.975 percent, essentially on par with the prior high 4.997 percent from October 2023.
A hike, on the other hand, can soothe bond vigilantes’ worries about inflation, federal debt and deficit financing – for now. A breather in the 10-year yield is likely, with immediate support at 4.75s.
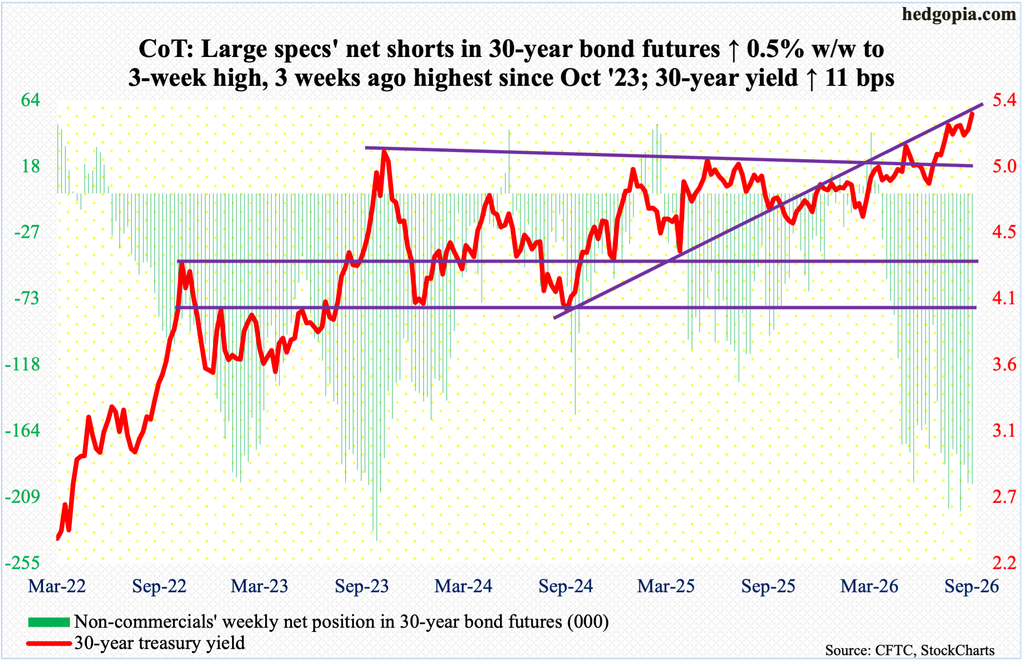
30-year bond: Currently net short 200.5k, up 1k.
Major US economic releases for next week are as follows.
Retail sales (August) and the NAHB housing market index (September) are on schedule for Wednesday.
Retail sales in July dropped 0.6 percent m/m to a seasonally adjusted annual rate of $763.6 billion. This was the first down month sequentially in six. June’s $768.1 billion set a record.
In August, homebuilder optimism increased a point m/m to 35 – a two-month high.
Housing starts (August) will be out Thursday. Starts tumbled 12.4 percent m/m in July to 1.24 million units (SAAR) – a two-month low. May’s 1.18 million was a six-year low.
Friday brings industrial production/capacity utilization (August). July utilization inched up 0.1 percent m/m to 76.3 percent, which set a one-year high.
WTI crude oil: Currently net long 111.8k, up 6.5k.
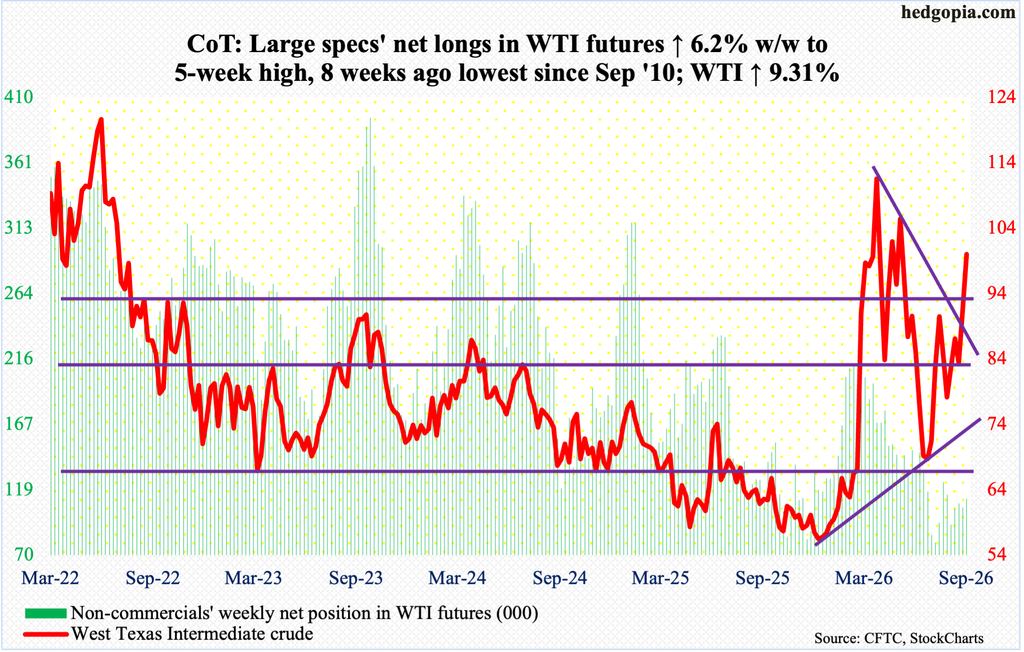
Last week, West Texas Intermediate crude broke out of trendline resistance from March 9 when it peaked at $119.48. More gains followed this week, as the crude added 9.3 percent to $100/barrel. At the same time, oil bulls were unable to hang on to Friday’s intraday high $104.46, which was the highest print since May 19 this year.
WTI has come a long way since July 2 when it bottomed at $67.04, which filled a gap from March 2 when the crude had a six-session surge in the wake of the February 28 U.S. and Israeli military attack on Iran. On February 27, WTI closed at $67.02, with a session high of $67.83 and a low of $64.85.
This week, WTI also took care of $92-$93, where it had struggled for a few sessions. This price point is where the bulls likely will try to put their foot down next.
In the meantime, as per the EIA, U.S. crude production in the week to September 4 jumped 85,000 barrels per day week over week to 13.947 million b/d, setting a fresh record. Crude imports, too, rose, up 54,000 b/d to 6.824 mb/d. As did gasoline and distillate inventory, which respectively grew 1.3 million barrels and 2.1 million barrels to 206.9 million barrels and 106.3 million barrels; crude stocks were down 391,000 barrels to 424.1 million barrels. Refinery utilization dropped two-tenths of a percentage point to 97.8 percent; prior week’s 98 percent was the highest since August 2018.
E-mini S&P 500: Currently net short 76k, up 95.
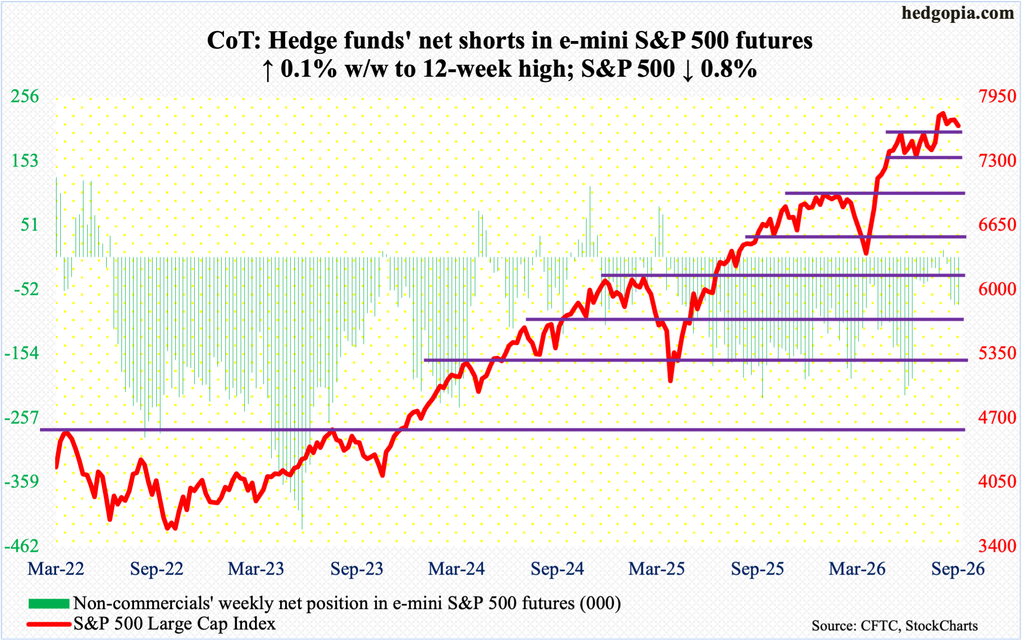
Equity bulls and bears continue to lock in horns for control of a crucial level. The S&P 500 earlier consolidated for a couple of months after peaking at 7621 on June 2. For four weeks now, equity bears have been hammering at 7600-plus, but to no avail. This week, they succeeded on Thursday when in a doji session the large cap index closed at 7592, which also breached the 50-day moving average (7607), but Friday belonged to the bulls, finishing at 7657, still down 0.8 percent for the week.
If more gains follow next week – likely if the daily conditions win out over the weekly – bulls’ mettle will be tested at 7720s, which is where trendline resistance from August 13 when the index retreated after tagging an all-time high 7817 lies. If the weekly prevails, however, there is more downside to come.
Euro: Currently net short 42.6k, up 17.7k.
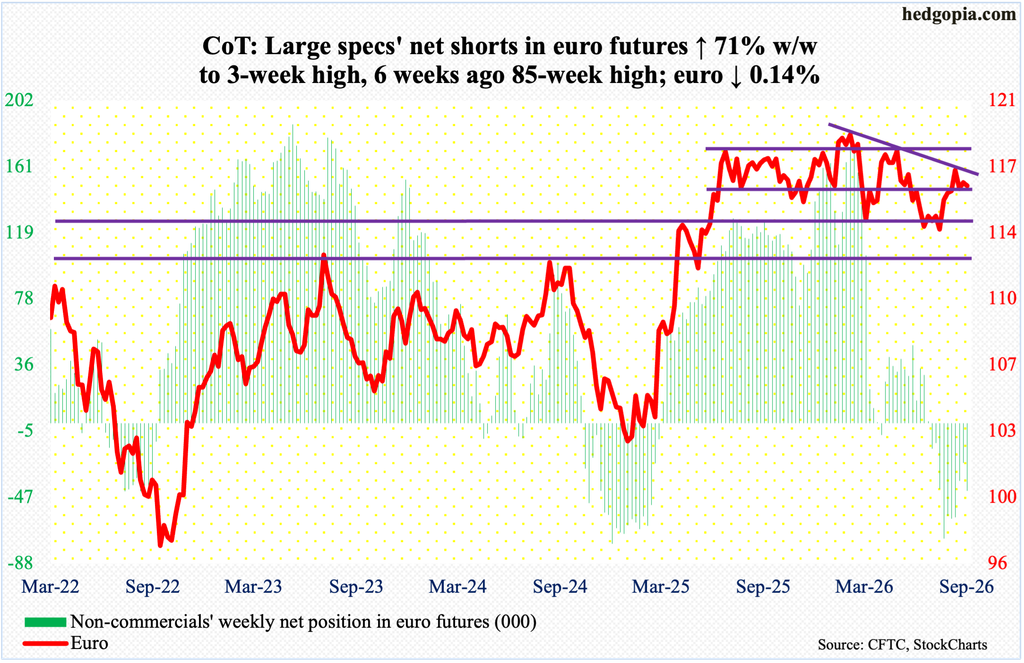
Euro bulls lost the 200-day ($1.163) on August 28, and all subsequent attempts to recapture the average have yielded no fruit; they were unable to keep Wednesday’s intraday high of $1.166 this week.
Earlier, the currency rallied from $1.135 on July 28 to $1.171 on August 20, which was the highest print since mid-May. This was just short of resistance at $1.18.
For more than a year, the euro went back and forth between $1.14 and $1.18, marked by a four-and-a-half-year high of $1.208 posted on January 27, followed by a low of $1.132 on June 24. A declining trendline from the January high was broken five weeks ago, but euro bulls failed to build on it.
As things stand, the path of least resistance is toward the 50-day at $1.153. The euro closed the week down 0.1 percent to $1.1599.
Gold: Currently net long 232k, up 3.8k.
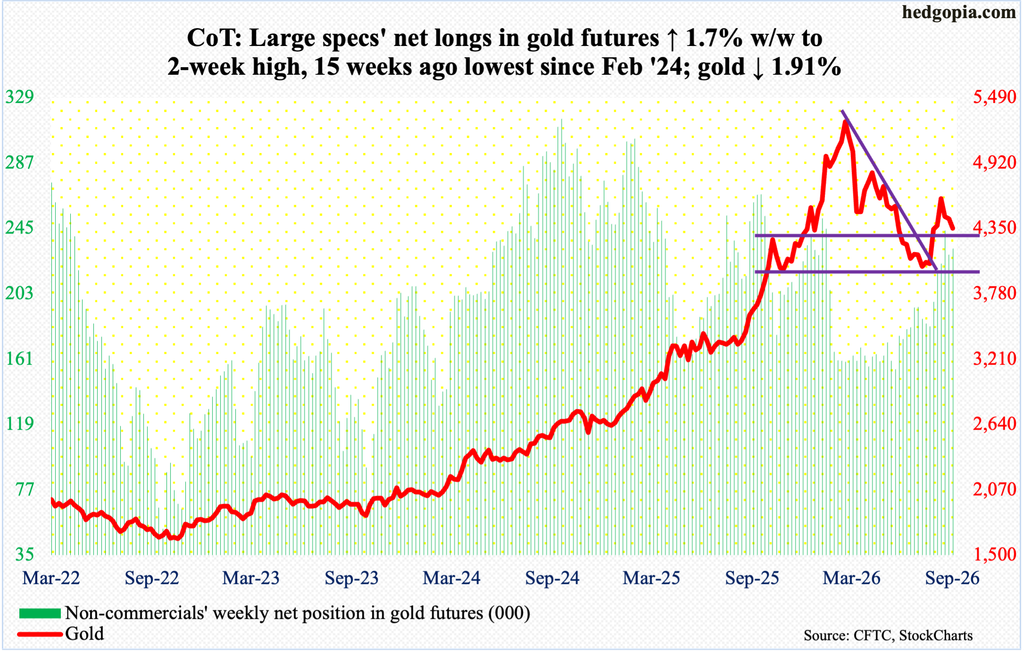
Gold suffered its third consecutive down week since reversing lower after tagging $4,697 on August 25; gold bugs were unable to build on a trendline breakout in the week before that. The metal gave back 1.9 percent this week to $4,348/ounce.
The yellow metal went from $3,312 in August last year – and $1,810 in October 2023 – to a peak of $5,608 on January 29 this year. The drop since found support at $3,900-$4,000 for six consecutive weeks in June-July before it broke out four weeks ago. Bulls are no longer riding that momentum.
This week, gold slightly breached horizontal support at $4,380s. The 200-day ($4,529) has been lost, and the 50-day lies underneath at $4,263; a breach of the latter opens the door toward $4,160s. Non-commercials are the wild card here, as they are patiently sitting on tons of net longs.
Nasdaq (mini): Currently net long 20.9k, down 5k.
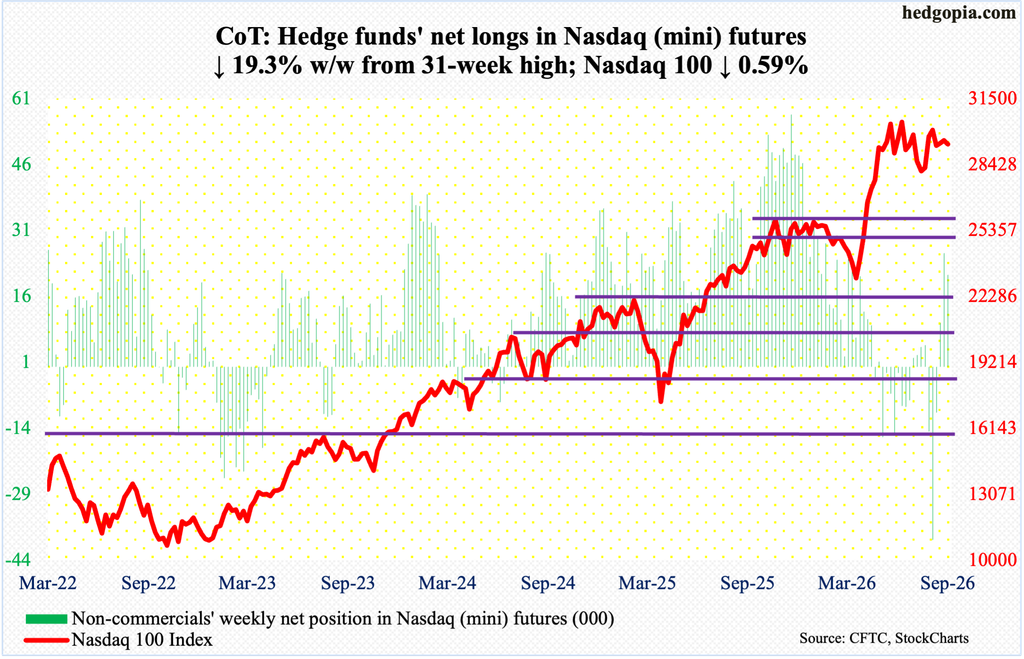
The Nasdaq 100 dropped 0.6 percent this week to 29368, but this could have been a lot worse as the index was down 1.7 percent through Thursday’s intraday low of 29038. As was the case with the S&P 500, Thursday’s doji session closed under the 50-day (29198) but barely. The average was reclaimed Friday, but the index remains under a trendline from June 3 when it registered an all-time high of 30762. Unlike other major indices like the S&P 500 and Russell 2000, which posted fresh highs last month, the tech-heavy index is yet to surpass its June high.
The trendline in question gets tested at 30000, so this is the potential upside the tech bulls are looking at in the best of circumstances right now. Else, they will be asked to defend 28600s-28880s; the 200-day rests at 27129.
Russell 2000 mini-index: Currently net short 82.8k, up 11.2k.
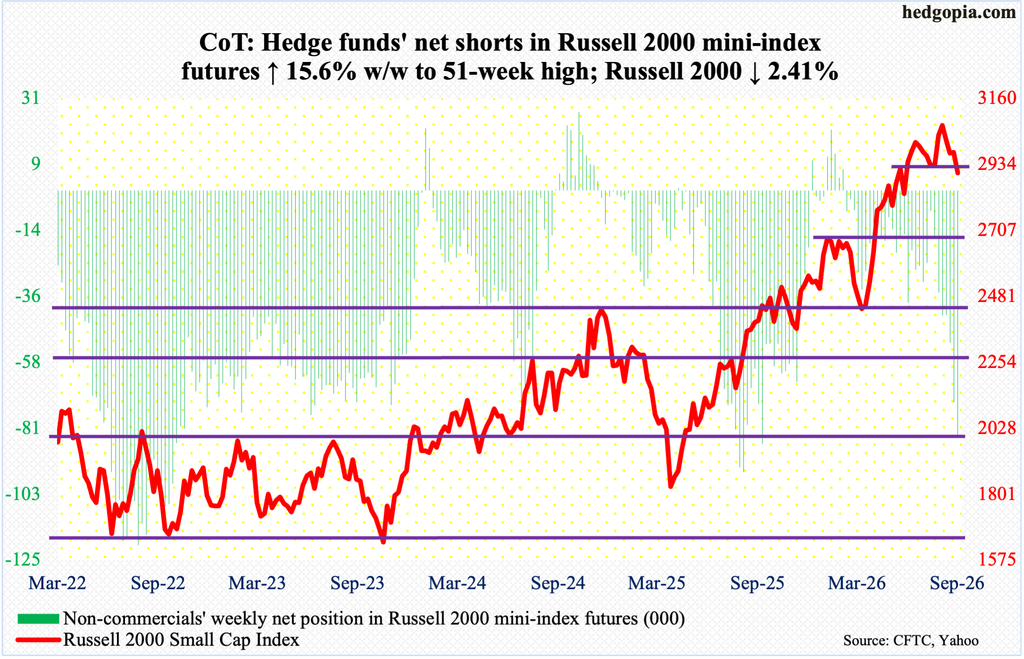
On the defensive since the Russell 2000 peaked at 3070 on August 14, small-cap bulls this week were forced to defend horizontal support at 2880s, with Thursday ticking 2887 intraday and the index closing down 2.4 percent for the week to 2904.
Before this, there was a false breakout at 3040s four weeks ago; the index earlier hit 3047 on July 1, 3049 on August 5 and 3049 again on the 18th. This week’s loss also translates to a breach of lateral support at 2940s, where the bears are likely to show up on any strength in the near term. The 50-day rests at 2981.
US Dollar Index: Currently net long 17.6k, up 579.
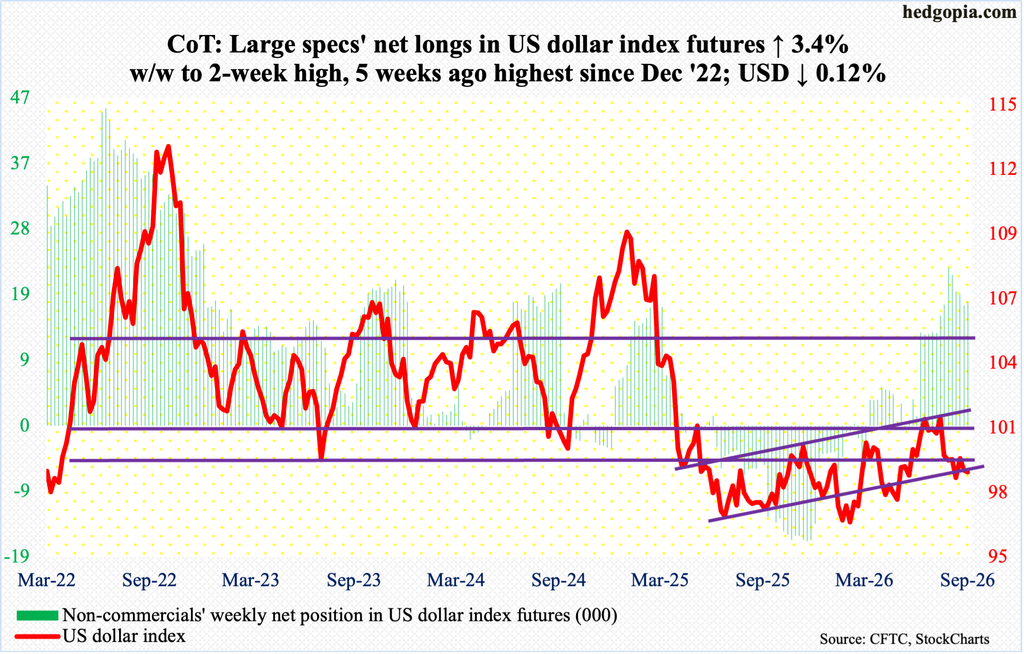
The US dollar index this week was just about unchanged, down 0.06 percent to 99.09. Dollar bulls’ attempt to retake the 200-day (99.13) failed, as they were unable to cling on to Friday’s session high 99.37. They will probably succeed in reclaiming the average in the sessions ahead.
The 50-day lies at 100. The US dollar index had been under pressure since getting rejected at 101-102 for six weeks in a row in June-July. It has gone sideways the last four weeks. The significance of 100 – or just north of it – goes back to March 2015.
VIX: Currently net short 94.8k, up 10.6k.
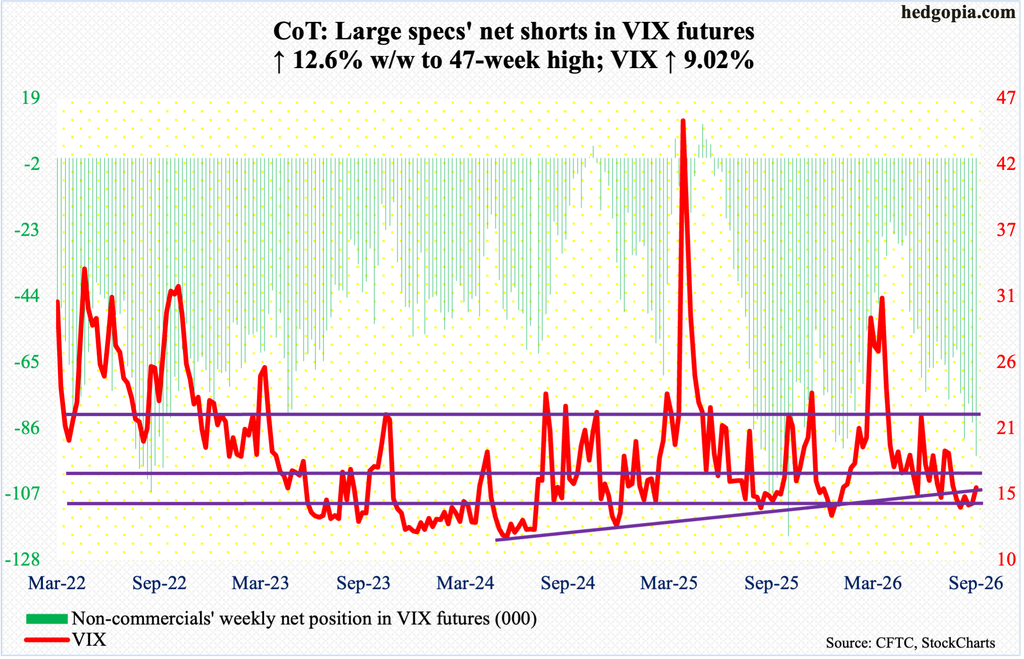
Last Friday, VIX went sub-14 intraday tagging 13.80, which was the first time since last December when the volatility index traded with a 13 handle. This week, it gapped up Tuesday and rallied all the way to Thursday’s intraday high of 18.17, which kissed the 200-day (18.12). But by Friday, VIX ended up also losing the 50-day (16.14), although it gained 1.31 points for the week to 15.84.
Next week, volatility bears have an opportunity to push VIX lower, as there is room for downward pressure on the daily. In this scenario, volatility bulls will then have an opportunity to defend 43, or thereabouts, on weekly RSI, which closed this week at 47.22; for nearly three years now, this metric has not broken 43, or thereabouts.
Thanks for reading!
