
Following futures positions of non-commercials are as of October 20, 2026.
10-year note: Currently net short 964.3k, down 23.8k.
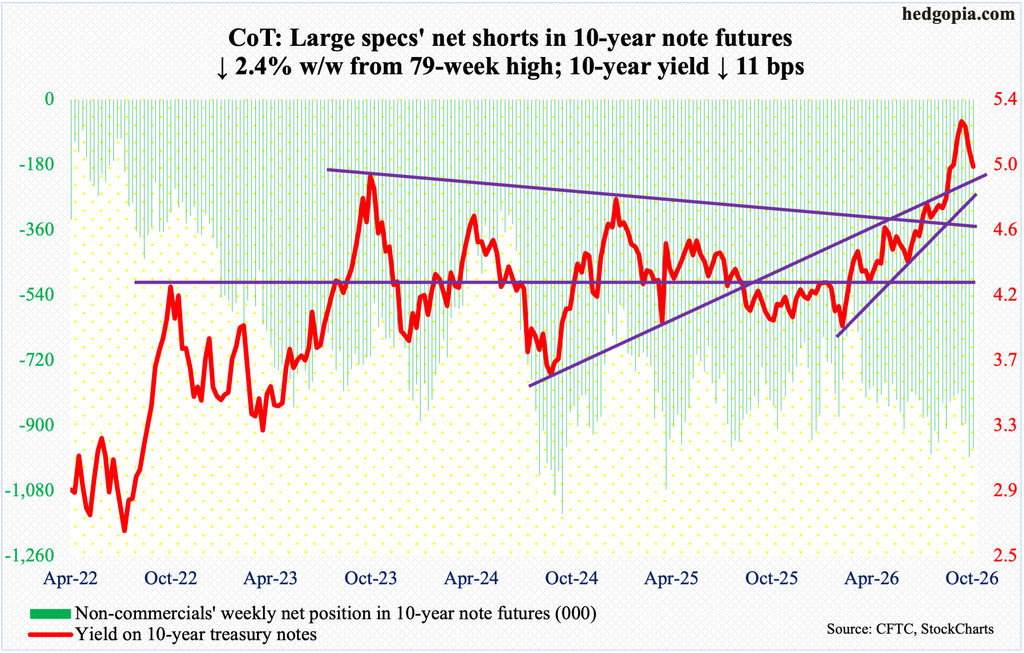
The FOMC (Federal Open Market Committee) meets next week. The policy-making body is meeting after having unanimously raised the fed funds rate by 25 basis points to a range of 375 basis points to 400 basis points in the September meeting. This was the first hike since July 2023.
Until just a few weeks ago, markets were bracing for another quarter-point hike next week. But the narrative has changed in recent weeks. The CME FedWatch tool is pricing in a 10 percent probability of a hike next week; these traders do expect an increase in the base rate in December, followed by one for sure and maybe two to end 2027 between 450 basis points and 475 basis points.
If these expected hikes are delivered, then the FOMC would have rolled back 100 basis points in total of the 175 basis points of easing in the preceding cycle.
As far as Chair Kevin Warsh, who took over the Federal Reserve in May, is concerned, this will be his fourth meeting. As soon as he came on board, he has been adamant that inflation remains way too strong. If for some reason the 12-member FOMC decides to surprise the markets with a hike, then this would have certainly sent a very strong signal that they are genuinely bothered by price pressures, but the odds of this happening are nearly zero, not the least because Warsh is someone who likes to listen to markets’ signals.
The 10-year treasury yield probably reflects this, dropping from an intraday high of 5.36 percent set on the 7th this month to the current 4.99 percent; five percent is crucial for both bond bulls and bears.
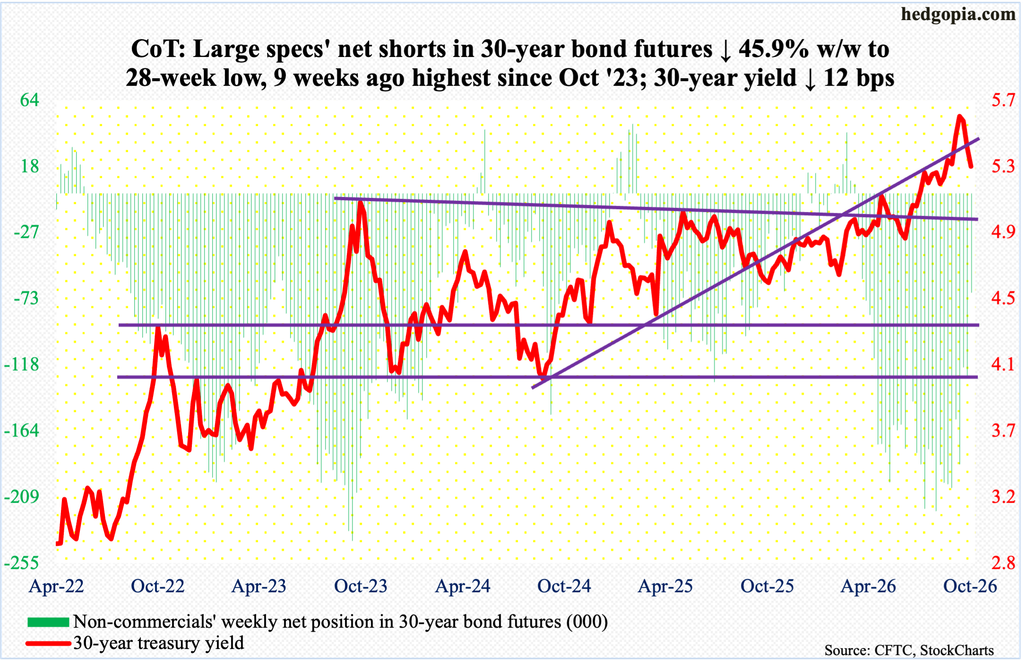
30-year bond: Currently net short 68.4k, down 58k.
Major U.S. economic releases for next week are as follows.
Durable goods (September), the S&P Cotality Case-Shiller home price index (August) and new home sales (September) are due out Tuesday.
In August, new orders for non-defense capital goods ex-aircraft – proxy for business capital spending plans – increased 1.6 percent month over month to a seasonally adjusted annual rate of $87.6 billion, which set a record. From a year ago, August orders shot up 14.1 percent, which was the steepest growth rate in five years.
July home prices nationally advanced 1.9 percent year over year. The rate of appreciation has gradually accelerated since reaching a 37-month low 0.8 percent in March.
GDP (3Q26, advance) and personal income/spending (September) are scheduled for Thursday.
Real GDP grew at an annualized rate of 2.2 percent in the June quarter. This was the 17th consecutive quarter of positive growth, with a high 4.5 percent in 3Q23 and a low of 0.1 percent in 1Q25.
In the 12 months to August, headline and core PCE (personal consumption expenditures) were up 3.42 percent and 3.01 percent respectively; May’s 3.82 percent and 3.16 percent respectively were the highest since May 2023 and February 2024, in that order.
Friday brings the employment cost index (3Q26). In the June quarter, private-industry total compensation rose 3.3 percent from a year ago. This was the slowest pace of growth in five years.
WTI crude oil: Currently net long 65.3k, down 12.1k.
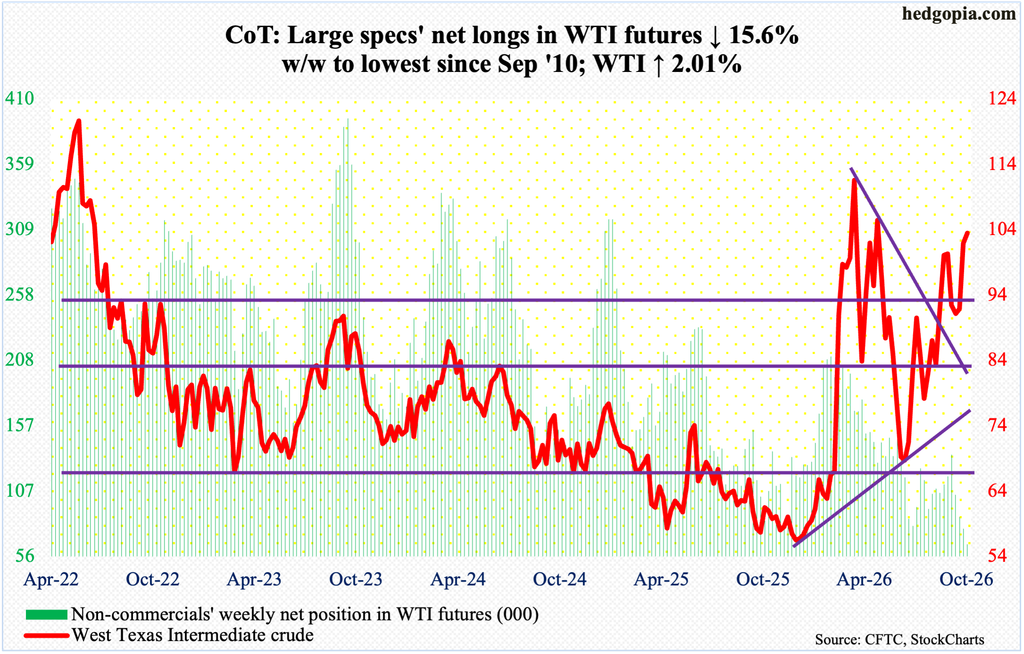
West Texas Intermediate crude continued to push toward $106-$107, rallying a couple of percent this week to $103.45/barrel.
On September 15, the crude reversed lower after ticking $106.75. Before that, it bottomed on July 2 at $67.04, which filled a gap from March 2 when WTI had a six-session surge in the wake of the February 28 U.S. and Israeli military attack on Iran. It subsequently peaked on the 9th at $119.48; on February 27, it closed at $67.02, with a session high $67.83 and a low $64.85.
From the March high, WTI traded within a pattern of lower highs and higher lows. The resultant trendline resistance gets tested around $105 – just below the previously mentioned $106-$107.
In the meantime, as per the EIA, U.S. crude production in the week to October 16 decreased 410,000 barrels per day week over week to 13.269 million b/d; output hit a record 13.979 mb/d in the week to October 2. Crude imports, too, dropped, down 291,000 b/d to 5.8 mb/d. As did crude and gasoline stocks, which declined 3.1 million barrels and three million barrels to 412.5 million barrels and 205.3 million barrels respectively; distillates inventory went the other way, up 1.7 million barrels to 104.3 million barrels. Refinery utilization edged lower one-tenth of a percentage point to 93.4 percent.
E-mini S&P 500: Currently net short 142.7k, up 1.7k.
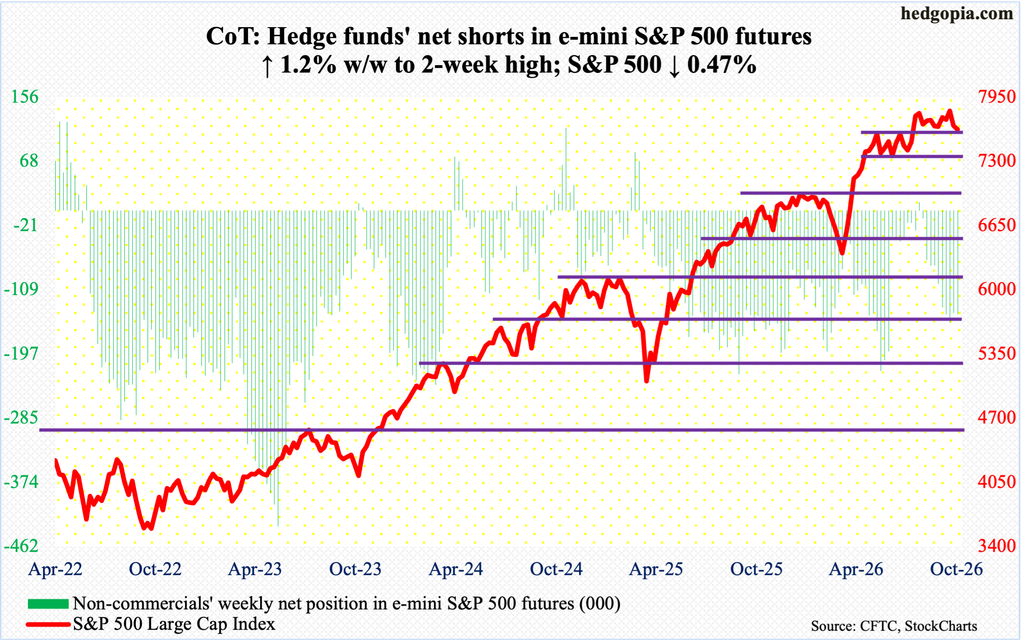
Equity bulls could not have begun the week better, with the S&P 500 up 1.4 percent by Wednesday’s intraday high of 7770, but they failed to keep up the momentum. The decline in the latter two sessions cost the large cap index all those gains and then some. In the end, the week was down 0.5 percent to 7624.
This was the second week of loss in succession. In the week before that, the S&P 500 looked poised for a breakout, as it had gone sideways in a 200-point range for two and a half months, with resistance north of 4800 and support north of 4600; the breakout opportunity went begging.
Even earlier, the index consolidated for a couple of months after peaking at 7621 on June 2, with a breakout on August 4, followed by the August 13 high of 7817 and a newer high 7845 posted on the 6th this month.
Having closed this week right north of 7600, the index currently sits at a make-or-break juncture. As things stand, the momentum is down, with high odds of a breach of this crucial support. The 50-day (7700) was compromised on Thursday.
Euro: Currently net short 134.5k, down 3k.
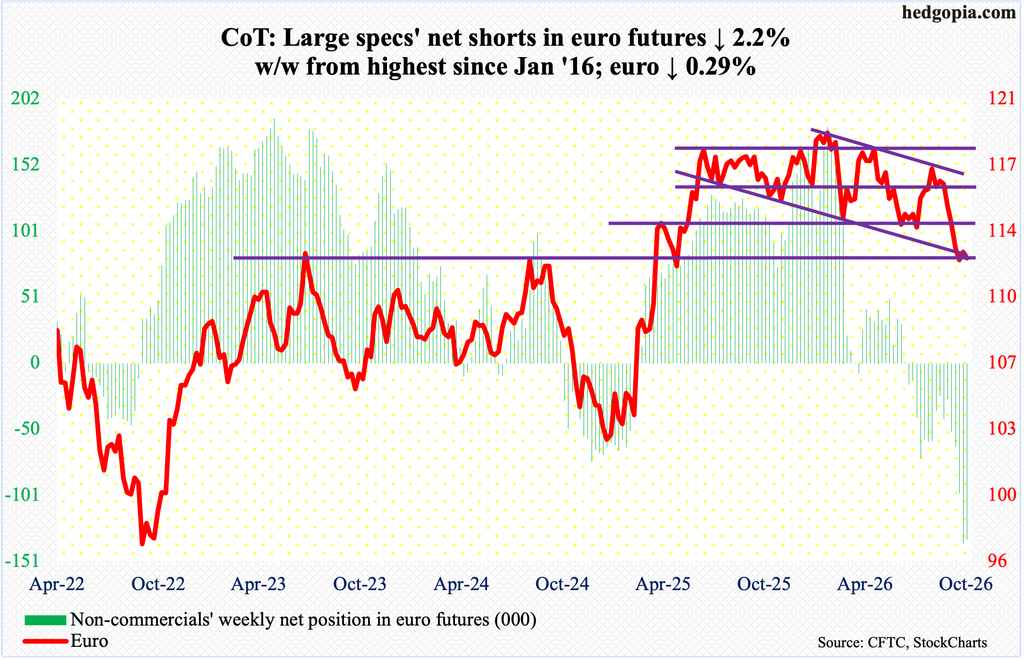
Last week, for the first time in six weeks, the euro rallied. Bulls this week failed to maintain the up momentum, as it gave back 0.3 percent to $1.1205, with Friday ticking $1.1185 intraday. Last week’s low of $1.1113 remains intact.
The euro is near dual support at $1.12 – horizontal plus descending channel. It has been under downward pressure since peaking on January 27 this year at a four-and-a-year high $1.208. Three weeks ago, it broke crucial range support at $1.14. For more than a year, it vacillated between $1.14 and $1.18.
On particularly the weekly, the currency remains way oversold, and unwinding of these conditions looks probable – more so if non-commercials, who are neck-deep in net shorts, decide to lock in gains.
Gold: Currently net long 199.9k, down 8k.
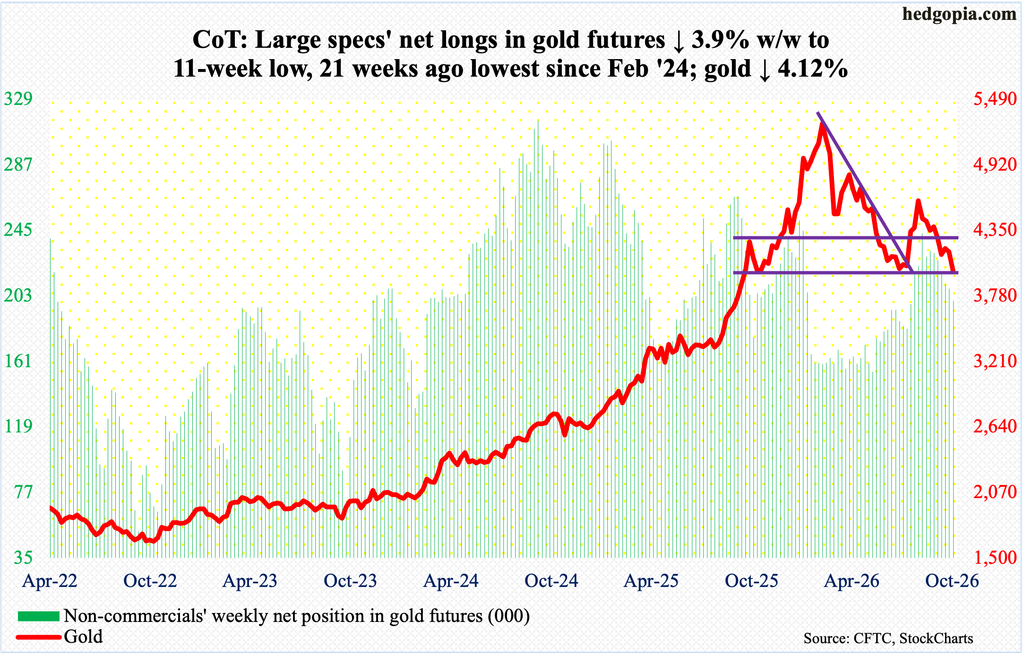
Gold bugs are facing a do-or-die moment – pretty much. Gold declined 4.1 percent this week to $3,995/ounce. It has taken a beating since January 29 this year when it peaked at $5,608, rallying from $3,312 in August last year, and $1,810 in October 2023. On August 25, the metal began to retreat after tagging $4,697 intraday.
Before that, gold went sideways at $3,900-$4,000 for six consecutive weeks in June-July this year before turning up. This crucial support is now being tested, and the momentum is down. Bulls have their work cut out for them. If they manage to regroup, nearest resistance lies just north of $4,100.
Nasdaq (mini): Currently net long 50.7k, up 2.2k.
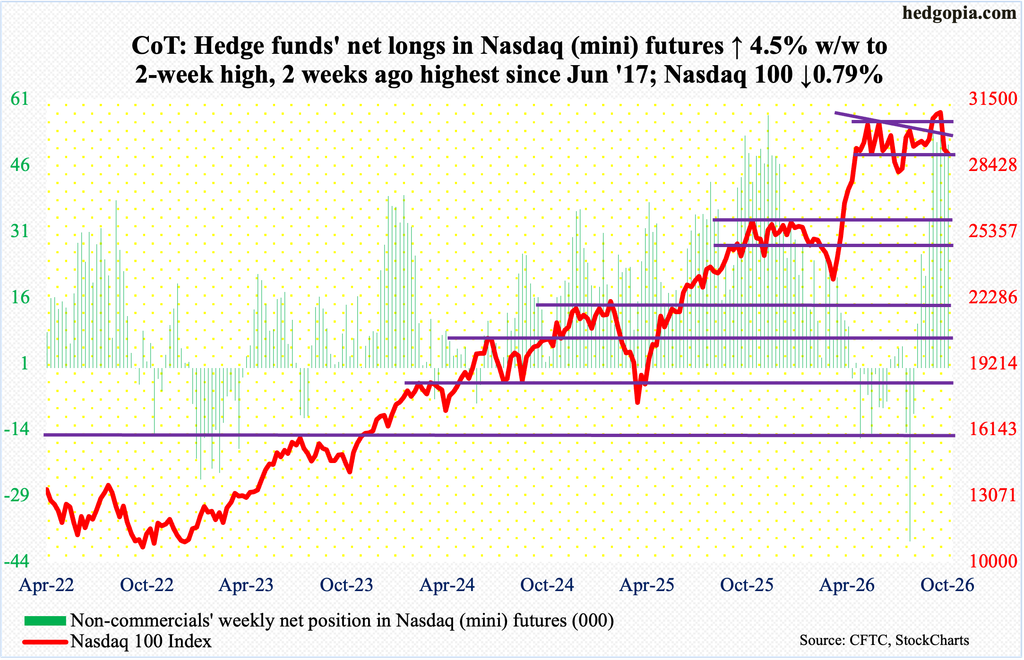
From the March 30 low of 22841 to the fresh all-time high of 31361 on the 6th this month, the Nasdaq 100 jumped 37.3 percent; going back further, it surged 89.6 percent from the April 2025 low of 16542. These are heady gains, some of which are being given back.
The tech-heavy index dropped 0.8 percent this week to 28958. This is the second consecutive weekly drawdown, preceded by a weekly doji, which showed up in the same week the previously mentioned all-time high was posted.
Suddenly, investors are genuinely worried about the amount of debt being raised by tech companies to finance the buildout of AI infrastructure. Bond yields are higher, while CDSs (credit default swaps) are widening, most prominently CoreWeave (CRWV)’s, and less alarmingly Oracle (ORCL)’s and SoftBank (SFTBY)’s. If this is offering a window into what is to come, raising the massive investments needed for AI capital spending will be increasingly difficult in the months and quarters to come.
The Nasdaq 100 is beginning to reflect these fears, closing right at horizontal support at 28800s, a likely breach of which should result in a hurried test of the 200-day (27836).
Russell 2000 mini-index: Currently net short 41.9k, down 19.1k.
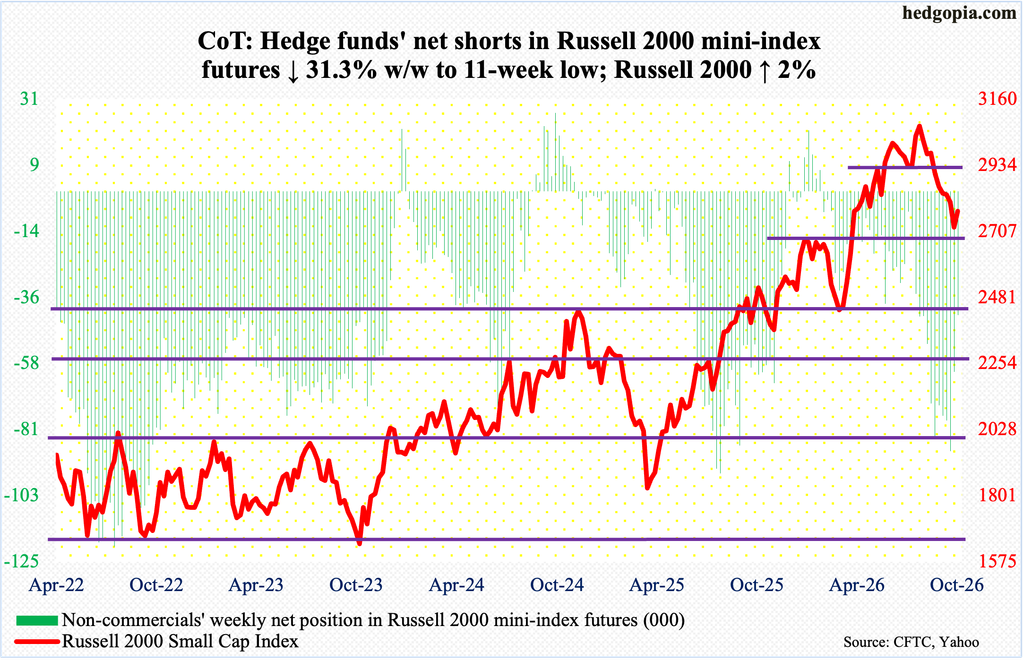
Last week’s close of 2721 put the Russell 2000 just above horizontal support at 2700. This week, small-cap bulls’ willingness to defend this level became evident as early as Monday when the session low 2725 was embraced. By the end of the week, the index added two percent to 2776.
This finally put an end to a streak of six weekly losses in a row – and eighth in nine. The small cap index earlier peaked at 3070 on August 14.
The Russell 2000 has closed below the 200-day (2795) for eight consecutive sessions, and this is the nearest hurdle as far as the bulls are concerned. Once this is taken care of, there is lateral resistance at 2880s, and then 2940s.
US Dollar Index: Currently net long 15k, up 2.1k.
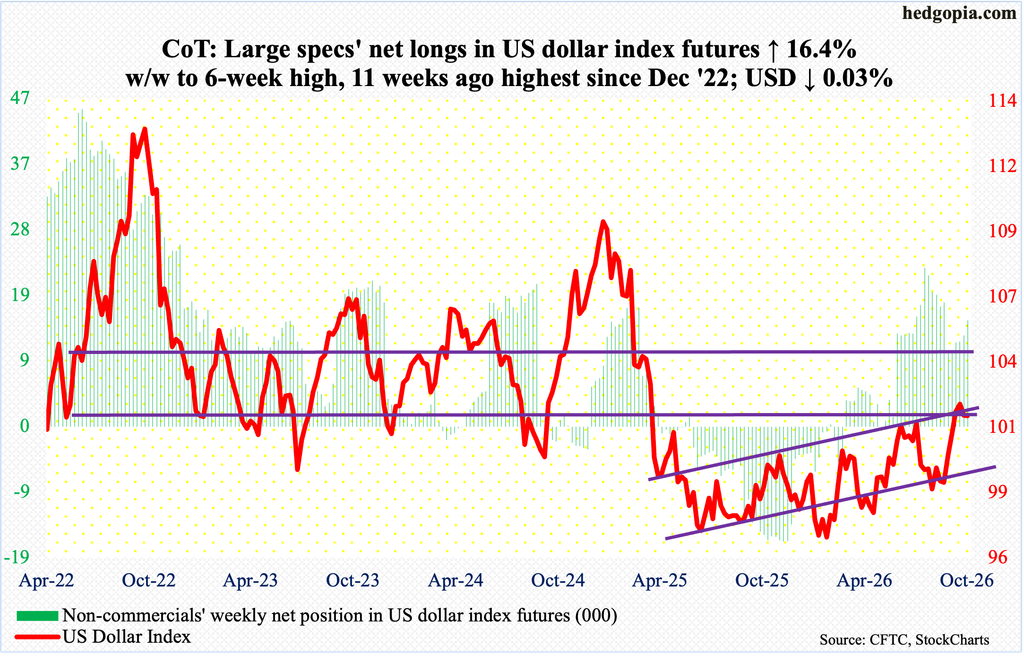
After last week’s reversal from Wednesday’s intraday high of 102.94 to Friday’s close of 101.78, dollar bulls struggled this week to launch a rally. They did try Monday with the session tagging 102.08 intraday but only to end the week at 101.75, down 0.03 percent for the week.
The index has come a long way from the intraday low of 98.60 set on September 7, which essentially tested the 98.56 reached on August 20-21.
Earlier, the US dollar index had been under pressure since getting rejected at 101-102 for six weeks in a row in June-July. The significance of 100 – or just north of it – goes back to March 2015. These levels are likely to be tested in the sessions to come. The 50-day rests at 100.51.
VIX: Currently net short 96.5k, up 54.
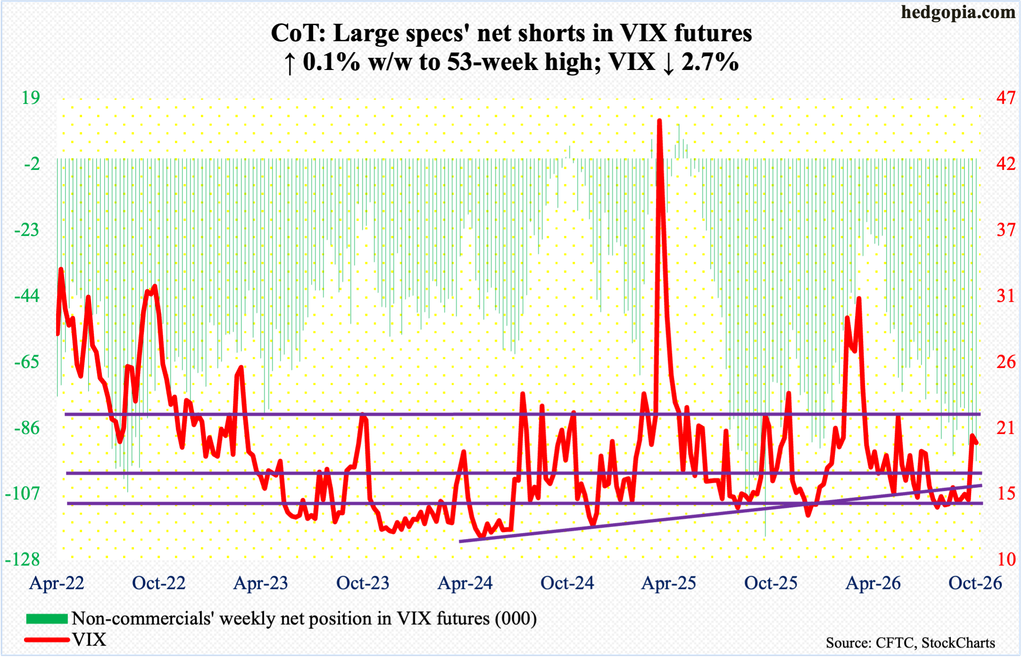
This was a week in which both the S&P 500 and VIX went red, with the latter down 0.54 points to 19.45. Nevertheless, the volatility index finished above the 200-day (18.19).
Bulls’ problem of late has been their inability to hang on to the gains. This week, they gave back Friday’s intraday high of 20.66; ditto with the high of 22.31 a week before that.
With that said, VIX has room to rally on both the daily and weekly.
Thanks for reading!
