Following futures positions of non-commercials are as of November 27, 2018.
10-year note: Currently net short 284.2k, down 83k.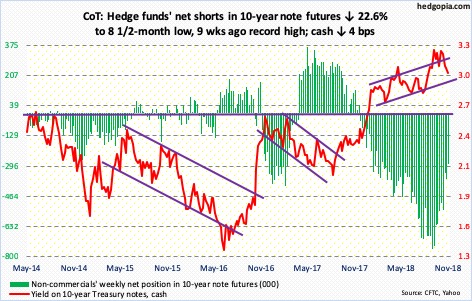
Jerome Powell, Fed chair, moved markets on Wednesday. A whole host of asset classes reacted to his Economic Club of New York speech. Early October, he had suggested that interest rates were still “a long way” from neutral. After three 25-basis-point hikes this year, December (18-19) is all set to witness another hike. The FOMC dot plot expects three more next year. Markets are nowhere near that. So when Powell made that comment on October 3, an overbought equity market took it as an excuse to sell off. From an intraday high of 2939.86 in that session through a low of 2603.54 on October 29, the S&P 500 large cap index collapsed 11.4 percent.
Wednesday, he said rates were “just below” the neutral range. Markets took it as a shift downward in his prior hawkish stance. The 10-year Treasury rate (3.01 percent) moved lower by a basis point. The US dollar index shed 0.6 percent. Stocks ripped higher. But was this a case of oversold stocks looking for an excuse to rally or is there a genuine change in his stance? In the speech, he said nothing to the effect of inflation and the economy growing less than the central bank’s forecast.
That said, of late, there is definitely a decelerating trend in the macro data. In the 12 months to October, for instance, core PCE – the Fed’s favorite measure of consumer inflation – rose 1.78 percent, much slower than the 2.02-percent pace in July. Other data, such as ISM manufacturing and GDP, are similarly softening.
Thus, if he thought markets read him wrong, he will have an opportunity to correct himself in a little over two weeks, when the FOMC meets. How the dot plot shifts – if at all – will be a tell. Until then, markets will be on pins and needles, with this weekend’s G20 meeting the most likely catalyst near term.
30-year bond: Currently net short 92.8k, up 7.8k.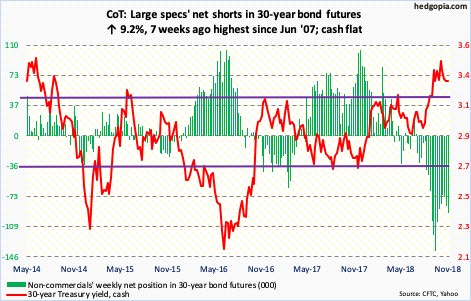
Major economic releases next week are as follows.
On Monday, November’s ISM manufacturing index is on tap. In October, manufacturing activity dropped 2.1 points month-over-month to 57.7. August’s 61.3 was the highest since 61.4 in May 2004.
Labor productivity (3Q18, revised) and the ISM non-manufacturing index (November) are scheduled for Wednesday.
Preliminarily, non-farm output/hour over the last four quarters grew 1.3 percent. Productivity remains suppressed.
Services activity shrank 1.3 points m/m in October to 60.3. September’s 61.6 was the highest ever (data only goes back to January 2008).
Thursday brings revised and detailed estimates of durable goods for October. The advance report showed orders for non-defense capital goods ex-aircraft – proxy for business plans for capex – rose 3.4 percent year-over-year to a seasonally adjusted annual rate of $69.4 billion. Orders grew 8.8 percent as recently as July.
November’s employment report and University of Michigan’s consumer sentiment index (December, preliminary) will be published Friday.
October saw the creation of 250,000 non-farm jobs, for a monthly average this year of 213,000. If this pace sustains in the remaining two months, this would have ended a three-year downtrend. The monthly average was 182,000 in 2017, 195,000 in 2016, 226,000 in 2015 and 250,000 in 2014.
Consumer sentiment fell 1.1 points m/m in November. March’s 101.4 was the highest since 103.8 in January 2004.
Crude oil: Currently net long 416.2k, down 5k.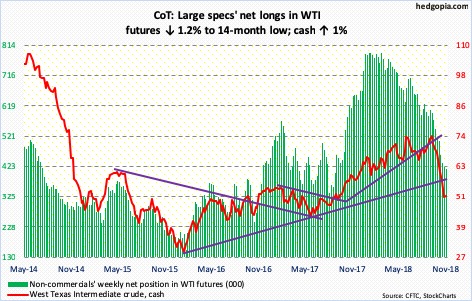
OPEC plus Russia and other allies meet on December 6-7 to discuss a supply cut of one to 1.4 million barrels per day. Since the intraday high on October 3 of $76.90/barrel through Thursday’s low of $49.41, spot West Texas Intermediate crude collapsed nearly 35.7 percent. The decline is not as steep as was witnessed in 2008-2009 (77.2 percent) and in 2014-2016 (75.8 percent), but painful if you are a producer. On both those occasions, OPEC responded with supply curbs.
Ahead of the meeting, the crude ($50.93) is trying to stabilize, going sideways this week. Given the circumstances and the technical damage it has suffered, this should be considered healthy. Immediately ahead, resistance lies at $52.25-ish.
Speaking of supply, in the week to November 23, US crude stocks rose another 3.6 million barrels to 450.5 million barrels, now up 56.3 million barrels over 10 weeks. Distillate stocks rose 2.6 million barrels to 121.8 million barrels. As did crude imports, up 608,000 barrels per day to 8.2 million b/d. Crude production remained unchanged at 11.7 mb/d. Gasoline stocks, however, dropped 764,000 barrels to 224.6 million barrels. Refinery utilization rose 2.9 percentage points to 95.6 percent.
E-mini S&P 500: Currently net long 215.4k, down 8.9k.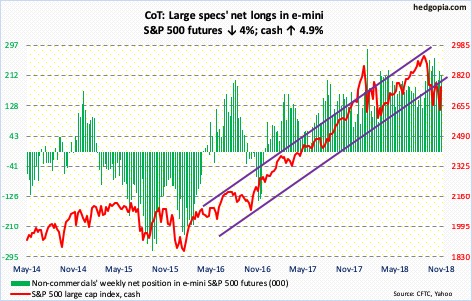
Given the drop the cash (2760.17) has had and the oversold condition it was in, bulls yearned for a reason to hang their hat on. Powell provided that with his supposedly dovish speech on Wednesday. Another catalyst could come this weekend at the G20. If it is perceived well – or if bulls manage to spin it that way – weekly conditions are oversold enough they could continue to get unwound in a seasonally favorable period.
The S&P 500 jumped 4.9 percent this week to close right underneath the 200-day moving average. That is a lot for a week. Should next week opens with a rally, real test lies at 2800, or just north of it. Since the S&P 500 sold off in January-February this year, this level has proven significant, including mid-October and early this month when selling accelerated at that level.
In the week to Wednesday, US-based funds lost $8.5 billion (courtesy of Lipper). In the same week, SPY (SPDR S&P 500 ETF) lost $1.6 billion and VOO (Vanguard S&P 500 ETF) $116 million, even as IVV (iShares core S&P 500 ETF) gained $305 million (courtesy of ETF.com).
Euro: Currently net short 55.1k, up 7.8k.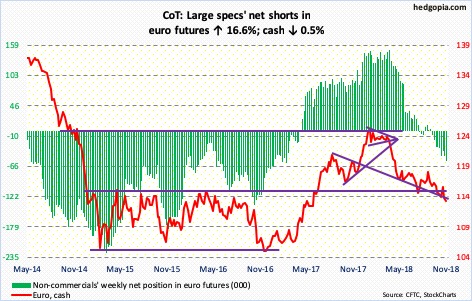
The cash ($112.81) fell intraday from $125.37 on January 22 to $112.15 on the 12th this month. Conditions are deeply oversold. Bulls thus far have managed to defend $113 – or thereabouts – even though it has been breached several times this month. Rallying off of this support has proven difficult.
Non-commercials have been adding to net shorts.
Gold: Currently net long 1.9k, down 7k.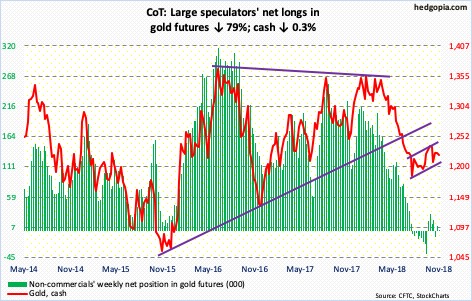
The cash ($1,220.20/ounce) continues to consolidate. Gold dropped from $1,369.40 in April to $1,167.10 mid-August. Since that low, the metal has traded within a slightly rising channel. Concurrently, bulls have managed to save support at $1,213, while bears show up at $1,240. Gold bugs would have improved their odds substantially if they could bolt past this resistance. Until then, they should be happy with the current sideway pattern, with the caveat that the daily chart is now beginning to get overbought.
In the week ended Wednesday, $46 million came out of GLD (SPDR gold ETF). IAU (iShares gold trust ETF) has not seen any activity in the past 10 sessions (courtesy of ETF.com).
Nasdaq 100 index (mini): Currently net long 13.7k, up 9.3k.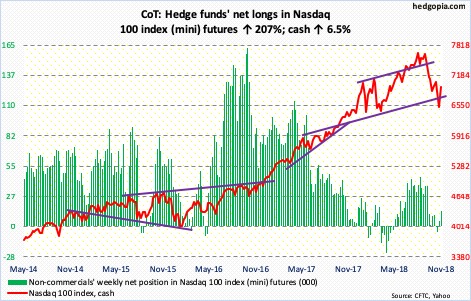
On October 11, when the daily RSI had dropped to just north of 20, the cash (6949.01) put in a low. The Nasdaq 100 went on to make two more lows, the latest of which came on the 20th this month. The RSI in the meantime made higher lows. Bulls should like this divergence. They should just hope the momentum since the reversal low from eight sessions ago continues. And also that, flows improve.
In the week through Wednesday, QQQ (Invesco QQQ Trust) lost $448 million (courtesy of ETF.com).
For now, having rallied 6.5 percent this week, in the best of circumstances the index is likely to rally to 7100 before bulls are forced to lock horns with bears. Both the 50- and 200-day lie there – 7087.31 and 7077.03, respectively. After that comes 7300, which rejected rally attempts mid-October.
Russell 2000 mini-index: Currently net short 24.3k, down 3.8k.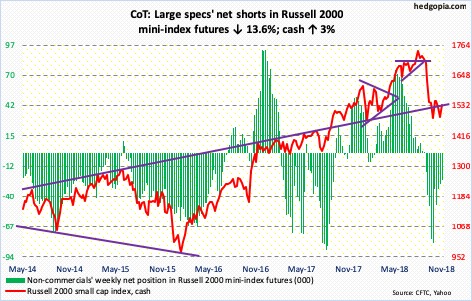
The cash (1533.27) rallied three percent this week, healthy but much weaker versus US peers. This followed last week’s defense of support at 1450-ish, which goes back 16 months. Small-cap bulls would have improved their odds if they recapture 1535.
In the week to Wednesday, IWM (iShares Russell 2000 ETF) lost $98 million, while IJR (iShares core S&P small-cap ETF) took in $23 million (courtesy of ETF.com).
US Dollar Index: Currently net long 39.3k, down 33.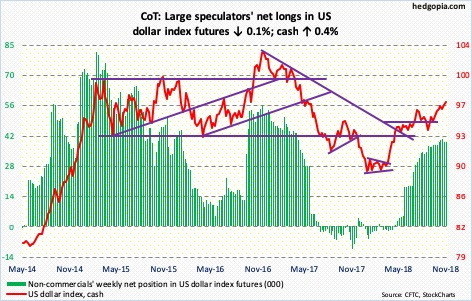
On the 12th, the cash (97.20) began retreating from an intraday high of 97.53, which was the highest since May 2017. After dropping to 95.93 in the next six sessions, the US dollar index rallied again, only to see sellers show up near that prior high. Thursday, it rallied to 97.46, before coming under pressure. But bulls showed up Friday at/near shorter-term averages. In the event the index proceeds to unwind weekly overbought conditions, major support lies just north of 95. Before that, the 50-day rests at 95.83.
VIX: Currently net long 27.6k, down 7.9k.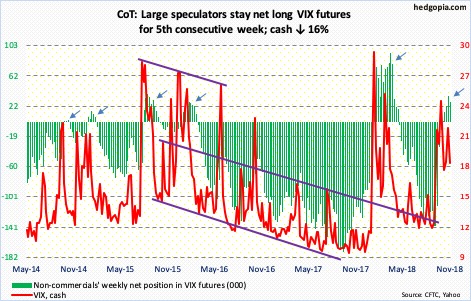
Wednesday when the S&P 500 rallied 2.3 percent, the cash (18.07) only fell 0.53 to 18.49. It held up due likely to the uncertainty surrounding trade talks at the G20 meeting. This also means, should a favorable outcome come out of Argentina – or should it be viewed this way by traders – there is room for volatility to subside.
At the same time, the 21-day moving average of the CBOE equity-only put-to-call ratio has come under pressure since the 23rd when it rose to 0.708, which is relatively high. There is a long way to go on the downside before this mini-panic among equity investors gets unwound. Friday, the ratio stood at 0.685.
Thanks for reading!

